Here, we present a protocol to standardize the positron emission tomography-computed tomography (PET-CT) imaging protocol, interpretation, and analysis in tuberculosis infection research using a semi-automated, open-source software platform. This approach minimises inter-operator variability and improves reproducibility across study cohorts.
Method Article
Semi-Automated Quantification of 18F-FDG PET-CT in Pulmonary TB Contacts and Its Association with Prospective Outcomes
* These authors contributed equally
In This Article
Summary
Abstract
Positron emission tomography-computed tomography (PET-CT) has shown potential as a research tool to characterize heterogeneity in tuberculosis (TB) infection. Prospective utilisation of this technology will require standardization of imaging protocols, interpretation, and analysis of PET-CT images to improve generalizability and data assimilation between discrete cohorts. We evaluated a semi-automated approach using open-source software to minimize inter-operator variability of imaging interpretation and use reference organ normalization to lower variability in physiological uptake.
We quantified 18F-Fluorodeoxyglucose (FDG) uptake in intrathoracic lymph nodes (ITLNs) of eleven interferon-gamma release assay (IGRA) positive TB contacts that enrolled on a prospective observational study, including eight contacts with serial PET-CT scans. The imaging was analyzed using 3D Slicer, an open-source medical imaging platform designed for biomedical and clinical research, that provides semi-automated segmentation and automated liver quantification. The extracted data included ITLN maximum standardized uptake value (SUVmax), mean standardized uptake value (SUVmean), metabolic volume (MV), and total lesion glycolysis (TLG), and liver SUVmean. We compared its performance to that of clinical software, both with and without standardizing to liver uptake (as a physiological reference), and assessed operator variability. Then, we evaluated the association between multiple quantitative PET metrics and prospective outcomes in pulmonary TB contacts.
We report strong agreement between open-source and clinical image evaluation platforms. We find semi-automated PET quantification can lower inter-operator variability, and standardizing to reference organs increases the sensitivity of imaging analysis. Specifically, we report preliminary findings that increasing metabolic activity on serial PET-CT in early infection is associated with detectable Mycobacterium tuberculosis (Mtb) at the anatomical site of FDG uptake, consistent with a progressive phenotype of infection.
Introduction
Tuberculosis (TB) is an infectious disease caused by bacteria of the Mycobacterium tuberculosis complex (MTBC), with Mycobacterium tuberculosis (Mtb) being the most common pathogen. TB disease continues to pose a significant burden on global health, affecting approximately 10.7 million people in 20241. In the same year, it was responsible for an estimated 1.23 million deaths globally, including 150,000 deaths among people living with HIV1.
TB infection is acquired when susceptible hosts inhale droplets containing MTBC from an infected person. A small proportion of those infected develop active TB disease, known as primary progressive tuberculosis. However, in the majority of cases, the infection is successfully controlled by the adaptive immune system, a state referred to as TB infection, or latent tuberculosis infection (LTBI)2. TB infection encompasses a spectrum of infection states with varying risk of progression to active disease. Preventing the progression of TB infection to active disease is crucial to meeting the End TB Strategy goal for TB eradication3,4. However, the immunological mechanisms that determine the trajectory of TB infection remain poorly understood.
Positron emission tomography-computed tomography (PET-CT) has emerged as a promising research tool to reveal underlying heterogeneity in TB infection states, and is increasingly being considered as a biomarker to assess treatment response and stratify the risk of disease relapse in TB clinical trials5,6,7,8. We have previously described PET-CT based phenotype of pre-clinical infection and suggested that incorporating metabolic and structural characterization could offer clinically relevant stratification9. However, there is significant heterogeneity in the analysis of PET-CT imaging in TB infection research, limiting the comparison10. Importantly, changes in metabolic activity observed on serial imaging are likely to be smaller in asymptomatic individuals with TB infection, necessitating the need for approaches that accurately assess global metabolic burden.
Normalization using reference organs can reduce variability in 18F-Fluorodeoxyglucose (FDG) uptake in interval scans11. However, manual measurement of FDG uptake in the reference organ can also introduce variability in the threshold12. An automated technique to determine the volume of interest (VOI) in the reference organ has been proposed to minimise the inter-operator variability13. In addition, semi-automated segmentation of target lesions can further reduce variability in measurement14, significantly decrease the time required for segmentation, and improve efficiency15.
PET-derived metabolic activity in human TB research is often assessed using the maximum standardized uptake value (SUVmax). Although SUVmax is a widely used marker of disease activity and treatment response, it can overestimate metabolic activity due to image noise16, and a two-dimensional region of interest (ROI) may not capture the pixel with the highest value17. In this context, volumetric parameters such as metabolic volume (MV) and total lesion glycolysis (TLG) have been reported to be prognostic markers for treatment outcome in active TB18 and are more sensitive than SUVmax in detecting early treatment response19. Specifically, TLG considers both mean standardized uptake value (SUVmean) and metabolic volume, thereby offering a composite measure of metabolic activity within a defined volume of interest (VOI).
In this study, we present methodologies for employing an open-source research imaging platform20, which provides semi-automated lesion segmentation and automated liver quantification. We apply this approach to the analysis of serial PET-CT scans from asymptomatic, interferon-gamma release assay (IGRA) positive pulmonary TB contacts enrolled in a prospective observational study9. The study design has been described previously21. In brief, HIV-uninfected, adult (≥16 years old) household contacts of bacteriologically confirmed pulmonary TB cases were recruited shortly after index diagnosis in Leicester, UK. Participants completed a symptom questionnaire, chest radiography (CXR), and IGRA testing. IGRA-positive participants had PET-CT scan at baseline. Those with positive PET-CT findings were investigate for active TB. If active TB was not confirmed, a repeat scan was performed 3 months later to characterize the infection trajectory. Participants were prospectively followed with clinical review and symptom questionnaire every 3 months for 12 months, followed by an additional 12 months of passive follow-up. We compare the performance of this research platform to that of clinical software, assess inter-operator variability, and explore the association between PET parameters and prospective outcomes.
Protocol
The study was approved by the Research Ethics Committee (REC) for East Midlands - Nottingham 1, Nottingham, UK (REC 15/EM/0109).
1.PET-CT procedures
NOTE: PET-CT procedures were conducted in accordance with local hospital standard operating procedures and complied with the Ionising Radiation Regulations 2017 (IRR17)22 and the Administration of Radioactive Substances Advisory Committee (ARSAC) recommendations23.
- Patient identification: Confirm the patient's identity using a 3-point ID check (full name, date of birth, and address) against the referral and imaging request.
- Patient safety questionnaire: Review and complete the patient safety screening questionnaire, ensuring all relevant medical history, allergies, pregnancy status, and contraindications are addressed.
- Clinical history verification: Confirm and document the patient's clinical history to ensure alignment with the referral and imaging requirements.
- Procedure explanation: Clearly explain the procedure, including the purpose of the PET scan, injection of a radioactive tracer, and associated radiation risks and safety precautions
- Informed consent: Ensure the patient understands the procedure and risks, then obtain written informed consent.
- IV cannulation: Insert a 22 to 24-G intravenous (IV) catheter, preferably into the median cubital, cephalic, or basilic vein at the antecubital fossa using aseptic technique.
- Confirm vein patency: Flush the catheter with 10 mL of sterile saline to confirm vein patency. If unsure, consult a colleague for verification.
- Withdraw dose according to protocol: Draw up the calculated activity of the radiotracer: 3.5 MBq/kg ± 10%, not to exceed 400 MBq.
- Draw up radiotracer: Using either 1 mL, 3 mL, or 5 mL plastic syringe (depending on volume required), with the appropriate syringe shield, draw up the radiotracer dose.
- Record pre-injection activity: Measure and record the radioactivity level of the syringe using a dose calibrator, note the exact time, and place the syringe in a lead shielded syringe carrier.
- Inject radiotracer: Slowly inject the radiotracer through the IV line, followed immediately by a 10 mL flush of sterile saline to ensure complete administration.
- Record injection time: Accurately document the time of injection by checking a calibrated wall clock.
- Secure radioactive materials: After injection, disconnect and place the used syringe securely in a lead carrier box.
- Remove IV catheter: Remove the IV catheter carefully using appropriate radiation precautions to prevent contamination.
- Measure residual activity: Place the used syringe back into the dose calibrator to measure residual activity and record the value and time.
- Dispose of waste safely: Dispose of the syringe and any radioactive waste in a designated radioactive waste container following institutional guidelines.
- Uptake period: Instruct the patient to rest quietly in the 'hot waiting room' for 50 minutes to 1 hour to allow for optimal tracer uptake.
- Position for imaging: After the uptake period, escort the patient to the camera room and assist them to lie supine on the PET scanning table.
- Final ID check: Perform a final patient ID check and confirm details against the scanner console before proceeding.
- Start PET-CT scan: Once the correct patient is selected on the console, begin the PET-CT scan according to protocol.
- Post-scan instructions: After the scan, escort the patient to the exit area and advise they may resume normal eating and drinking.
- Radiation safety advice: Reiterate radiation safety precautions:
Avoid close contact with children and pregnant women for at least 8 h after the scan. - Encourage hydration: Advise the patient to hydrate well over the next 24 h to promote clearance of the radiotracer via urination.
- PET image reconstruction: Perform PET 3D iterative image reconstruction with the following parameters: Bayesian penalized likelihood (PL) reconstruction algorithm with CT-based attenuation, ramp projection filter, and scatter correction yielding a 310-slice image.
2. Quantification of FDG avid intra-thoracic lymph node using the 3D Slicer platform
NOTE: In this study, anonymized PET-CT DICOM images were analyzed using 3D Slicer version 5.4.0 (https://www.slicer.org/). PET image data was extracted by a consultant thoracic PET-CT radiologist (reader 1) and a trained respiratory registrar (reader 2). PET-CT images with intra-thoracic lymph node FDG uptake above the physiological reference FDG uptake were included for analysis. Physiological reference was determined by liver SUVmean + 3 standard deviations (SD)11.
- Install extensions.
- Open the Extensions Manager.
- Install the following extensions: PETDICOMExtension, PETTumorSegmentation, PETLiverUptakeMeasurement, and PET-IndiC.
- After installation, restart 3D Slicer.
- Upload anonymized PET-CT DICOM images to 3D Slicer.
- Go to Add DICOM Data > Import DICOM files.
- Perform liver quantification (reference tissue).
- Method I (automated measurement)
- Go to Quantification > PET Liver Uptake measurement.
- In the Input Volume dropdown menu, select PET image.
- In the Output Volume dropdown menu, select Create New LabelMapVolume.
- Click Segment Reference Region.
- Check the resulting region for correctness. If automated liver segmentation fails, proceed to Method II.
- Save the mean SUV and standard deviation values under Measurements.
- Method II (manual measurement)
- Go to Segment Editor.
- In the Source volume dropdown menu, select the PET image.
- Click Add.
- Use Paint (select Sphere brush) to create VOI on a homogeneous region of the liver parenchyma.
- Go to Quantification > Segment Statistics.
- In the Scalar volume dropdown menu, select PET image.
- Under Advanced Options, select PET Volume Statistics (or Scalar Volume Statistics) and choose Mean and Standard Deviation.
- Click Apply.
- Method I (automated measurement)
- Segment intrathoracic lymph nodes.
- Create a new segmentation using Segment Editor.
- Use the Threshold tool. Set the lower limit to SUVmeanliver + 3 × SDliver. Click Apply. This will highlight all regions in the body above the threshold.
- Exclude areas outside the intrathoracic lymph nodes.
- Method I: Manual clean up: Use the Scissors tool with Erase Inside or Erase Outside in Segment Editor to remove regions outside the lymph node areas
- Method II: Islands effect: Apply the Islands effect in Segment Editor. Use the Split Islands to Segments function to divide disconnected hot regions into separate segments. Delete segments outside the lymph node area. Small noise regions may require additional clean up.
- Quantify segmented lymph nodes.
- Go to Quantification > Segment Statistics.
- In the Scalar Volume dropdown menu, select the PET image.
- Under Advanced options, select PET Volume Statistics (or Scalar Volume Statistics) and choose the measurements. Note that TLG needs to be calculated manually by multiplying SUVmean and MV, using values obtained from the scalar volume statistics.
- Click Apply.
Results
Study cohort
Statistical methods are provided in Supplementary File 1.
Sixteen IGRA-positive contacts from nine microbiologically confirmed pulmonary TB index cases (eight smear-positive) had a PET-CT scan. Twelve participants had positive PET-CT scan; in one participant, FDG uptake was limited to the lung parenchyma. Eleven of sixteen IGRA-positive participants had FDG uptake in intrathoracic lymph nodes above the threshold and were included for the analysis. All eleven were contacts of smear-positive pulmonary TB from seven index cases. Median age was 32 (IQR 18-46) years. Five (45.5%) were male. Nine (81.8%) were born outside the UK. Seven (63.6%) were never smokers, three (26.3%) were current smokers, and one (9.1%) was an ex-smoker.
Eight participants had a repeat PET-CT at 3 months. Thus, a total of 19 PET-CT scans from eleven treatment naïve contacts were included.
Liver quantification
Of nineteen PET-CT scans, the automated liver quantification failed in two cases: in one, the automatically placed ROI included structures outside the liver, and in another, the algorithm misidentified the liver and instead quantified the right thigh muscle. Bland-Altman analysis demonstrated high agreement between automated and manual measurements of liver SUVmean and liver SUVmean + 3 SD, with minimal bias and narrow 95% limits of agreement (Supplementary Figure 1, Supplementary Table 1). Consistency between the two methods was excellent for both metrics (Interclass correlation coefficients [ICC] = 0.989 and 0.972 for SUVmean and SUVmean + 3 SD, respectively).
Inter-platform reliability of clinical and research platforms
Bland-Altman analysis demonstrated strong agreement between clinical and research platforms across all PET-derived quantitative parameters (Table 1, Supplementary Figure 2). Liver SUVmean and volumetric parameters (MV and TLG; log-transformed) showed minimal bias with narrow relative limits of agreement. Across the quantitative metrics, SUVmax demonstrated the largest absolute mean difference between platforms (0.62, 95% CI 0.40 - 0.83), indicating a small but systematic upward shift in SUVmax values on the clinical platform. However, relative differences remained low and overall concordance was excellent (CCC = 0.99). SUVmean and liver SUVmean + 3 SDs also demonstrated minimal bias, with slightly wider absolute limits of agreement, though their relative limits remained within an acceptable range.
Concordance correlation coefficients supported these findings, with excellent agreement for ITLN SUVmax, MV, and TLG (CCC = 0.95-0.99) and moderate-to-high agreement for liver SUVmean and ITLN SUVmean (CCC = 0.90-0.95). Liver SUVmean + 3 SDs showed fair agreement (CCC = 0.85). Overall, 3D Slicer produced quantitative results that were highly consistent with those obtained from the clinical software.
Inter-operator reliability of 3D Slicer
Bland-Altman analysis demonstrated excellent inter-reader agreement across all PET parameters extracted in 3D Slicer, with mean differences near zero and consistently narrow limits of agreement (Table 2, Supplementary Figure 3). Volumetric parameters (MV and TLG; log-transformed) showed the tightest limits of agreement, reflecting highly consistent segmentation and quantification. Interclass correlation coefficients further supported excellent inter-reader reliability, with ICC values > 0.95 for all PET-derived quantitative metrics (Table 2). These findings confirm that the 3D Slicer provides highly reproducible quantitative measurements between readers.
Application to longitudinal PET-CT features
Eight untreated IGRA-positive participants underwent follow-up PET-CT scans at 3 months (Supplementary Figure 4 and Supplementary Table 2). Of these, three individuals received anti-TB treatment. Two commenced on treatment shortly after the follow-up scan: one with confirmed Mtb infection from an intrathoracic lymph node sample, and one who developed a new lung lesion on the 3-month PET scan that resolved with treatment. The third individual developed symptoms of TB during the 2-year prospective follow-up period and underwent a further clinical PET-CT scan, which showed increased FDG uptake in the same lymph node that had been avid at baseline. An endobronchial ultrasound-guided transbronchial needle aspiration (EBUS-TBNA) sample confirmed Mtb infection at this site.
Two participants that were treated for TB after 3 months demonstrated increased SUVmax, SUVmean, MV and TLG (Figure 1A1,B1,C1,D1). However, the person who was diagnosed with TB at 2 years showed decreasing SUVmax, SUVmean, and TLG (Figure 1A1,B1,D1). The MV in this patient remained unchanged (1.50 cm3 to 1.52 cm3) (Figure 1C1). However, physiological FDG uptake measured by Liver SUVmean + 3 SDs was significantly lower at the 3-month scan (3.69 to 2.04), raising the possibility of variability in physiological FDG uptake obscuring interpretation of changes in pathological uptake. Next, we standardized PET parameters to physiological activity to mitigate this variation. Normalizing to FDG uptake in the liver revealed increased SUVRmax, and to a lesser extent, increased SUVRmean and normalized TLG in the individual diagnosed with TB at 2 years. (Figure 1A2, B2, D2). Participants who remained disease-free demonstrated decreasing SUVmax, SUVmean, MV, and TLG between baseline and 3 months (Figure 1A1,B1,C1,D1).
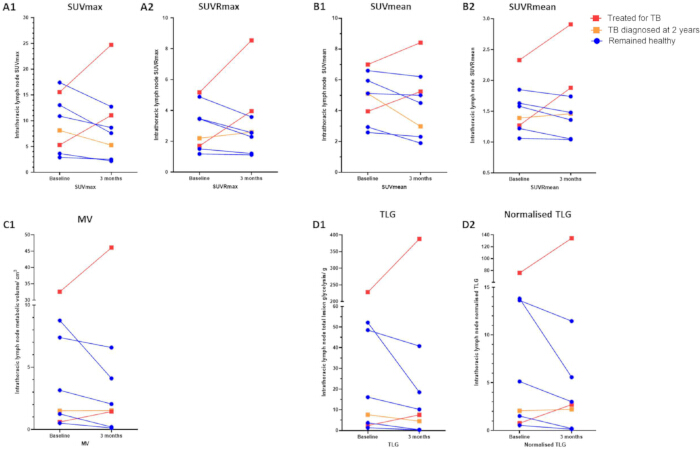
Figure 1: Metabolic activity of intrathoracic lymph nodes at baseline and 3 months, stratified based on clinical outcome. (A-D) PET-CT was performed at baseline and at 3 months in eight untreated pulmonary TB contacts. SUVRmax (A2), SUVRmean (B2), and normalized TLG (D2) were calculated by dividing SUVmax (A1), SUVmean (B1), and TLG (D1) by the reference physiological uptake, defined by Liver SUVmean + 3 standard deviations. MV (C1) is the intrathoracic lymph node metabolic volume. Red lines represent contacts who received anti-tuberculosis (ATT) at 3 months, and the orange line represents a contact who developed TB at 2 years, and the blue lines represent the contacts who remained healthy. SUVmax: maximum standardized uptake value. SUVRmax: SUV ratio maximum (SUVmax normalized to liver uptake), SUVmean: mean standardized uptake value, SUVRmean: SUV ratio mean, MV: metabolic volume, TLG: total lesion glycolysis. This figure has been adapted with permission from Kim et al.(2025)24. Please click here to view a larger version of this figure.
| Mean Difference (95% CI) | Lower limit of agreement (95% CI) | Upper limit of agreement (95% CI) | Relative Difference (95% CI) | Relative limit of agreement (95% CI) | Concordance correlation coefficient (95% CI) | |
| Liver SUVmean | 0.105 (0.023 to 0.187) | −0.229 (−0.372 to −0.086) | 0.439 (0.296 to 0.581) | 0.045 (0.010 to 0.081) | −0.099 to 0.190 (−0.161 to 0.252) | 0.90 (0.75–0.96) |
| Liver SUVmean+ 3 SD | 0.049 (−0.090 to 0.187) | −0.515 (−0.756 to −0.274) | 0.612 (0.371 to 0.854) | 0.016 (−0.030 to 0.062) | −0.170 to 0.202 (−0.249 to 0.281) | 0.85 (0.64–0.94) |
| SUVmax | 0.616 (0.403 to 0.828) | −0.195 (−0.566 to 0.176) | 1.426 (1.055 to 1.797) | 0.053 (0.035 to 0.071) | −0.017 to 0.123 (−0.049 to 0.155) | 0.99 (0.98–1.00) |
| SUVmean | −0.104 (−0.453 to 0.245) | −1.434 (−2.042 to −0.825) | 1.226 (0.618 to 1.835) | −0.020 (−0.088 to 0.047) | −0.278 to 0.238 (−0.396 to 0.355) | 0.91 (0.77–0.96) |
| MV (log) | 0.061 (−0.021 to 0.143) | −0.252 (−0.394 to −0.109) | 0.373 (0.230 to 0.516) | 0.039 (−0.014 to 0.093) | −0.164 to 0.242 (−0.257 to 0.335) | 0.97 (0.93–0.99) |
| TLG (log) | 0.056 (−0.014 to 0.125) | −0.210 (−0.331 to −0.088) | 0.321 (0.200 to 0.443) | 0.018 (−0.004 to 0.040) | −0.067 to 0.103 (−0.106 to 0.142) | 0.99 (0.98–1.00) |
Table 1: Agreement between clinical and research (3D Slicer) platforms. Bland-Altman and concordance correlation analyses were performed to assess agreement between clinical and research platforms across PET parameters. Mean difference, limits of agreement (LoA), and corresponding 95% confidence intervals (CI), relative differences, and concordance correlation coefficients (CCC) are shown. For log-transformed metrics (metabolic volume [MV] and total lesion glycolysis [TLG]), agreement was evaluated on the log scale to account for proportional bias. SUVmax: maximum standardized uptake value, SUVmean: mean standardized uptake value, SD: standard deviation.
| Mean difference (95% CI) | Lower limit of agreement (95% CI) | Upper limit of agreement (95% CI) | Relative Difference (95% CI) | Relative limit of agreement (95% CI) | Intraclass correlation coefficient (95% CI) | |
| Liver SUVmean | 0.027 (0.008 to 0.045) | −0.048 (−0.080 to −0.016) | 0.102 (0.070 to 0.134) | 0.012 (0.004 to 0.020) | −0.021 to 0.045 (−0.035 to 0.059) | 0.995 (0.986–0.998) |
| Liver SUVmean+3SDs | −0.021 (−0.085 to 0.042) | −0.279 (−0.390 to −0.169) | 0.237 (0.127 to 0.348) | −0.007 (−0.028 to 0.014) | −0.093 to 0.079 (−0.130 to 0.116) | 0.971 (0.929–0.989) |
| SUVmax | 0.071 (−0.071 to 0.212) | −0.470 (−0.717 to −0.222) | 0.611 (0.364 to 0.858) | 0.006 (−0.006 to 0.019) | −0.041 to 0.054 (−0.063 to 0.076) | 0.999 (0.997–1.000) |
| SUVmean | −0.052 (−0.161 to 0.057) | −0.467 (−0.657 to −0.277) | 0.364 (0.174 to 0.554) | −0.010 (−0.031 to 0.011) | −0.090 to 0.070 (−0.127 to 0.107) | 0.991 (0.977–0.997) |
| MV (log) | 0.023 (−0.023 to 0.069) | −0.153 (−0.234 to −0.072) | 0.199 (0.119 to 0.280) | 0.015 (−0.015 to 0.046) | −0.101 to 0.131 (−0.154 to 0.184) | 0.992 (0.979–0.997) |
| TLG (log) | 0.018 (−0.014 to 0.049) | −0.101 (−0.156 to −0.047) | 0.137 (0.082 to 0.191) | 0.006 (−0.004 to 0.016) | −0.033 to 0.044 (−0.050 to 0.062) | 0.998 (0.993–0.999) |
Table 2: Agreement between Reader 1 and Reader 2 across PET-CT parameters using the research platform (3D Slicer). Bland-Altman and interclass correlation analyses were performed to assess agreement between readers across PET parameters. Mean difference, limits of agreement (LoA) with corresponding 95% confidence intervals (CI), relative differences, and interclass correlation coefficients (ICC) are shown. For log-transformed metrics (metabolic volume [MV] and total lesion glycolysis [TLG]), agreement was evaluated on the log scale to account for proportional bias. SUVmax: maximum standardized uptake value, SUVmean: mean standardized uptake value, SD: standard deviation.
Supplementary Figure 1: Bland-Altman plots comparing automated and manual liver quantification in 3D Slicer. (A) Liver SUVmean. (B) Liver SUVmean + 3 standard deviations. The y-axis shows the difference between automated and manual measurements, and the x-axis shows the mean of the two methods. The solid red line indicates the mean difference, and the solid blue lines indicate the 95% limits of agreement (LoA). Each point represents an individual subject. Please click here to download this figure.
Supplementary Figure 2: Bland-Altman plots comparing measurements obtained using clinical (XD3) and research (3D Slicer) platforms across six PET-CT metrics. (A) Liver SUVmean, (B) Liver SUVmean + 3 standard deviations, (C) SUVmean, (D) SUVmax, (E) log-transformed metabolic volume (MV), and (F) log-transformed total lesion glycolysis (TLG). The solid red line indicates the mean difference, and the solid blue lines indicate the 95% limits of agreement (LoA). Each point represents an individual subject. Please click here to download this figure.
Supplementary Figure 3: Bland-Altman plots comparing measurements between Reader 1 and Reader 2. (A) Liver SUVmean, (B) Liver SUVmean + 3 standard deviations, (C) SUVmax, (D) SUVmean, (E) log-transformed metabolic volume (MV), and (F) log-transformed total lesion glycolysis (TLG). The solid red line indicates the mean difference, and the solid blue lines indicate the 95% limits of agreement (LoA). Each point represents an individual subject. Please click here to download this figure.
Supplementary Figure 4: CONSORT diagram showing the flow of participants. Participants had a clinical assessment, an interferon gamma release assay (IGRA) testing, and a chest X-ray at enrolment to rule out active tuberculosis (TB). Participants with a positive PET-CT scan were offered further investigation with bronchoscopy with bronchoalveolar lavage (BAL) and/or endobronchial ultrasound-guided transbronchial needle aspiration (EBUS-TBNA). Untreated participants were followed up at 3-monthly intervals with a symptom questionnaire and chest X-ray for 12 months, followed by a 12-month passive follow-up. ATT: antituberculosis therapy, Mtb: mycobacterium tuberculosis, PET-CT: positron emission tomography-computed tomography. Please click here to download this figure.
Supplementary Table 1: Agreement between automated and manual liver quantification methods in 3D Slicer. Bland-Altman and interclass correlation analyses comparing automated and manual liver quantification for SUVmean and SUVmean + 3 standard deviations (SD). Values are presented as mean difference, limits of agreement, and interclass correlation coefficient (ICC), each with 95% confidence intervals (CI). Relative difference and relative limits of agreement were calculated to assess proportional bias between methods. Please click here to download this table.
Supplementary Table 2: Quantitative PET-CT measurements in eleven participants, including eight with serial PET-CT scans. All scans were performed prior to the initiation of anti-tuberculosis therapy (ATT). PET 1 was conducted at baseline, and PET 2 was conducted at 3 months. Please click here to download this table.
Supplementary File 1: Statistical methods. Please click here to download this file.
Discussion
We evaluated semi-automated PET quantification in pulmonary TB contacts using a research imaging platform and observed substantial agreement with clinical software across PET parameters (SUVmax, SUVmean, MV, and TLG), and moderate agreement in Liver SUVmean + 3 SD threshold. We showed excellent inter-operator agreement in all PET parameters between two independent and blinded readers with a semi-automated approach. Importantly, this was achieved with one reader being a non-radiologist physician, indicating that automation with 3D Slicer can facilitate reliable PET-CT analysis across readers with varying levels of clinical and research experience.
Normalizing PET parameters to a liver threshold appeared to increase the sensitivity of the analysis and revealed an increase in metabolic activity between baseline and 3 months that was otherwise obscured by lower levels of physiological uptake during the second scan. FDG uptake can be influenced by various biological and technical factors, including patient stress, physical activity, blood glucose level, and the interval between FDG injection and scanning25. Longitudinal changes on PET-CT in TB contacts are likely less pronounced than those observed during treatment of active TB. Therefore, standardization using reference tissue and strict adherence to the imaging protocol are essential to improve repeatability and reliability of imaging analyses in TB infection studies26. In this context, semi-automated methods and normalization to a reference organ offer additional value by reducing operator-dependent variability and improving the consistency of quantitative assessments across time points. Consistency in the measurement of physiological reference is particularly important, as inaccurate measurement of reference activity will lead to unreliable quantification. We have used the liver as a reference organ because it provides stable, reproducible, and easily measurable uptake27. Liver SUVmean plus three standard deviations was used to balance biological reference with operational feasibility, as very low reference values limit quantification by non-specialist readers due to inadvertent inclusion of adjacent tissues. This approach is intended to promote a practical, reproducible, and accessible methodology for quantifying diffuse intrathoracic changes in TB infection for research purposes, and is not validated for clinical use.
We recommend automated liver quantification as the preferred approach for analyzing research scans, as it demonstrates high repeatability and requires minimal user interaction. In a small number of cases, however, the automated algorithm may either fail to detect the liver or inadvertently include adjacent structures. It is important to visually confirm that the automated ROI does not extend beyond the liver to ensure accurate quantification. In such cases, a manual measurement is recommended.
A small but consistent SUVmax bias was observed between the clinical and research platforms. Minor differences in SUV measurements between software platforms are well recognised and typically arise from software-specific differences in how DICOM information is interpreted and how voxel data are represented internally28. These differences can subtly influence voxel-level values, particularly for SUVmax. This underscores the importance of maintaining platform consistency in quantitative PET-CT research to minimise measurement variability. Within this context, open-source platforms can support methodological standardization and reduce variability across studies.
An important unknown in the interpretation of PET-CT scans in TB infection is defining clinically meaningful metabolic activity and thresholds for meaningful change over time. In our study, all PET parameters decreased at three months among individuals who remained healthy. However, baseline quantitative values overlapped between those who remained healthy and those who received treatment. This suggests that the trend over time may be more important than measurement at a single time point. Future studies should evaluate multiple quantitative measures of PET-CT metabolic activity over time and correlate these with pre-defined clinical measures to determine the optimal parameters and establish reference thresholds that facilitate standardized interpretation.
We focused on the quantification of intrathoracic lymph nodes due to a limited number of lung parenchymal abnormalities. Findings from this study showed that early TB infection is predominantly confined to intrathoracic lymph nodes, which is consistent with a study conducted in the USA6. In our cohort, only four participants demonstrated lung parenchymal FDG uptake at baseline, with low metabolic activity (mean SUVmax = 2.7), and the lesions were too small for reliable volumetric analysis and characterization. In addition, only one out of eight IGRA-positive participants who underwent serial scans showed lung parenchymal FDG uptake at baseline. In contrast, a study conducted in a high TB burden setting (South Africa) reported lung parenchymal abnormalities in approximately half of the household TB contacts, while FDG-avid intrathoracic lymph nodes were observed in 21.2%, and 9.3% of those with normal lungs5. The reason for the difference observed in PET-CT features between our cohort (low TB burden) and the cohort from the high TB burden area is unclear. One possibility is the high prevalence of past TB infection in the South African cohort, evidenced by a high proportion of IGRA positivity (82%). A non-human primate (NHP) study comparing Mtb reinfection and infection in Mtb-naïve NHPs showed that primary infection provides protection against reinfection, including the prevention of dissemination to intrathoracic lymph nodes29. Other potential contributing factors include differences in Mtb strains, host genetic factors, prevalence of smoking in study cohorts, and environmental factors. Future TB infection studies employing PET-CT should consider Mtb and cohort characteristics and develop approaches to integrate changes in lung parenchyma and intrathoracic lymph nodes.
In summary, semi-automated PET quantification can offer a valuable approach for assessing metabolic changes in TB infection with high inter-operator reliability. Normalization to reference tissues enhances analytical sensitivity in detecting early metabolic progression. Increasing metabolic activity in early infection, when corrected to a reference organ, is a promising indicator of progressive TB infection.
Disclosures
All authors report no potential conflicts to declare.
Acknowledgements
This is a summary of independent research funded by the University of Leicester MRC Confidence in Concept award to P.H. and carried out at the National Institute for Health and Care Research (NIHR) Leicester Biomedical Research Centre (BRC). The views expressed are those of the author(s) and not necessarily those of the funders, NHS, the NIHR, or the Department of Health and Social Care. This study was funded by an MRC Confidence in Concept award. JWK was funded by a Wellcome Investigator Award to Anne O'Garra (WT 215628/Z/19/Z).
Materials
| Name | Company | Catalog Number | Comments |
|---|---|---|---|
| Q.Clear | GE Healthcare | N/A | Reconstruction algorithm for PET https://www.gehealthcare.com/en-sg/products/molecular-imaging/qclear?srsltid=AfmBOooqtkcQJronALLan2Q rxYYpTTq5qw9PRf0pDJS HpTUHQk4bUarl |
| XD3 | Mirada Medical | N/A | Medical imaging software https://www.mirada-medical.com/diagnostic-imaging |
| 3D Slicer | N/A | N/A | Open-source non-commercial imaging software platform https://www.slicer.org/ |
References
- Global tuberculosis report 2025. , World Health Organization. Geneva, Switzerland. (2025).
- Jasmer, R. M., Nahid, P., Hopewell, P. C. Latent tuberculosis infection. N Engl J Med. 347 (23), 1860-1866 (2002).
- Houben, R. M. G. J., Dodd, P. J. The global burden of latent tuberculosis infection: a re-estimation using mathematical modelling. PLoS Med. 13 (10), e1002152(2016).
- Dye, C., Glaziou, P., Floyd, K., Raviglione, M. Prospects for tuberculosis elimination. Annu Rev Public Health. 34, 271-286 (2013).
- Esmail, H., et al. High resolution imaging and five-year tuberculosis contact outcomes. medRxiv. , (2023).
- Ghesani, N., Patrawalla, A., Lardizabal, A., Salgame, P., Fennelly, K. P. Increased cellular activity in thoracic lymph nodes in early human latent tuberculosis infection. Am J Respir Crit Care Med. 189 (6), 748-750 (2014).
- White, A. G., et al. Analysis of 18FDG PET/CT imaging as a tool for studying Mycobacterium tuberculosis infection and treatment in non-human primates. J Vis Exp. (127), e56375(2017).
- Cross, G. B., Doherty, J. O., Chang, C. C., Kelleher, A. D., Paton, N. I. Does PET-CT have a role in the evaluation of tuberculosis treatment in phase 2 clinical trials. J Infect Dis. 229 (4), 1229-1238 (2024).
- Kim, J. W., et al. A structural and metabolic framework for classifying pre-clinical tuberculosis infection phenotypes using 18F-FDG PET-CT: a prospective cohort analysis following M. tuberculosis exposure. Thorax. 79 (12), 1156(2024).
- Kim, J. W., Munavvar, R., Kamil, A., Haldar, P. PET-CT for characterising TB infection (TBI) in immunocompetent subjects: a systematic review. J Med Microbiol. 72 (9), (2023).
- Wahl, R. L., Jacene, H., Kasamon, Y., Lodge, M. A. From RECIST to PERCIST:evolving considerations for PET response criteria in solid tumors. J Nucl Med. 50 Suppl 1 (Suppl 1), 122s-150s (2009).
- Fencl, P., Belohlavek, O., Harustiak, T., Zemanova, M. The analysis of factors affecting the threshold on repeated 18F-FDG-PET/CT investigations measured by the PERCIST protocol in patients with esophageal carcinoma. Nucl Med Commun. 33 (11), 1188-1194 (2012).
- Hirata, K., et al. A semi-automated technique determining the liver standardized uptake value reference for tumor delineation in FDG PET-CT. PLoS One. 9 (8), e105682(2014).
- Hatt, M., et al. Reproducibility of 18F-FDG and 3'-deoxy-3'-18F-fluorothymidine PET tumor volume measurements. J Nucl Med. 51 (9), 1368-1376 (2010).
- Keijzer, K., et al. Semi-automated (18)F-FDG PET segmentation methods for tumor volume determination in non-Hodgkin lymphoma patients: a literature review, implementation and multi-threshold evaluation. Comput Struct Biotechnol J. 21, 1102-1114 (2023).
- Boellaard, R., Krak, N. C., Hoekstra, O. S., Lammertsma, A. A. Effects of noise, image resolution, and ROI definition on the accuracy of standard uptake values: a simulation study. J Nucl Med. 45 (9), 1519(2004).
- Ziai, P., et al. Role of optimal quantification of FDG PET imaging in the clinical practice of radiology. RadioGraphics. 36 (2), 481-496 (2016).
- Malherbe, S. T., et al. Quantitative 18F-FDG PET-CT scan characteristics correlate with tuberculosis treatment response. EJNMMI Res. 10 (1), 8(2020).
- Cross, G. B., et al. PET-CT outcomes from a randomised controlled trial of rosuvastatin as an adjunct to standard tuberculosis treatment. Nat Commun. 15 (1), 10475(2024).
- 3D Slicer. Pieper, S., Halle, M., Slicer Kikinis, R. 3D. 2004 2nd IEEE International Symposium on Biomedical Imaging: Nano to Macro (IEEE Cat No. 04EX821), Arlington, VA, USA, 1, 632-635 (2004).
- Kim, J. W., et al. PET-CT-guided characterisation of progressive, preclinical tuberculosis infection and its association with low-level circulating Mycobacterium tuberculosis DNA in household contacts in Leicester, UK: a prospective cohort study. Lancet Microbe. 5 (2), e119-e130 (2024).
- The Ionising Radiations Regulations 2017. , Great Britain. https://www.legislation.gov.uk/uksi/2017/1075/contents (2017).
- ARSAC Notes for Guidance: Good Clinical Practice in Nuclear Medicine. , Administration of Radioactive Substances Advisory Committee. https://www.gov.uk/government/publications/arsac-notes-for-guidance (2014).
- Kim, J., Kamil, A., Lee, J., Novsarka, I., Haldar, P. M34 Semi-automated quantification of PET-CT in TB contacts and its association with prospective outcomes. Thorax. 80 (Suppl 2), A358-A359 (2025).
- Paquet, N., Albert, A., Foidart, J., Hustinx, R. Within-patient variability of 18F-FDG: standardized uptake values in normal tissues. J Nucl Med. 45 (5), 784-788 (2004).
- Lodge, M. A. Repeatability of SUV in oncologic (18)F-FDG PET. J Nucl Med. 58 (4), 523-532 (2017).
- Zwezerijnen, G. J. C., et al. Reproducibility of [18F]FDG PET/CT liver SUV as reference or normalisation factor. Eur J Nucl Med Mol Imaging. 50 (2), 486-493 (2023).
- Wilson, C. M., Selwyn, R. G., Elojeimy, S. Comparison of PET/CT SUV metrics across different clinical software platforms. Clin Imaging. 89, 104-108 (2022).
- Cadena, A. M., et al. Concurrent infection with Mycobacterium tuberculosis confers robust protection against secondary infection in macaques. PLoS Pathog. 14 (10), e1007305(2018).
Reprints and Permissions
This article has been published
Video Coming Soon