This protocol details a quantitative defecation assay in young RAC1/CED-10 mutant Caenorhabditis elegans, providing a straightforward model to study prodromal Parkinson's disease stages. It overcomes limitations of other animal models and facilitates testing of therapeutic strategies targeting early Parkinsonian pathology.
Method Article
Assessing Gastrointestinal Motility in Caenorhabditis elegans RAC1/CED-10 Mutants as a Tool to Study Early Parkinson's Disease
In This Article
Summary
Abstract
Parkinson's disease (PD) is among the most prevalent neurodegenerative disorders and is diagnosed based on motor symptoms that emerge after significant dopaminergic neuron loss. Non-motor symptoms, such as constipation, are the most common and often appear earlier, indicating the onset of the disease. Many animal models are used to study neurodegenerative diseases, yet most focus on the later stages. Because it is difficult to determine the exact start of neurodegeneration, no single model fully represents the entire disease progression. Mammalian models are especially time-consuming and expensive due to their long-life cycles. In contrast, Caenorhabditis elegans (C. elegans), a transparent 1 mm nematode with a short life and reproductive cycle (~3 weeks and 3 days), enables faster, cost-effective experiments thanks to its rapid generation turnover. The defecation motor program in C. elegans consists of rhythmic cycles regulated by a complex genetic network in which Rho/rac GTPases participate, and RAC1 (CED-10 in C. elegans) is among them. We have shown that RAC1/CED-10 mutants exhibit compromised GABAergic morphology and function, which results in disrupted defecation cycles. Here, we present the experimental protocol for measuring constipation in RAC1/CED-10 C. elegans at early stages. In addition to serving as a predictive tool to investigate early PD symptoms prior to neurodegeneration, this protocol could also be employed as an early endpoint to assess the efficacy of pharmacological intervention. Because these changes are not disease-specific, we believe this model provides a valuable tool for investigating alterations that arise early in other illnesses.
Introduction
Parkinson's disease (PD) is the second most common neurodegenerative disorder and a leading cause of neurological disability1,2. Its pathological hallmarks include Lewy bodies and Lewy neurites, primarily composed of α-synuclein, along with neuronal loss in the substantia nigra and other brain regions3.
Clinically, PD is classified as a movement disorder but is also characterized by a broad spectrum of non-motor symptoms. Motor impairments arise from dopaminergic neuron degeneration in the substantia nigra and striatal dopamine depletion. However, non-motor symptoms-such as constipation, anxiety, and REM sleep behavior disorder4-often emerge years earlier, during the prodromal phase, when neurodegeneration affects extranigral structures (e.g., brainstem, olfactory system, and autonomic pathways)5.
A major challenge in PD research is the delayed clinical onset: motor symptoms typically appear only after 60%-80% of dopaminergic neurons are lost3, by which point therapeutic intervention is less effective. Early non-motor symptoms (e.g., autonomic dysfunction) could serve as biomarkers for prodromal PD6, but their non-specificity complicates definitive diagnosis. Given these limitations, animal models are essential for studying early PD stages, standardizing symptom characterization, and developing neuroprotective therapies-currently lacking-that could slow or prevent neurodegeneration.
RAC1/CED-10 C. elegans mutants recapitulate key early and late-stage PD features6. We previously demonstrated that RAC1 activity is critical for dopaminergic neuron survival and function, protecting against α-synuclein-induced toxicity7. Further, RAC1/CED-10 mutants exhibit phenotypic alterations resembling early PD, including lipid metabolism dysregulation and GABAergic dysfunction, the latter reflected in disrupted defecation cycles6. These findings establish RAC1/CED-10 mutants as a tractable model for studying pre-degenerative PD pathophysiology.
Here, we describe an optimized defecation assay for RAC1/CED-10 mutants, which quantitatively captures intestinal dysmotility, enabling systematic study of gastrointestinal features during PD's prodromal phase.
Protocol
NOTE: Wild type: N2 Bristol was used. Model of early PD RAC1/CED-10: The strain BR3579 is genotyped ced-10(n3246) and is named RAC1/CED-10 here. It was a generous gift from Dr. Ralf Baumeister (Albert-Ludwig University, Freiburg/Breisgau, Germany). This variant of ced-10(n3246) is a strong allele. The mutation ced-10(n3246) is a G-to-A transition resulting in a change of glycine 60 of CED-10 to arginine (G60R), which results in non-null altered function8,9. The severity of this allele is stronger in contrast to other ced-10 alleles10. Hermaphrodites were used throughout the study.
1. Worm maintenance
- Pour 25 mL of nematode growth medium (NGM) into 150 mm Petri dishes and allow the agar to solidify. Seed each plate with 500 µL of an Escherichia coli OP50 culture, spreading the suspension evenly across the agar surface. Incubate plates at 30 °C overnight to allow bacterial growth. Prepare plates 24 h prior to use.
2. Obtaining worms synchronized at the 4 th stage of larval development (L4)
- Perform measurements of the intestinal motility with worms synchronized at the L4 larval stage of development. To obtain worms at this stage of development, follow the bleaching protocol described below (adapted from 11) with slight modifications related to the RAC1/CED-10 phenotype11.
- Add 10 gravid adults to the NGM plates with Escherichia coli OP50, prepared as in step 1, to lay eggs and allow the worms to grow for 3 days. Alternatively, transfer a chunk of agar from an NGM plate containing a mixed population to a new NGM plate. In this case, the life cycle control is not as precise as when using 10 gravid adults. After 80 h, a mixed population of C elegans hermaphrodites with gravid adults was observed in the case of wild types. RAC1/CED-10 mutants showed 6 h of delayed development6, so gravid adults appeared at 86 h.
NOTE: Gravid adults are identified because they have eggs inside. - Wash plates with 10 mL of M9 to recover gravid adults in 15 mL tubes (labeled with the corresponding genotype).
- Pellet the worms by centrifuging for 2 min at 2000 x g (~1500 rpm on a standard table centrifuge) at room temperature, discard the supernatant, and add 10 mL of fresh M9 buffer.
NOTE: Although it works at room temperature, we observed better results by centrifuging at 10 °C. - Perform step 2.4 3x or until the buffer appears clear of bacteria (transparent supernatant). The presence of bacteria can be inferred from the fact that the supernatant appears slightly yellowish and turbid.
- Add M9 buffer to a total volume of 3.5 mL.
NOTE: In our experience, sterile distilled water - or even tap water - can be used at this step without introducing contamination, as the subsequent bleaching process eliminates any microbes. However, we recommend M9 buffer or sterile water to ensure reproducibility across laboratories. - Mix 0.5 mL of 5M NaOH with 1 mL of bleach to prepare the bleaching solution. Make this solution fresh just before use. Add 1.5 mL of the mix to the centrifuge tube containing worms.
- Agitate the tubes vigorously during bleaching while monitoring the destruction of adult tissue under a dissecting microscope. Stop the reaction as soon as only traces of adults are still visible.
NOTE: The bleaching treatment lyses adult worms and larvae, while embryos remain viable because their eggshell protects them from bleach. This step is critical to get survivors. An excess of time can kill all the worms. Using a vortex is strongly recommended, but then, check the destruction of the cuticle every 3 min. RAC1/CED-10 mutants are more sensitive to bleach. Monitor the disintegration of the adult tissue every 2 min and never exceed 8 min. - Stop reaction by adding M9 buffer to fill the tube (~15 mL). Quickly centrifuge (since treatment may still be active) for 1 min at 2,000 x g and discard supernatant.
- Wash the pellet 3x by filling the tube with M9 buffer and centrifuging as described above. After the final wash, carefully remove the supernatant until approximately 0.1 mL remains.
- Add these eggs to a new 15 mL tube and add M9 to 5 mL. Incubate at room temperature with gentle rotation. Proper aeration should be provided.
NOTE: We obtained good synchronization results using tap water instead of M9 in all steps except step 2.9. - After 24 h, stop the rotation, and pellet the worms by centrifuging at 2,000 x g for 1 min at 10 °C.
- Plate 30-50 µL of pelleted worms of the corresponding genotypes in 150 cm NGM plates seeded with OP50 and labeled with the corresponding genotype. Several RAC1/CED-10 worms appeared dead, as an intrinsic property of the RAC1/CED-10 genotype (personal observation). Accordingly, plate double volume of these mutants and monitor them the next day.
NOTE: The volume of plated worms depends on the yield of the bleaching protocol. Never exceed the number of 250 worms per plate, as food will run out faster, and worms could enter starvation. The difference in developing time could be used wisely to have time to record the first defecation cycles of wild-type and then RAC1/CED-10 worms (see next section). - Check for wild-type worms at L4 stage of larval development after 34 h of incubation. The same developmental stage for RAC1/CED-10 worms will be achieved in 40 h6. Distinguish L4 worms from L3 and young adults by measuring their size (~650 µm) and checking their moon-like vulva structure12.
3. Recording intestinal motility
- Wash the plates with 3 mL of M9 to recover L4 worms into two 1.5 mL centrifuge tubes.
- Centrifuge at 2,000 x g for 1 min (Figure 1A), discard supernatant and add 1 mL of fresh M9 buffer. Repeat step 3x.
- Plate these washed worms in an NGM plate without OP50 (Figure 1B). With these washing and final plating steps, eliminate excess bacteria.
- Transfer worms individually to 12-well plates with seeded 5 µL of OP50 bacteria (Figure 1C). Allow worms to adapt for 1 h at 20 °C.
NOTE: These plates were seeded and allowed to dry before worms were added. It is better not to prepare these plates in advance because overgrowth of bacteria can make the visualization of the defecation cycle difficult. - Place the 12-well plates with worms under the microscope, localize one worm, and start recording. Record defecation cycles for 15 min (15 cycles; Figure 1D). Use a 5x objective for imaging with a camera that offers a 12-bit resolution and a 60 frames per second (fps) frame rate. Perform video acquisition using the Snipping Tool in Windows. Start the recording when you detect the first defecation cycle.
NOTE: If the microscope is connected to a computer, you can record the screen directly with the Snipping Tool. We strongly recommend having a computer chronometer for defecation cycle monitoring. Click the Laps button every time at the end of the defecation cycle.
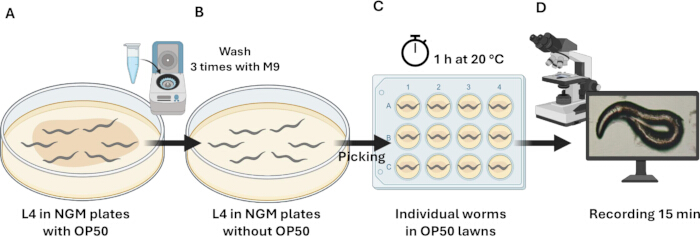
Figure 1: Schematic diagram of the experimental protocol for measuring intestinal motility. (A) Synchronized worms at the L4 stage of development. These worms were collected and washed 3x with M9. (B) Washed worms were plated in NGM plates without OP50. (C) Worms were picked individually in a 12-well plate with OP50 and let them crawl for 1 h at 20 ˚C. During this time, the worms adapt to the new media and relax from the stress of transferring. (D) Individual worms were recorded for 15 min to analyze intestinal motility. Please click here to view a larger version of this figure.
4. Analysis of the defecation cycle
NOTE: In C. elegans, the defecation motor program comprises rhythmic cycles orchestrated by a complex genetic network. This program consists of three sequential, distinct muscle contractions, each readily detectable under a dissection microscope. The first step involves the contraction of the posterior body-wall muscles (pBoc), which is followed by the contraction of the anterior body-wall muscles (aBoc), and finally, by the enteric muscle contractions (EMC), which result in the expulsion of the gut contents (Exp)13 (Figure 2).
- Perform experiments at 20 ˚C. Once all videos are recorded, start data analysis.
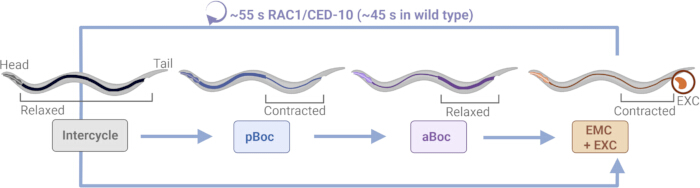
Figure 2: Defecation cycle in C. elegans RAC1/CED-10 mutants. A diagrammatic representation of the C. elegans defecation cycle in RAC1/CED-10 mutant nematodes. pBoc denotes the contraction of the posterior body wall musculature; aBoc denotes the contraction of the anterior body wall musculature, and EMC + EXC corresponds to the ejection of gut contents. In wild type undisturbed feeding animals, this motor program is initiated every 45 s with very high regularity18. Worms are oriented with the head facing to the left and the tail to the right. Excretion (EXC) is highlighted in orange. This figure has been modified from6. Please click here to view a larger version of this figure.
5. Video analysis
- Open one video with a video player program.
NOTE: We used Windows Media Player Legacy v12. Other video player programs can be used. - Prepare the spreadsheet file. Open the Template file provided (Supplementary Table 1). Enter the video file name and worm size (optional) in the designated fields, then start the video playback.
- Define and record the first excretion. Define time zero as the moment recording begins when worms are placed under the microscope. Observe the anus region of the worm and identify the first excretion event. Record the time (in s) for this event in the cell labeled First Excretion of the spreadsheet.
NOTE: The first excretion time will vary between worms (e.g., Worm 1 = 5 s, Worm 2 = 26 s, Worm 3 = 34 s) because the timing of the last excretion before recording is unknown. - Record subsequent excretion events: Continue playback and document each subsequent excretion sequentially (Excretion 2, Excretion 3, etc.) until a total of 16 excretions have been introduced.
- Calculate cycle intervals: The template automatically determines the interval between consecutive excretions (e.g., Excretion 2 - Excretion 1; Excretion 3 - Excretion 2; ...). Use these intervals as the cycle length.
- Determine total cycle time: Once the 16 events have been recorded, the template calculates the time required for the worm to complete 15 cycles. This value is displayed in the cell labeled Total Time of the spreadsheet. Repeat this process for each worm.
NOTE: Currently, no automated software reliably detects defecation cycles in C. elegans. Although platforms such as WMicrotracker are effective for quantifying movement parameters (speed, distance traveled, worm number, or body size14,15), they do not provide the resolution needed to monitor the anus region and identify contraction or excretion events. Therefore, manual scoring remains necessary, similar to the limitation observed in assays of pharyngeal pumping16.
6. Cycle length measurements
- Score cycle length as the time between two consecutive excretions. Calculate by subtracting the end time of one cycle from the end time of the next cycle, as explained in Table 1 and Equation 1.
Cycle length (n) (in seconds) = Time Excretion (n+1) - Time excretion (n) Equation 1
Cycle length (1st) = 66 s ((time excretion 2 = 71 s) - (time excretion 1 = 5 s)) - For each data set, calculate the mean period of the defecation cycle, standard deviation (SD), and standard error of the mean (SEM) using a statistical analysis software.
7. Rhythmicity or regularity of the defecation cycle
- The coefficient of variation (CV) is used to describe the relative variability and explains how the data is spread out compared to the mean. It has been used previously as an indicator of the regularity of the defecation cycle in C. elegans6. Calculate the CV for every worm by applying Equation 2.
 Equation 2
 - For each C. elegans strain, calculate the mean CV, standard deviation (SD), and standard error of the mean (SEM) using a statistical analysis software.
8. Statistical analysis
- Conduct experiments in three independent replicates, with five worms analyzed per condition. Evaluate data normality using the Shapiro-Wilk test (α=0.05), which is recommended for n < 50.
- Since cycle length measurements did not follow a normal distribution, analysis was performed with the non-parametric Mann-Whitney test, which is well-suited for detecting differences in medians with small sample sizes. Conversely, CV (%) data are normally distributed; analyze them using an unpaired t-test with Welch's correction to account for unequal variances.
- Perform all statistical analyses using statistical analysis software. For experiments including more than two strains, apply an alternative test, such as one-way ANOVA, with continuous verification of sample distribution.
Results
The described video-based assay was implemented in the C. elegans RAC1/CED-10 model of early PD to quantitatively assess intestinal motility. Given the developmental delay of RAC1/CED-10 mutants, synchronized populations were adjusted to ensure stage-matched comparisons with wild-type controls. Individual worms were recorded at the L4 stage, and 15 consecutive defecation cycles were analyzed to determine cycle length and regularity. This approach enables accurate, high-resolution measurement of intestinal motor function and allows detection of subtle non-motor alterations associated with early PD phenotypes in C. elegans.
Developmental delay in RAC1/CED-10 animals for synchronized experiments
Given the developmental delay observed in the C. elegans RAC1/CED-10 mutant6, synchronization experiments performed in parallel with wild-type animals require temporal adjustment. To account for this delay and ensure stage-matched comparisons during video recording, RAC1/CED-10 animals were plated 6 h earlier than wild-type controls on the same day.
RAC1/CED-10 worms to investigate defecation alterations associated with Parkinson's disease
Constipation can be detected as early as two decades before the diagnosis of motor-PD, making it one of the initial recognizable signs indicating the onset of the disease17. We have previously shown that the RAC1/CED-10 model exhibits non-motor alterations at the L4 developmental stage, before the onset of neurodegeneration6, and altered intestinal motility is one of these. As described in the Protocol, individual worms were recorded at the L4 stage. Figure 3 shows a representative RAC1/CED-10 worm.
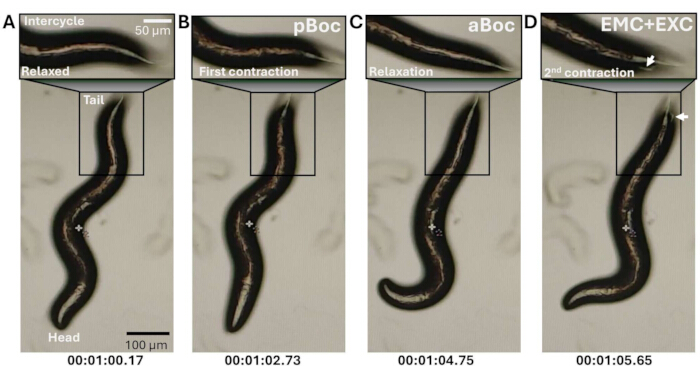
Figure 3: C. elegans defecation cycle in images for RAC1/CED-10 mutant animals. Defecation Cycle in RAC1/CED-10 Mutants in images. Worms are oriented head-down. Tail regions, highlighted in horizontal boxes, show the sequence of defecation motor steps as described in6 and schematized in Figure 2: (A) relaxed anterior tract, (B) posterior body contraction (pBoc), (C) anterior body contraction (aBoc), and (D) enteric muscle contraction with expulsion (EMC+EXC). Cycle duration is indicated below. Arrows mark expelled material. Please click here to view a larger version of this figure.
The two parameters used for analyzing intestinal motility are cycle length and cycle regularity13. First, we measured 15 cycles of each worm, represented in Figure 4.
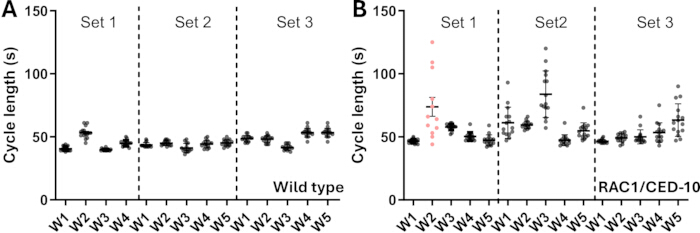
Figure 4: Cycle duration of wild types (A) and RAC1/CED-10 individuals (B). Set 1,2, and 3 indicates independent replicates. Each dot represents one defecation cycle, and there are 15 cycles per worm. Pink W2 in B was discarded for further analysis because it did not complete 15 cycles. W = worm. Statistical analysis was not performed in this figure. Please click here to view a larger version of this figure.
Individual worms were designated with W (W1, W2, etc.) across the different experimental replicates (Set = 1, 2, 3). For each worm (W), 15 measurements were taken over 15 min. In the first set of experiments of wild-type animals (Figure 4A, Set 1), one worm was excluded because it was a young adult instead of an L4. In the case of RAC1/CED-10, one worm was discarded because, after processing the data, it did not complete 15 cycles within 15 min. Because of that, we recommend using the clock application to know how many cycles have been completed, as RAC1/CED-10 worms were quite irregular.
Based on these individual values, the mean and standard deviation of cycle length for wild-type worms and RAC1/CED-10 mutants were calculated (Table 1 and Figure 5). As previously published6, RAC1/CED-10 worms exhibit longer and less regular cycles than wild-type worms. Wild-type worms show shorter cycles (46 s ± 5 s) than RAC1/CED-10 mutants (55 s ± 12 s).
Table 1: Representative dataset of excretion cycle measurements for individual worms. The table summarizes representative data collected from three animals. For each worm, the dataset includes the video file identifier, body size (µm), time points (in s) corresponding to individual excretion events, the calculated cycle lengths across 15 consecutive cycles, and the total recording duration. Cycle length was obtained by subtracting consecutive excretion time points (e.g., for worm VID_154028, the first cycle length was 66 s, calculated as 71-5 s). The remaining entries illustrate similar measurements for two additional worms, providing examples of typical variability within the dataset. Please click here to download this table.
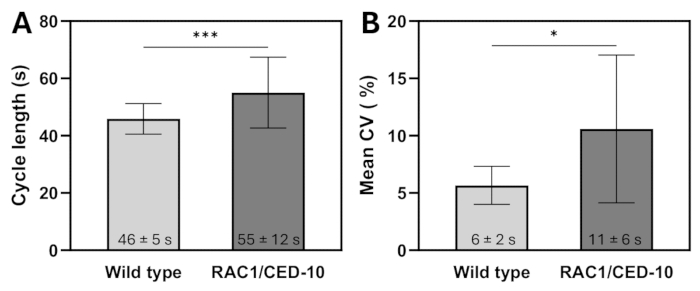
Figure 5: Defecation cycle parameters. (A) Defecation cycle length and (B) Mean CV of wild type and RAC1/CED-10 worms. Data represent the mean ± SD. N=3 n=5. Non-parametric Mann-Whitney test was applied for defecation cycle length. Unpaired t-test with Welch's correction was applied for Mean CV data. *** p < 0.001 * p < 0.05. See step 8 for statistical analysis information. Please click here to view a larger version of this figure.
Cycle regularity is calculated using the mean coefficient of variation (CV), which is the mean of the coefficients of variation for each worm in the experiment18. Figure 5B shows more variability in RAC1/CED-10 mutant animals compared with wild-type animals. Mean CV is 6% ± 2% in wild types, compared with 11% ± 6 % in RAC1/CED-10 mutants.
Supplementary Table 1:Template for the calculation of defecation cycle length in Caenorhabditis elegans. Users should enter the name of each worm file in the first column and may optionally record the worm's body length. The time (in s) corresponding to each excretion event (Excretion 1-16) is then entered sequentially as determined from video playback. The template automatically calculates the interval between consecutive excretions (Time excretion N - Time excretion N-1), representing the defecation cycle length. Once 16 excretion events have been entered, the total time required to complete fifteen full cycles is automatically computed and displayed in the Total Time (mm:ss) cell. Please click here to download this file.
Discussion
C. elegans as a powerful model for studying prodromal PD
While most neurodegenerative disease models focus on late-stage pathology19, studying early disease onset remains technically challenging. Traditional mammalian models, like mice, rats or primates, are constrained by long life cycles and high costs. The microscopic nematode C. elegans overcomes these limitations with its 3-week lifespan, 3-day reproductive cycle, and genetic tractability - making it an ideal system for efficient, large-scale studies of neurodegeneration6.
The C. elegans RAC1/CED-10 mutant provides three key advantages for studying early PD pathogenesis. First, its precise temporal resolution allows neurodegenerative events to be tracked across well-defined developmental stages6. Second, the model offers exceptional experimental versatility through genetic tractability, low maintenance requirements, and high-throughput compatibility6,7. Third, because C. elegans lacks an endogenous α-synuclein homolog, including in the RAC-1/CED-10 model, it provides a valuable advantage. Researchers can examine pre-clinical PD mechanisms without α-synuclein interference, which marks more advanced stages6 . This positions the model as an excellent tool for studying initial pathogenic events and for later integration of α-synuclein expression to investigate advanced pathogenesis. Finally, the evolutionary conservation of CED-10's homology with human RAC1 ensures direct translational relevance10,20.
The C. elegans model described here is well-suited for pharmacological assays17,21. Because RAC-1/CED-10 mutants exhibit developmental delay, blinding is not possible at the initial step, as their identity cannot be concealed relative to the wild type. For pharmacological screenings, however, bias can be minimized by adopting a double-blind design in which the experimenter collecting the data and the person analyzing it remain unaware of all experimental variables.
Constipation affects nearly all PD patients during the prodromal phase, often preceding motor symptoms5. C. elegans offers unique advantages for studying this early gastrointestinal dysfunction. Unlike mammalian models requiring invasive interventions, the nematode's transparency and simplicity enable non-invasive, real-time observation of its highly stereotyped defecation motor program-a feature critical for quantifying gut motility defects. The short life cycle and precise rhythmicity of C. elegans defecation enable rapid and reproducible analysis of functional impairments. In RAC1/CED-10 mutants, deviations in defecation timing mirror constipation-like phenotypes observed in prodromal PD6. These findings provide a foundational framework for later validation in complex mammals (e.g., mice, primates) while directly linking RAC1 signaling to enteric dysfunction.
Beyond its mechanistic relevance, the RAC1/CED-10 model also offers translational utility. The defecation assay is simple, reproducible, and scalable, making it suitable for early-stage drug screening. Compounds that normalize cycle timing or regularity can be rapidly prioritized for testing in mammalian models, providing a cost-effective filter for therapeutic candidates. Because gastrointestinal dysfunction is common across several neurodegenerative conditions4, this assay may also be applied beyond PD, serving as both a discovery tool and a translational bridge to preclinical research.
Critical steps in the protocol
We present a refined methodology to study intestinal dysmotility in RAC1/CED-10 mutants, a key non-motor phenotype relevant to prodromal PD. While based on established defecation assays18,22, this protocol addresses unique challenges posed by RAC1/CED-10 mutants to ensure robust and reproducible results.
The key adaptations for RAC1/CED-10 mutants are as follows:
Synchronization adjustments: RAC1/CED-10 mutants exhibit reduced fecundity compared to wild-type strains (personal observation). To compensate for the lower progeny yield, apply the following adjustments during synchronization: Plate chunk method - use a larger inoculum, approximately 2x the volume used for wild-type strains, to account for increased developmental variability. Gravid adult method - Transfer 15-20 adults (versus standard 10) to ensure a sufficient number of embryos for subsequent experiments.
Bleach sensitivity: Embryos from RAC1/CED-10 mutants exhibit increased sensitivity to hypochlorite treatment. To minimize damage, reduce bleach exposure time by 20%-30% compared to wild-type protocols and verify embryo integrity microscopically after treatment.
Developmental delay considerations: RAC1/CED-10 mutants mature more slowly than wild-type worms10. To achieve proper synchronization for recordings, begin video analyses with wild-type worms to establish a temporal reference and record mutants at matched morphological stages (e.g., vulval morphology) rather than by chronological age.
Workflow rationale: Conducting initial experiments with wild-type C. elegans controls for environmental variability and provides a reference for normal defecation rhythms. Due to developmental delays in RAC1/CED-10-10 mutants, recording schedules should be adapted to prioritize stage-matched (rather than strictly age-matched) comparisons.
Strain-specific timing considerations: Developmental delays in mutants require flexible experimental scheduling, with an emphasis on matching developmental stages across genotypes instead of relying solely on chronological age.
Limitations of the nematode model
While C. elegans lacks the anatomical complexity and pathway redundancy of mammalian systems-a limitation for some translational studies-its simplicity is advantageous for examining discrete biological functions. Focusing on intestinal motility leverages this strength, as the nematode's streamlined physiology allows for the precise analysis of specific functional parameters. Although complementary mammalian studies are necessary for therapeutic validation, C. elegans offers an exceptional platform for the mechanistic investigation of conserved biological processes21,23.
Our model also lacks endogenous α-synuclein, which is beneficial for studying early, preclinical PD (Parkinson's disease), a stage when constipation may emerge as a prodromal symptom3. The defecation cycle length provides an objective, high-throughput measure, but it reflects only one aspect of gastrointestinal dysfunction and is not disease-specific.
While this assay does not capture progressive α-synuclein aggregation, complex neurodegeneration, or age-related systemic pathology seen in human PD5, we observe altered dopaminergic and GABAergic function and disrupted Rac1 signaling6, highlighting the mechanistic relevance of this model. Therefore, it remains valuable for dissecting early PD-related neuro-gastrointestinal mechanisms and conserved pathways.
Disclosures
The authors have nothing to disclose.
Acknowledgements
A.M.J. acknowledges the Ph.D. scholarship (FPU18/05190) in the framework of the Biotechnology Ph.D. at Universitat Autònoma de Barcelona. AL and AMJ acknowledge the funding PID2021-122645OB-100 and PID2024-1576370B-100 by MCIN/AEI//10.13039/501100011033/FEDER "Una manera de hacer Europa"; the "Severo Ochoa" Programme for Centres of Excellence, in R&D CEX2019-000917-S (FUNFUTURE), CEX2023-001263-S (MATRANS42), Generalitat de Catalunya 2021S00446, and European Union's Horizon Europe research and innovation program under grant agreement No 101057527 (NextGEM). EDC acknowledges support from the APR-2024 grant (PMI24006), funded by the Fundació d'Estudis Superiors en Ciències de la Salut (FESS) and the Fundació Institut de Recerca i Innovació en Ciències de la Vida i la Salut de Catalunya (IRIS-CC).
Materials
| Name | Company | Catalog Number | Comments |
|---|---|---|---|
| 12 well Culture multiwell plates, treated, sterile | Labbox | CCPP-012-100 | |
| Agar | VWR | AAA10752-0E | To prepare NGM plates |
| Bactopeptone | VWR | 90000-264 | To prepare NGM plates |
| Bleach | Any household | For the bleaching process | |
| CaCl2 | Labkem | CACH-02P-1K0 | To prepare NGM plates |
| Centrifuge Sorvall ST8 | Sorvall | 15194923 | |
| Cholesterol | Sigma-Aldrich | C8667-25G | To prepare NGM plates |
| Clock | Windows | v 11.2503.4.0 | |
| E. coli OP50 | CGC | OP50 | |
| Ethanol | Panreac | 131086.1214 | To prepare NGM plates |
| Incubator 20 °C | Ecogen | CIR180 | |
| KH2PO4 | Sigma-Aldrich | P0662 | To prepare M9 buffer |
| KPO4 | Sigma-Aldrich | P5655 + P3786 | KH2PO4 + K2HPO4; To prepare NGM plates |
| MgSO4 | Sigma-Aldrich | M7506 | To prepare NGM plates; To prepare M9 buffer |
| Microscope | Olympus | Olympus BX51 | |
| Na2HPO4 | Sigma-Aldrich | S9763 | To prepare M9 buffer |
| Na2HPO4 | Sigma Aldrich | 7558-79-4 | To prepare M9 buffer |
| NaCl | Sigma-Aldrich | S5886 | To prepare NGM plates; To prepare M9 buffer; LB |
| NaOH | Sigma-Aldrich | 567530 | For the bleaching process; LB |
| Snipping Tool in Windows | Windows | v 11.2504.42.0 | |
| Tryptone | CONDA | 1612 | LB |
| Yeast extract | CONDA | 1702 | LB |
References
- Cooper, J. F., Van Raamsdonk, J. M. Modeling Parkinson's Disease in C. elegans. J Parkinsons Dis. 8 (1), 17-32 (2018).
- Feigin, V. L., et al. Global, regional, and national burden of neurological disorders, 1990–2016: a systematic analysis for the Global Burden of Disease Study 2016. Lancet Neurol. 18 (5), 459-480 (2019).
- Gaig, C., Tolosa, E. When does Parkinson’s disease begin. Movement Disord. 24 (S2), S656-S664 (2009).
- Camerucci, E., et al. Lifelong constipation in Parkinson’s disease and other clinically defined alpha-synucleinopathies: A population-based study in Southeast Minnesota. Parkinsonism Relat Disord. 107, 105244(2023).
- Tolosa, E., Garrido, A., Scholz, S. W., Poewe, W. Challenges in the diagnosis of Parkinson’s disease. Lancet Neurol. 20 (5), 385-397 (2021).
- Muñoz-Juan, A., et al. Caenorhabditis elegans RAC1/ced-10 mutants as a new animal model to study very early stages of Parkinson’s disease. Prog Neurobiol. 234, 102572(2024).
- Kim, H., et al. The Small GTPase RAC1/CED-10 Is Essential in Maintaining Dopaminergic Neuron Function and Survival Against α-Synuclein-Induced Toxicity. Mol Neurobiol. 55 (9), 7533-7552 (2018).
- Reddien, P. W., Horvitz, H. R. CED-2/CrkII and CED-10/Rac control phagocytosis and cell migration in Caenorhabditis elegans. Nat Cell Biol. 2 (3), 131-136 (2000).
- Shakir, M. A., Gill, J. S., Lundquist, E. A. Interactions of UNC-34 Enabled With Rac GTPases and the NIK Kinase MIG-15 in Caenorhabditis elegans Axon Pathfinding and Neuronal Migration. Genetics. 172 (2), 893-913 (2006).
- Kinchen, J. M., et al. Two pathways converge at CED-10 to mediate actin rearrangement and corpse removal in C. elegans. Nature. 434 (7029), 93-99 (2005).
- Porta-de-la-Riva, M., Fontrodona, L., Villanueva, A., Cerón, J. Basic Caenorhabditis elegans Methods: Synchronization and Observation. J Vis Exp. (64), e4019(2012).
- Herman, T., Hartwieg, E., Horvitz, H. R. sqv mutants of Caenorhabditis elegans are defective in vulval epithelial invagination. Proc Natl Acad Sci. 96 (3), 968-973 (1999).
- Branicky, R., Hekimi, S. What keeps C. elegans regular: the genetics of defecation. Trends Genet. 22 (10), 571-579 (2006).
- Risi, G., et al. Caenorhabditis elegans Infrared-Based Motility Assay Identified New Hits for Nematicide Drug Development. Vet Sci. 6 (1), 29(2019).
- Taki, A. C., Byrne, J. J., Boag, P. R., Jabbar, A., Gasser, R. B. Practical High-Throughput Method to Screen Compounds for Anthelmintic Activity against Caenorhabditis elegans. Molecules. 26 (14), 4156(2021).
- Hahnel, S. R., Roberts, W. M., Heisler, I., Kulke, D., Weeks, J. C. Comparison of electrophysiological and motility assays to study anthelmintic effects in Caenorhabditis elegans. Int J Parasitol Drugs Drug Resist. 16, 174-187 (2021).
- Yu, Q. J., et al. Parkinson disease with constipation: clinical features and relevant factors. Sci Rep. 8 (1), 567(2018).
- Kwan, C. S., Vázquez-Manrique, R. P., Ly, S., Goyal, K., Baylis, H. A. TRPM channels are required for rhythmicity in the ultradian defecation rhythm of C. elegans. BMC Physiol. 8 (1), 11(2008).
- Dawson, T. M., Golde, T. E., Lagier-Tourenne, C. Animal models of neurodegenerative diseases. Nat Neurosci. 21 (10), 1370-1379 (2018).
- Cabello, J., et al. PDR-1/hParkin negatively regulates the phagocytosis of apoptotic cell corpses in Caenorhabditis elegans. Cell Death Dis. 5 (3), e1120(2014).
- Sofela, S., Sahloul, S., Song, Y. A. Biophysical analysis of drug efficacy on C. elegans models for neurodegenerative and neuromuscular diseases. PLoS One. 16 (6), e0246496(2021).
- Thomas, J. H. Genetic analysis of defecation in Caenorhabditis elegans. Genetics. 124 (4), 855-872 (1990).
- Kobet, R. A., et al. Caenorhabditis elegans: A Model System for Anti-Cancer Drug Discovery and Therapeutic Target Identification. Biomol Ther (Seoul). 22 (5), 371-383 (2014).
Reprints and Permissions
