This study assesses students’ behavioral engagement by detecting their behaviors in university classroom videos using a deep learning algorithm. Seven behaviors that are positively correlated with learning engagement are identified, and a scoring model is used to assess the overall engagement of individual students and the class.
A subscription to JoVE is required to view this content. Sign in or start your free trial.
Research Article
Behavioral Engagement Assessment in University Classrooms via Deep Learning-based Video Object Detection
In This Article
Summary
Abstract
This study aims to assess students’ learning engagement in university classrooms using deep learning-based video object detection. To do so, via correlation analysis, this research first identified seven classroom behaviors presenting highly positive correlation with learning engagement as indicators to measure students’ learning engagement; then it collected 30 synchronized videos of real classroom teaching from 6 classes from Shandong University of Science and Technology (SDUST) and divided them into a training set and a test set. After the seven behaviors were manually annotated in the training data, a machine learning algorithm was then trained in a supervised manner on this set. Once trained, the model generated initial annotations for the remaining unlabeled data. To achieve more accurate and efficient classroom behavior recognition, this study selected two representative algorithms, namely, Faster R-CNN and YOLOv5s, for behavior detection experiments. Based on a comparison of their detection performance in terms of accuracy and time cost, YOLOv5s was selected for classroom behavior detection in this study. Finally, this study used the focus group method to assign scores to each behavior and develop a three-level learning engagement scoring model. Based on automatically measured behavioral data, the model enables real-time, automatic assessment of learning engagement at both the individual and class levels.
Introduction
Learning engagement, referring to students’ participation, concentration, and efforts in learning, consists of behavioral engagement, emotional engagement, and cognitive engagement1. Students’ learning engagement reveals their learning situation and helps teachers adjust teaching strategies2. However, classroom learning engagement is mainly assessed by students’ self-reports and teachers’ observations3. The high teacher-student ratio in China’s universities means it takes teachers a great deal of time and effort to use traditional manual methods for learning engagement assessment.
In recent years, with the increasing popularity of intelligent recording and broadcasting classrooms in China, automatic measurement of learning engagement based on classroom videos has become possible4. From the perspective of intelligent technology-enhanced classroom teaching, this study applied deep learning methods to detect students’ behaviors in university classroom videos and proposed a scoring model for automatically measuring students’ behavioral engagement.
A brief review of behavioral engagement studies
There are three main levels of behavioral engagement: (1) At the level of the school, it refers to the enthusiasm of students to participate in extracurricular activities5. (2) At the level of the classroom, it includes students’ positive behaviors in class, such as compliance with class order, and destructive behaviors, such as skipping class or talking in class6. (3) At the level of the learning process, it refers to students’ participation and behaviors in learning tasks, such as asking questions and completing homework7. Currently, methods for assessing behavioral engagement can be broadly classified into three categories: manual, semi-automatic, and automatic methods8.
Manual methods, including self-report, interviews, teacher observation, and other traditional assessment methods, are labor-intensive and difficult to ensure objectivity and accuracy. Log analysis is a representative semi-automatic assessment method that primarily analyzes students’ learning log data collected from learning platforms, including indicators such as login frequency, online duration, and answer accuracy. This method can evaluate students’ learning engagement more objectively; however, the large volume and complexity of the data pose challenges for subsequent processing4. The automatic method is based on computer vision, using intelligent devices, such as recording and broadcasting platforms, to capture students’ expressions, gestures, behaviors, and other visual cues in class, primarily to assess classroom behavior. Compared with the previous two methods, this approach enables rapid measurement of behavioral engagement through computers and algorithms and is less susceptible to subjective interference9.
A brief review of behavioral engagement assessment based on object detection
With the rise of deep learning, object detection techniques are increasingly applied to learning engagement analysis. Object detection algorithms perform object classification and localization in images based on convolutional neural networks. In smart classrooms equipped with video recording systems, such algorithms can recognize visual information related to students’ postures, gestures, and facial expressions from classroom videos, thereby enabling automatic identification of students’ behaviors and assessment of their behavioral engagement. Consequently, the classroom learning state reflected by students’ nonverbal behaviors can be effectively interpreted9.
A variety of equipment and algorithms have been employed to collect and identify students’ multiple nonverbal behaviors from videos. Rahman et al.10 and Zaletelj and Košir11 used Kinect sensors to collect students’ line of sight, facial information, body posture features, etc, and analyzed students’ attention level using machine learning algorithms. Whitehill et al.8 used an iPad webcam to record students’ facial expressions to train a recognition model, proving that the machine learning technique is equal to human observation in the accuracy of learning engagement evaluation. Sukumaran and Manoharan12 detected the student’s engagement using EGG signals. Ashwin and Guddeti13 used convolutional neural networks to analyze classroom videos in a laboratory setting to detect non-verbal behaviors, such as facial expressions, hand postures, and body postures, to assess learning engagement. Bai et al.14 used Faster R-CNN with multiplexed feature fusion to achieve detection of classroom behaviors, such as studying, sleeping, and head down, by transfer learning. Deng et al.9 analyzed remote classroom videos by combining Faster R-CNN deep learning techniques and proposed a method to achieve behavior recognition and classroom engagement measurement based on students’ head, hand, and body postures.
Early studies were primarily conducted in laboratory settings, many of which focused on a single individual in a single scenario10,11,12,13, whereas more recent studies have increasingly examined real classroom environments9,14,15,16,17,18,19. Additionally, the range of behaviors examined has become increasingly diverse. For example, Bai et al.14 and Ouyang et al.15 analyzed classroom videos in which only two behaviors—head up and head down—were identified. Deng et al.9 investigated elementary school classroom videos and expanded the detected behavior categories from head movements to include hand and body movements. Zhang and colleagues16 collected five types of students’ behaviors, including looking up, looking down, sleeping, looking around, and yawning.
However, because the data were collected from elementary school classrooms, where students are typically seated in fixed positions, the range of observable behaviors remained relatively limited. Therefore, subsequent studies have increasingly focused on university classrooms. Many university classrooms are large, with around a hundred students often sitting at random, making it more difficult to detect students’ behavior. Moreover, in real university classroom settings, students exhibit greater behavioral diversity and interactivity, including interactions with teachers, classmates, blackboards, and textbooks. Yan et al.17 proposed a deep learning–based posture recognition method, BetaPose, which was designed to improve posture recognition accuracy in crowded classroom scenes. Tan et al.18 incorporated a coordinate attention (CA) module into the YOLOv9 network, and the resulting CA-YOLOv9 model was applied to the recognition of seven classroom behaviors in complex university classroom environments with large student populations. Wang et al.19 proposed a bidirectional feature augmentation network (BATNet) to identify students’ behaviors in intelligent classrooms, particularly for small and occluded targets.
With the algorithms developed, the speed and accuracy of behavior detection have been greatly improved; however, current studies have ignored the explanation of whether there is a correlation between detected classroom behaviors and students’ engagement, leaving questions such as whether certain behaviors can be used as parameters to measure behavioral engagement, and which behaviors can effectively reflect learning engagement, unanswered. In addition, a way to show students’ behavioral engagement explicitly needs to be worked out. Thus, this study identified classroom behaviors highly related to students’ learning engagement via correlation analysis; meanwhile, a scoring system was developed to construct an evaluation model of behavioral engagement. Consequently, automatic measurement of behavioral engagement can be achieved for both individual students and for the class as a whole.
Access restricted. Please log in or start a trial to view this content.
Protocol
All videos were obtained and used in compliance with current ethical practices of human research as prescribed by Shandong University of Science and Technology. The approval has been received for the usage of the data.
First, correlation analysis was conducted to identify students' behaviors that could serve as indicators of behavioral engagement. After the dataset was established by frame extraction and divided into a training set and a test set, two representative algorithms for object detection were run in the training set and compared in terms of accuracy and efficiency. Finally, the algorithm with better performance (YOLO-v5s) was selected to run on the test set to perform behavior detection. Figure 1 presents the flowchart of the process of identification and detection of students' behaviors.
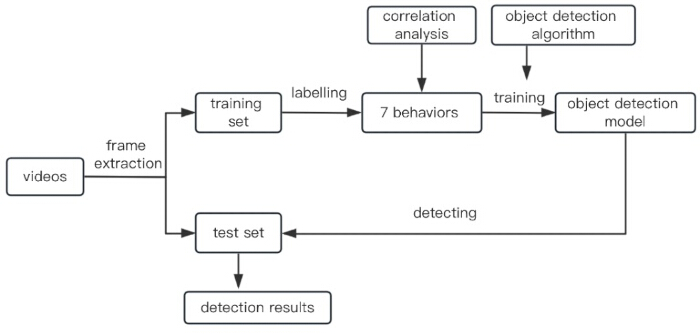
Figure 1. Flowchart of identification and detection of students' behaviors. Please click here to view a larger version of this figure.
Identification of indicators
Before conducting object detection experiments, non-verbal behaviors that indicate students' behavioral engagement needed to be identified. To date, studies of behavioral engagement based on object detection have achieved success in detecting a variety of nonverbal behaviors, including line of sight, facial information, and body posture9,10,11,12,13,14. However, whether specific behaviors are justified as indicators of students' behavioral engagement has not yet been discussed. Thus, in this study, a correlation analysis between students' behaviors and their behavioral engagement level was used to identify behaviors indicative of behavioral engagement.
(1) Behavioral engagement test
This study selected 122 undergraduate students from four natural classes of non-English majors at SDUST-Jinan as the sample for a correlational study. First, self-report scales were employed to collect behavioral engagement data from the 122 students, aiming to understand their behavioral engagement status from an internal experience perspective. Given that the classroom video data for this study were sourced from "Academic English" classes, the multidimensional evaluation instrument for learning engagement in college English classrooms developed by Ren Qingmei20 was adopted. This instrument is specifically designed for the Chinese foreign language teaching environment and employs the same classic categorization of learning engagement as this study, encompassing three dimensions: behavioral, affective, and cognitive engagement. Among them, the behavioral engagement instrument consists of nine items, corresponding to teacher-student interaction (e.g., "I actively answer questions posed by the teacher in English class"), individual effort (e.g., "I carefully consider difficulties encountered during English class learning"), peer interaction (e.g., "I collaborate with other students to complete English class learning tasks"), etc. Each item is presented in a Likert 5-point scale format, with response options of "hardly ever, rarely, sometimes, often, always", scored from 1 to 5, requiring students to select the option that best aligns with their learning experience. Students scoring 15 points or below were categorized as low-engagement students, those scoring 16-30 points as moderate-engagement students, and those scoring 31-45 points as high-engagement students. Finally, 120 valid scales were collected, with 17 students in the low-engagement category, 45 in the moderate-engagement category, and 58 in the high-engagement category.
(2) Behavior identification
Meanwhile, four recorded videos totaling 50 min from fully attended "Academic English" classes in these four classes were collected. With a frame drawn every 15 s, 200 images were finally extracted for observation. Based on repeated viewings of the video samples by three students, this study initially identified 12 types of students' behaviors in the classroom, namely, looking around, using cell phone, discussing, wandering, going around, eating or drinking, note-taking or reading, listening carefully, standing up (to answer a question), yawning, sleeping, and using computer. Examples of the 12 behaviors are shown in Figure 2.
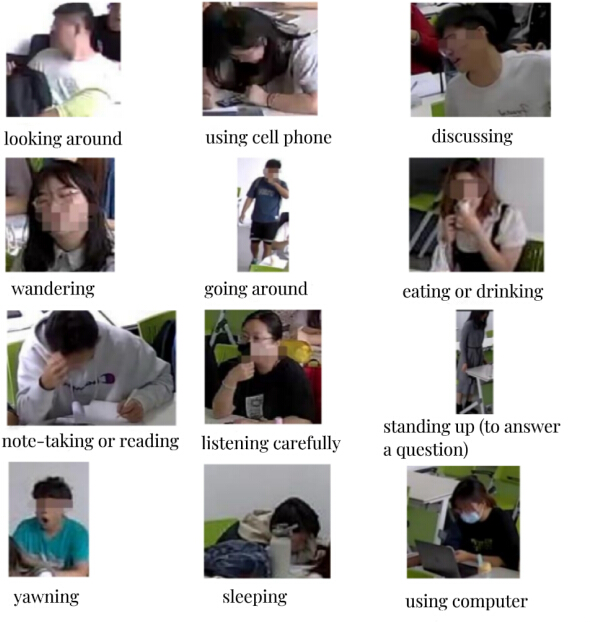
Figure 2. Examples of 12 behaviors. Please click here to view a larger version of this figure.
Each type was accompanied by detailed descriptions of visual features and spatiotemporal context, forming the Standard Operating Procedure for Classroom Behavior Annotation, which ensured conceptual consistency across annotations. Table 1 shows the 12 categories of students' behavior and the descriptions of each behavior.
Looking around included turning the head to the left, right, and back significantly. Students were considered to be in a discussion if they turned their heads and opened their mouths. In the classroom scenario, listening carefully was associated with looking directly at the blackboard or at the teacher standing in front of them; when the gaze was directed elsewhere, the student was very likely to be wandering. When the student showed a head-down posture, and there was an object such as a book or notebook, this behavior could be identified as taking notes or reading a book. When the behavior involved a standing posture and the student was standing at his/her seat with his/her mouth open, he/she was considered to be answering a question in a standing position; if the student was off his/her seat, he/she was considered to be going around, which might indicate that the student was late for class or leaving the classroom, etc. When a student was lying their head on the desk, he/she was identified as sleeping. When a student was holding food or drinks in his/her hands, the behavior was identified as eating or drinking. A wide-open mouth or a body-stretching behavioral posture indicated that the student was yawning.
| Behavior category | Behavior Description |
| Looking around | Obvious movement of the head to the right, left, or back |
| Using mobile phone | Touching a cell phone with hands |
| Discussing | Mouth open, accompanied by a movement of the head |
| wandering | A glazed stare at irrelevant places |
| Going around | Moving off the seat |
| Eating or drinking | Mouth open and in contact with food or water |
| Taking notes or Reading | Taking notes or looking down at a book |
| Listening carefully | Gazing at the blackboard or the teacher |
| Standing up (to answer questions) | Standing up at the seat with mouth open |
| Yawning | Mouth open or body stretching |
| Sleeping | Head on the desk |
| Using computer | An opened computer on the desk |
Table 1: Categories and descriptions of students' behaviors.
(3) Correlation analysis
Using the above criteria, 12 experienced teachers were invited to watch videos of the 120 students and record their behavioral types and frequencies. The behaviors were identified according to Table 1. The teachers were divided into four groups, with three teachers in each group. Each group was responsible for recording 30 students, with each of the three teachers independently recording 30 students' behaviors. Cronbach's Alpha (referred to as α) is an indicator to measure the internal consistency of a scale or questionnaire. The value range of Cronbach's alpha is 0 to 1, and α ≥ 0.8 is usually interpreted as good internal consistency21. If there was a high degree of consistency (α > 0.8, meaning a high degree of consistency) in the frequency of a particular type of behavior across all three teachers, the behavior's frequency was recorded as the average of the three frequencies. Subsequently, with the data on one hand representing the frequencies of different behaviors of each student, and on the other hand their behavioral engagement levels, a correlation analysis between the two factors was conducted. The result is shown in Table 2.
| Behaviors | Behavioral engagement | |
| Eating or drinking | Pearson Correlation | .319** |
| Sig. (2-tailed) | 0.004 | |
| N | 120 | |
| Yawning | Pearson Correlation | -.335** |
| Sig. (2-tailed) | 0 | |
| N | 120 | |
| Discussing | Pearson Correlation | .546** |
| Sig. (2-tailed) | 0 | |
| N | 120 | |
| Going around | Pearson Correlation | -.774** |
| Sig. (2-tailed) | 0 | |
| N | 120 | |
| Wandering | Pearson Correlation | .293** |
| Sig. (2-tailed) | 0.008 | |
| N | 120 | |
| Looking around | Pearson Correlation | -.834** |
| Sig. (2-tailed) | 0 | |
| N | 120 | |
| Reading or note-taking | Pearson Correlation | .912** |
| Sig. (2-tailed) | 0 | |
| N | 120 | |
| Listening carefully | Pearson Correlation | .881** |
| Sig. (2-tailed) | 0 | |
| N | 120 | |
| Standing up | Pearson Correlation | .330** |
| (to answer a question) | Sig. (2-tailed) | 0 |
| N | 120 | |
| Sleeping | Pearson Correlation | -.411** |
| Sig. (2-tailed) | 0 | |
| N | 120 | |
| Using | Pearson Correlation | .591** |
| mobile phone | Sig. (2-tailed) | 0 |
| N | 120 | |
| Using computer | Pearson Correlation | .362** |
| Sig. (2-tailed) | 0.001 | |
| N | 120 |
Table 2: Correlation analysis results.
In correlation analysis, r is the correlation coefficient, referring to the linear correlation degree between two variables, ranging from −1 to 1. According to the degree of relationship, correlation can be classified into the following types:
High correlation (│r│ ≥ 0.70)
Mid correlation (0.40 ≤ │r│ ≤ 0.70)
Low correlation (│r│ ≤ 0.40)
According to the direction of the relationship, it can be classified into the following types:
Positive correlation (r > 0)
Negative correlation (r < 0)
No correlation (r = 0)
From Table 1, it can be seen that seven behaviors, including looking around (r = −0.834**, p < 0.05), using cell phone (r = 0.591**, p < 0.05), discussing (r = 0.546, p < 0.05), going around (r = −0.774**, p < 0.05), note-taking or reading (r = 0.912**, p < 0.05), listening carefully (r = −0.881**, p < 0.05), and sleeping (r = −0.411**, p < 0.05), had a high or mid correlation with behavioral engagement, while behaviors such as eating or drinking (r = 0.319**, p = 0.04), standing up (to answer a question) (r = 0.330**, p = 0.00), yawning (r = −0.335**, p < 0.05), wandering (r = 0.293, p > 0.05), and using computer (r = 0.362, p < 0.05) presented a low or no correlation with behavioral engagement. Based on the correlation analysis, this study ultimately identified seven behaviors as indicators of learning engagement, namely, looking around, using a cell phone, discussing, going around, note-taking or reading, listening carefully, and sleeping.
Establishment of dataset
The video data used in this study were collected from the direct recording platform of SDUST, which provided synchronized videos of real classroom teaching of the course "Academic English". Ten videos from four classes of non-English majors were collected, each approximately 50 min in length, to establish a trainable dataset of students' classroom behavior. With a frame drawn every 15 s, 2,000 images were ultimately extracted with a resolution of 1,920 × 1,080.
Split of dataset
The experiment divided the student behavior dataset into two completely independent parts: a training set and a test set, as shown in Table 3, with no shared images. The dataset covered all seven student behaviors. The training set and test set were used for training model parameters and evaluating accuracy, respectively. The training parameters were set as shown in Table 4.
| Data set | Number of Images |
| Total | 2830 |
| Training set | 2111 |
| Test set | 719 |
Table 3: Splitting of student behavior dataset.
| Parameter | Value |
| Learning rate | 0.01 |
| Momentum | 0.937 |
| Weight decay | 0.0005 |
| Epoch | 100 |
| Batch Size | 16 |
Table 4: Setting of the experimental parameters.
To prevent data leakage caused by the same student appearing in different subsets and to preserve the natural temporal continuity of behaviors, a "Stratified Temporal Split" method was adopted.
Subject disjunction: The dataset was partitioned by unique student IDs, ensuring that students in the training, validation, and test sets were mutually exclusive.
Temporal partitioning: Videos were sorted chronologically. The first 70% of the temporal segments were used for training, the next 15% for validation, and the final 15% for testing. This method better simulated real-world temporal generalization compared to random splitting.
Class balancing: For underrepresented categories such as "sleeping" and "using cell phone", moderate oversampling was applied within the training set to ensure the model learned features from all categories.
Annotation of training dataset
An open-source annotation tool was used to manually annotate the training data. The tool was employed for bounding box annotation. The specific workflow was as follows: (1) Key frames were extracted at a fixed rate (1 frame/s) from surveillance videos covering different schools, time slots, and course types, followed by anonymization processing such as face blurring; (2) Following the annotation SOP, annotators used rectangular boxes to precisely delineate the student performing a specific behavior and assigned the corresponding category label; (3) Annotations were exported as XML files in PASCAL VOC format.
To ensure label quality, especially to avoid errors in distinguishing ambiguous behaviors (e.g., discussing vs. wandering), a "Three-Stage Annotation-Arbitration" collaborative mechanism was implemented:
Initial annotation: Each key frame was independently annotated by three trained annotators. Each label consists of a category label and a bounding box.
Consistency verification: Intersection-over-Union and category consistency between annotations were calculated. Bounding boxes, which are the results of initial annotation with IoU > 0.8 and identical category labels, were considered "consistent annotations". Bounding boxes with IoU ≤ 0.8 or nonidentical category labels were considered "inconsistent annotations".
Expert arbitration: For inconsistent annotations (e.g., ambiguous cases such as "looking around" vs. "discussing"), a panel of experts with teaching experience made the final decision based on the video clip, the behavioral context, and pedagogical prior knowledge. The final determination is made by verifying the label accuracy through inspection of the key frame's source video segment.
The annotation revealed that students' behaviors were characterized by multiple, intensive, and small targets, as shown in Figure 3.
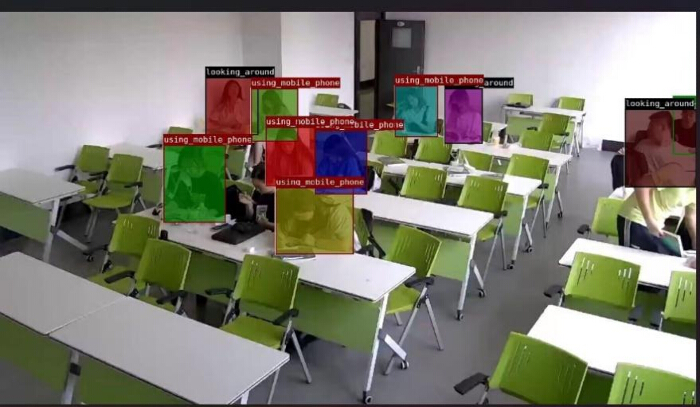
Figure 3. An example of classroom image annotation. Please click here to view a larger version of this figure.
Students in class showed behaviors such as listening carefully, using a cell phone, and reading or taking notes frequently, while the frequency of going around, wandering, etc. was relatively low. Figure 4 shows the distribution of classroom behaviors in the training dataset.
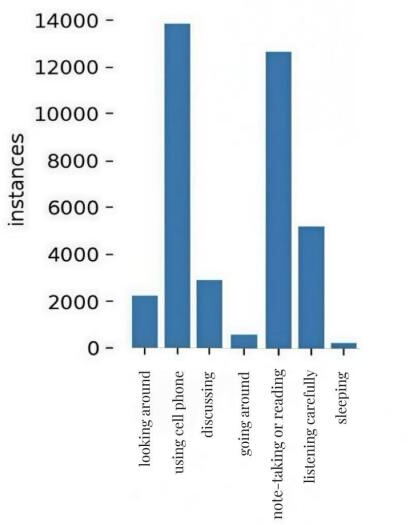
Figure 4. Distribution of behaviors in the training dataset. Please click here to view a larger version of this figure.
Detection of students' behaviors
The deep learning-based object detection frameworks were mainly divided into two categories22: two-stage methods, represented by the Faster R-CNN series, and one-stage methods, represented by YOLO. For the first category, the two-stage detection methods first generated region proposals using a Region Proposal Network (RPN) before performing detailed class probability calculations and bounding-box regression. For the second category, the one-stage methods streamlined the detection process by simultaneously predicting object classes and bounding boxes in a single stage. While two-stage methods emerged earlier in the field's development, one-stage approaches have gained popularity due to their simplified architecture and computational efficiency. To achieve more accurate and efficient classroom behavior recognition, this study selected representative algorithms from both categories, namely Faster R-CNN23,24 and YOLO-v525,26, to conduct classroom behavior detection experiments, and compared the detection results of the two algorithms before finally deciding on the algorithm used for behavior detection in this study.
In order to efficiently evaluate the experimental results, the focus was placed on overall detection accuracy versus the time cost of each algorithmic model. Mean Average Precision (mAP) and training time (h) were used to measure the two models.
Seven categories of behaviors were detected for recognition by the two methods, and the average detection accuracy values (AP) were recorded in Table 5. Among them, YOLO-v5s outperformed Faster R-CNN in the detection of three categories of actions, namely going around, listening attentively to lectures, and using cell phones, with AP values of 100%, 62.7%, and 31.8%, respectively.
| Network Model | Discussing | Going Around | Listening Carefully | Looking Around | Sleeping | Taking Notes or Reading | Using Mobile Phone |
| Faster R-CNN | 32.6 | 99.5 | 45.4 | 9.3 | 22 | 52.6 | 26.8 |
| YOLO-v5s | 17.8 | 100 | 62.7 | 3.8 | 19 | 51 | 31.8 |
Table 5: The average precision of the two algorithms for a single class.
The training time and average detection accuracy of the two classical detection networks on the test set at an IoU of 0.5 are shown in Table 6. Although the Faster R-CNN network had higher accuracy, its running time was relatively long. By comparison, YOLO-v5s had a 30% shorter running time with only a 0.3% reduction in accuracy, demonstrating a greater improvement in efficiency. Given the need for real-time detection of student behavior in the classroom in this study, it was expected that the training time for the network should be as short as possible. Considering both the detection accuracy and time cost of the models trained on the training set, this paper concluded that YOLO-v5s was more suitable for classroom student behavior detection.
| Network Model | h | mAP@0.5 (%) |
| Faster R-CNN | 2.88 | 41.17 |
| YOLO-v5s | 2.016 | 40.87 |
Table 6: Comparison of detection performance.
Therefore, YOLO-v5s was chosen to perform classroom behavior detection in this study. The detection results produced by YOLO-v5s are illustrated in Figure 5, showing continuous multi-target behavior detection along with corresponding labels.
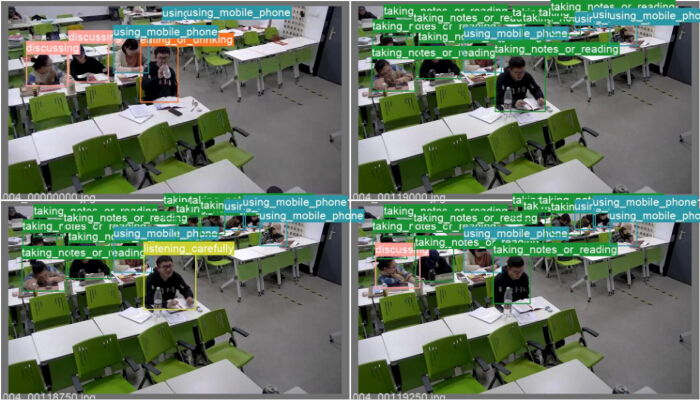
Figure 5. Examples of detection results of the test set. Please click here to view a larger version of this figure.
(1) Data augmentation and preprocessing
To enhance model robustness and generalization, a composite data augmentation strategy was employed during training, including random affine transformations, color jitter, and random occlusion. All images were uniformly resized to 640 × 640 pixels.
(2) Training strategy
The training process was divided into three phases:
Frozen Backbone Phase (Epochs 1-100): The backbone network was frozen, and only the detection head was trained, using a low learning rate for warm-up.
Full Network Fine-tuning Phase (Epochs 101-250): All network layers were unfrozen. A cosine annealing scheduler adjusted the learning rate.
Refinement Phase (Epochs 251-300): Exponential Moving Average was applied to stabilize training, and the intensity of data augmentation was reduced for model refinement.
To address class imbalance, class-specific weights inversely proportional to their frequencies in the training set were applied to the loss function.
(3) Postprocessing and temporal optimization
To maintain temporal consistency in classroom behaviors, a temporal consistency filter was applied after model inference. Specifically, for a detected target in a video sequence, its behavior category had to be identified in at least three consecutive frames to be confirmed, effectively filtering transient false positives.
Establishment of behavioral engagement scoring method
This study used the focus group method to assign scores to each behavior. Twenty first-line university teachers were invited to rate the engagement of the seven categories of behavior based on their classroom management experience. All 20 teachers had been teaching for more than 10 years and had taught a wide range of courses across multiple disciplines. The engagement scores ranged from 0 to 3, with 0-1 indicating low engagement, 1-2 indicating medium engagement, and 2-3 indicating high engagement. If there was a high degree of consistency (α > 0.8) in the ratings of multiple raters for a particular type of behavior, the engagement of that behavior was measured by averaging the individual teachers' ratings. The final ratings for each type of behavior are shown in Table 7.
| Behavior type | looking around | using cell phone | discussing | going around | note-taking or reading | listening carefully | sleeping |
| Engagement score | 0.9 | 1.2 | 1.9 | 0.6 | 2.7 | 2.8 | 0.2 |
Table 7: Behavior ratings.
The formula for behavioral engagement of each student is
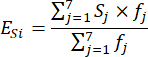
ESi= behavioral engagement of student, Sj = score of behavior, fj = frequency of behavior j.
Assuming that the number of detected behaviors for a student in a class was 100, including 4 "discussing", 68 "listening attentively", 25 "reading/taking notes", and 3 "looking around", the student's overall personal engagement score was (1.9 × 4 + 2.8 × 68 + 2.7 × 25 + 0.9 × 3) / 100 = 2.68. Taking the whole lecture as a benchmark, behavioral engagement was divided into four levels according to equal-interval division of a 0-3 scale: a score below 0.75 was defined as "not engaged", 0.76-1.5 as "slightly engaged", 1.6-2.25 as "engaged", and 2.26-3 as "very engaged"; thus, the student was evaluated as "very engaged" for the class.
The behavioral engagement for the whole class referred to the average score of all the students. The formula for behavioral engagement of the class is:
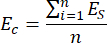
Ec =behavioral engagement of the class, ES =behavioral engagement of a certain student, n=number of students
Access restricted. Please log in or start a trial to view this content.
Results
By detecting behaviors and using the scoring model, automatic measurement of students’ behavioral engagement was achieved. Taking one class in the video as an example, the real-time behavioral engagement of each student could be calculated based on behavioral detection results and the scoring model. Figure 6 illustrates the behavioral engagement of two students in this class, displaying their engagement levels at various time points. It was found that, on average, student A ...
Access restricted. Please log in or start a trial to view this content.
Discussion
This study realized the automatic recognition and measurement of behavioral engagement. Compared to previous studies, the behaviors identified were more representative of university classrooms (such as using cell phone), and the assessment of behavioral engagement was presented in figures, making it intuitive to see. This automatic measurement approach enabled teachers to efficiently and clearly assess the engagement of individual students as well as the class as a whole, thereby supporting personalized instruction and i...
Access restricted. Please log in or start a trial to view this content.
Disclosures
The authors have no conflicts of interest to declare.
Acknowledgements
This research was supported by Shandong Social Science Planning Fund Program (23CRWJ11).
Access restricted. Please log in or start a trial to view this content.
Materials
| Name | Company | Catalog Number | Comments |
|---|---|---|---|
| Classroom videos | The video data used in this study are collected from the direct recording platform of Shandong University of Science and Technology (SDUST), which are synchronized videos of real classroom teaching of the course Academic English. 30 videos from 6 classes of non-English majors were collected, about 50 minutes each, to establish a trainable data set of students’ classroom behavior. | ||
| IBM SPSS Statistics 26 | IBM | SPSS for Windows is a modular software package that integrates data entry, organization, and analysis functions.Its basic functions include data management, statistical analysis, chart analysis, output management, and so on. SPSS is mainly used for consistency analysis and correlation analysis in this article. | |
| Labeling 1.8.6 | Labeling is a visual image annotation tool. It is written in Python and utilizes Qt for its graphical interface. Annotations are saved as XML files in the PASCAL VOC format, which is used by ImageNet. Additionally, it supports the YOLO format. It's used for datasets required for object detection networks such as Faster R-CNN, YOLO, and SSD to annotate objects in images. | ||
| MMDetection 2.22.0 | MMDetection, 2.22.0, MMDetection is an object detection toolbox that includes rich object detection, instance segmentation, and panoramic segmentation methods, as well as related components and modules. |
References
- Fredricks, J. A., Blumenfeld, P. C., Paris, A. H. School engagement: potential of the concept, state of the evidence. Rev Educ Res. 74 (1), 59-109 (2004).
- Xu, J. F., Qiu, Y. J. Development and validation of an online English learning engagement scale for college students. Foreign Lang Their Teach. 42 (1), 39-50 (2025).
- Xing, C. B., Xu, M. B. Higher education expansion, teacher–student ratio and education quality. Econ Educ Rev. 8 (1), 59-88 (2023).
- Li, X., Li, Y. Y., Bao, H. G., Cheng, L. New developments in learning engagement evaluation: from one-dimensional analysis to multimodal fusion. Res Audiovis Educ. 42 (10), 100-107 (2021).
- Finn, J. D., Pannozzo, G. M., Voelkl, K. E. Disruptive and inattentive-withdrawn behavior and achievement among fourth graders. Elem Sch J. 95 (5), 421-434 (1995).
- Finn, J. D., Rock, D. A. Academic success among students at risk for school failure. J Appl Psychol. 82 (2), 221-234 (1997).
- Skinner, E. A., Belmont, M. J. Motivation in the classroom: reciprocal effects of teacher behavior and student engagement across the school year. J Educ Psychol. 85 (4), 571-581 (1993).
- Whitehill, J., Serpell, Z., Lin, Y. C., Foster, A., Movellan, J. R. The faces of engagement: automatic recognition of student engagement from facial expressions. IEEE Trans Affect Comput. 5 (1), 86-98 (2014).
- Deng, W., Xia, L. J., Liu, Q. T., Zhang, S., Wei, Y. T. Analysis of distance classroom learning engagement based on video recognition. J Contin High Educ. 35 (6), 15-24 (2022).
- Designing an empirical framework to measure the level of interest of humans. Rahman, M., et al. Proc Int Conf Electr Inf Commun Technol (EICT), , 581-585 (2015).
- Zaletelj, J., Košir, A. Predicting students’ attention in the classroom from Kinect facial and body features. EURASIP J Image Video Process. 2017 (1), 80-82 (2017).
- Sukumaran, A., Manoharan, A. Student engagement recognition: comprehensive analysis through EEG and verification by image traits using deep learning techniques. IEEE Access. 13 (1), 11639-11662 (2025).
- Unobtrusive students’ engagement analysis in computer science laboratories using deep learning techniques. Ashwin, T. S., Guddeti, R. M. R. Proc IEEE Int Conf Adv Learn Technol (ICALT), , 436-440 (2018).
- Bai, J., et al. Detection of students’ classroom performance based on Faster R-CNN and transfer learning with multi-channel feature fusion. J Guangxi Norm Univ Nat Sci Ed. 38 (5), 1-11 (2020).
- Ouyang, W. X., Fan, W. S., Chen, L. W. Classroom head-up and head-down behavior recognition based on YOLOv5. Comput Knowl Technol. 19 (29), 9-12 (2023).
- Classroom behavior recognition and detection based on deep learning. Zhang, J. P., Zhang, Z. Y., Guan, L. T., Hu, H. M. Proc Int Conf Comput Vis Image Deep Learn (CVIDL), , 430-433 (2024).
- Yan, X. Y., Kuang, Y. X., Bai, G. R., Li, Y. Student classroom behavior recognition based on deep learning. Comput Eng. 49 (7), 251-258 (2023).
- Tan, S. Y., Wang, Z. X., He, G. D. Real-time panoramic multi-scale classroom behavior recognition based on the CA-YOLOv9 network. Mod Educ Technol. 34 (7), 123-130 (2024).
- Wang, S. B., Lin, Z. J., Huang, J., Ju, J. H. A real-time network-based method for analyzing student classroom behavior. J Zhejiang Univ Sci Technol. 37 (3), 259-269 (2025).
- Ren, Q. M. Formulation and verification of a multidimensional evaluation scale for student engagement in college English classrooms. Shandong Foreign Lang Teach. 43 (4), 58-66 (2022).
- Cronbach, L. J. Coefficient alpha and the internal structure of tests. Psychometrika. 16 (3), 297-334 (1951).
- Zhou, J. Y., Zhao, Y. M. Application of convolutional neural networks in image classification and object detection. Comput Eng Appl. 53 (13), 34-41 (2017).
- Fast R-CNN. Girshick, R. Proc IEEE Int Conf Comput Vis, , 91-99 (2015).
- Ren, S. P., He, K. M., Girshick, R., Sun, J. Faster R-CNN: toward real-time object detection with region proposal networks. Adv Neural Inf Process Syst (NeurIPS). 29, 91-99 (2016).
- Multiple object tracking based on YOLOv5 and an optimized DeepSORT algorithm. Bai, T. J Phys Conf Ser, 2547 (1), 012001(2023).
- Wang, Y. P., Chi, Z. Z., Liu, M., Li, G., Ding, S. High-performance lightweight fall detection using an improved YOLOv5s algorithm. Machines. 11 (8), 818(2023).
Access restricted. Please log in or start a trial to view this content.