This protocol quantitatively measures the stability and half-life of intergenic and intragenic enhancer RNAs in mouse embryonic stem cells using Actinomycin D treatment, RT-qPCR, and nonlinear regression analysis. Position-specific normalization strategies are incorporated to accurately model eRNA decay dynamics in a context-dependent manner.
A subscription to JoVE is required to view this content. Sign in or start your free trial.
Method Article
Optimized Quantitative Assessment of Enhancer RNA Stability in Mouse Embryonic Stem Cells
In This Article
Summary
Abstract
Enhancer RNAs (eRNAs) are non-coding transcripts produced from transcriptionally active enhancer regions and are increasingly recognized as key regulators of gene expression. Despite their functional importance, the stability and degradation dynamics of eRNA remain poorly characterized, particularly in embryonic stem cells (ESCs), where transcriptional programs are highly dynamic and context-dependent. This protocol presents a quantitative method to assess the decay kinetics and half-life of intergenic and intragenic eRNAs in mouse ESCs. Transcription is inhibited using Actinomycin D, and total RNA is collected at multiple defined time points. cDNA is synthesized using both random hexamer and oligo(dT) primers to enable detection of both polyadenylated and non-polyadenylated transcripts. For intergenic eRNAs, normalization is performed using either a housekeeping gene or the Ct value at time 0 min. For intragenic eRNAs, a dual normalization approach is employed to minimize interference from overlapping pre-mRNA. The decay curves are analyzed using a one-phase exponential decay model, enabling accurate estimation of the half-life. The protocol reveals that eRNAs in mESCs exhibit rapid turnover, with a half-life of approximately 2-3 min. This methodology provides a robust and reproducible framework for studying eRNA stability, offering insight into enhancer activity and RNA dynamics in pluripotent stem cell contexts.
Introduction
Enhancers are cis-regulatory elements (CREs) that regulate tissue- and stimulus-specific gene expression by serving as binding platforms for transcription factors and co-regulators1,2,3,4,5,6. Although enhancers can be located distantly from their target genes at the linear genome level, chromatin looping mechanisms enable spatial proximity to promoters, facilitating transcriptional regulation. Active enhancers are bidirectionally transcribed by RNA polymerase II (Pol II), producing long non-coding RNAs known as enhancer RNAs (eRNAs), which typically have a median length of approximately 1 kb1,2,7,8,9. The expression of eRNAs is strongly correlated with the activation of nearby target genes10,11,12, and functional studies have consistently shown that depletion of eRNAs reduces the transcription of their target genes, suggesting that eRNAs act as functional regulators rather than transcriptional byproducts13,14,15,16,17. Despite their functional importance, experimental protocols for reliably detecting and quantifying eRNAs remain limited.
In stem cells, enhancer activity plays a crucial role in maintaining pluripotency and driving developmental transitions18,19. Enhancers can reside in intergenic regions (intergenic or extragenic enhancers) or be embedded within gene bodies as intragenic enhancers8. While intergenic enhancers have been extensively studied across various cell types, intragenic enhancers remain relatively underexplored due to technical challenges, such as transcriptional overlap with host gene pre-mRNAs and the presence of histone modifications associated with transcriptional elongation20,21. Nevertheless, recent studies have shown that both intergenic and intragenic enhancers contribute to gene regulatory networks involved in pluripotency22,23 and early differentiation24 in ESCs. Notably, nearly half of all annotated enhancers are intragenic20,25, and their activity varies across developmental stages, often increasing in differentiated tissues8,26,27,28. However, the prevalence and functional roles of intragenic enhancers in ESCs remain incompletely understood. In particular, while intergenic eRNAs are transcribed between genes, intragenic eRNAs are transcribed within gene bodies and may overlap with pre-mRNA transcripts. This positional difference necessitates distinct analytical approaches when interpreting and quantifying intergenic and intragenic eRNAs.
Unlike mRNAs, eRNAs typically lack a 3′ poly(A) tail, resulting in low stability and rapid degradation1,2,7,8,9. This intrinsic instability makes it challenging to analyze eRNA expression, especially in time-course experiments. In neurons, eRNAs have been reported to exhibit a half-life as short as 7.5 min17. However, it remains unclear whether this instability is consistent across different cell types, particularly in ESCs, where both enhancer activity and eRNA transcription are highly cell type-specific7,17,29,30. ESCs rely on dynamic gene regulatory programs to maintain pluripotency or initiate differentiation, making them a unique system for examining eRNA turnover31,32. Given the rapid transcriptional shifts in ESCs, understanding eRNA decay in this context may reveal how enhancer activity is temporally regulated17. Furthermore, differences between intergenic and intragenic eRNAs, such as overlap with host gene transcripts, require distinct analytical approaches20. Despite the importance of these questions, few standardized methods exist for measuring eRNA half-life in ESCs or for comparing the decay dynamics of different eRNA types.
This study presents a quantitative protocol to assess the stability and half-life of eRNAs transcribed from intergenic and intragenic enhancers in mESCs. Transcriptional inhibition is achieved using actinomycin D (ActD) at defined time intervals, followed by real-time quantitative PCR (RT-qPCR) and nonlinear regression analysis to quantify eRNA decay. To address the positional differences between intergenic and intragenic enhancers, the method incorporates distinct normalization strategies, enabling a systematic and accurate comparison of eRNA degradation dynamics. This structured analytical framework provides valuable insights into eRNA turnover in pluripotent stem cells.
Access restricted. Please log in or start a trial to view this content.
Protocol
All experiments in this study were performed using mouse embryonic stem cells (mESC; E14Tg2A) that were not generated directly in our laboratory but were obtained from an established cell line, which is also commercially available from ATCC (CRL-1821). Therefore, the work described in this article does not require Institutional Animal Care and Use Committee (IACUC) review at Chungnam National University. The reagents and the equipment used are listed in the Table of Materials.
1. Cell culture of mESCs
- Pre-coat 6-well cell culture plates with 0.1% gelatin (2 mL per well). Incubate the plates at 37 °C for 10 min.
- Aspirate the gelatin and wash each well once with 1 mL of PBS. Sterilize the plates by UV irradiation for at least 15 min.
- Seed mESCs onto the gelatin-coated plates using complete 2 mL of cell culture medium (Table 1).
NOTE: Add LIF freshly to the culture medium at the required concentration immediately before use, based on the total medium volume needed for the experiment.
| Components | Final Concentration | Volume used |
| Glasgow’s Minimum Essential Medium (GMEM) | - | 500 mL |
| KnockOut™ Serum Replacement (KOSR) | 10% | 50 mL |
| Penicillin-streptomycin | 0.50% | 2.5 mL |
| Fetal bovine serum (FBS) | 1% | 5 mL |
| Sodium pyruvate | 0.1 mM / 1 % | 5 mL |
| MEM Non-Essential Amino Acids Solution (MnEA) | 0.1 mM/ 1 % | 5 mL |
| 2-mercaptoethanol | 0.1 mM | 910 uL |
| Leukemia inhibitory factor (LIF) | 1000 U/mL | - |
Table 1: Composition of mESC culture medium. Components and their final concentrations used to prepare the mESC culture medium. Typical volumes are listed per 500 mL of total medium.
- Maintain the cells under standard culture conditions at 37 °C in a humidified incubator with 5% CO2 (Figure 1A).
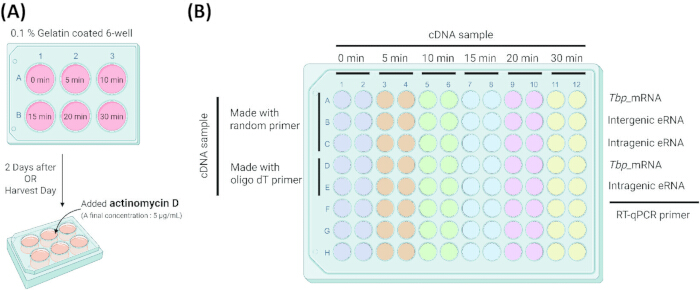
Figure 1: Experimental design for eRNA stability analysis. (A) Schematic of the transcriptional arrest experiment. Cells were plated on 0.1% gelatin-coated 6-well plates and treated with actD (final concentration: 5 µg/mL) at the indicated time points (0 min, 5 min, 10 min, 15 min, 20 min, and 30 min) after harvest. (B) RT-qPCR assay layout. Total RNA was reverse-transcribed using either random hexamer or oligo(dT) primers. cDNA samples from each time point were analyzed using RT-qPCR for the indicated targets: Tbp_mRNA, intergenic eRNA, and intragenic eRNA. Please click here to view a larger version of this figure.
2. Actinomycin D (ActD) treatment
- Dissolve actD in DMSO to prepare a stock solution at a concentration of 1 mg/mL33.
NOTE: While Actinomycin D is used here for short-term transcriptional inhibition, alternative inhibitors such as triptolide may also be employed to block transcription initiation in future studies. Because both Actinomycin D and DMSO are light-sensitive, prepare the stock solution in amber microtubes, protect it from light, and store it at -20 °C until use. - Two days after cell seeding (or on the day of harvest), add the actD stock solution to the culture medium to a final concentration of 5 µg/mL33. Collect samples at 0 min, 5 min, 10 min, 15 min, 20, and 30 min after treatment (Figure 1A).
NOTE: While most eRNAs exhibit rapid decay within the 0-30 min range, some eRNAs may display longer half-lifes. Depending on the characteristics of the target locus, additional sampling at extended time points (e.g., 1 h, 3 h, or 6 h) may be included to more accurately capture decay kinetics. In this study, Actinomycin D was used at a concentration of 5 µg/mL for short-term (≤30 min) transcriptional blockade; however, for longer incubations (>1 h), it is recommended to reduce the concentration to 1-2 µg/mL to minimize cellular stress responses. Because DMSO itself can affect transcriptional activity, a DMSO-only control should also be included.
3. RNA extraction and cDNA synthesis
- Remove the cell culture medium by suction, and add 1 mL of TRIzol reagent to each well. Incubate the plates on a shaker for 10 min at room temperature (RT)34,35, then transfer the lysate to a new 1.5 mL tube.
NOTE: After TRIzol treatment, samples may be stored at -80 °C for up to one week prior to RNA extraction. Because TRIzol reagent contains phenol and guanidinium isothiocyanate, which are highly toxic and corrosive, handle it with great care. All TRIzol waste should be collected in a designated organic solvent waste container for proper disposal. - Add 500 µL of chloroform to each sample. Vigorously shake the tubes and incubate at RT for 3 min.
- Centrifuge the samples at 13,500 × g for 10 min at 4 °C.
- Carefully transfer the aqueous phase to a new 1.5mL tube containing an equal volume of isopropanol. Incubate the mixture at RT for 10 min to enhance RNA precipitation.
NOTE: Carefully transfer only the clear upper aqueous phase to avoid contamination with the interphase. For increased RNA yield, incubate samples at -20 °C for 1 h to overnight (O/N) after adding isopropanol. For low-input samples, add glycogen (final 10-20 µg/mL) or GlycoBlue just before adding isopropanol to improve RNA pellet visibility and recovery efficiency. Isopropanol is highly flammable and potentially harmful to human health; inhalation of vapors or contact with skin or eyes may cause irritation, headache, dizziness, or central nervous system depression. Handle with caution, and collect all remaining solutions in an approved organic solvent waste container for proper disposal. - Centrifuge the samples again at 13,500 × g for 10 min at 4 °C and discard the supernatant.
- Wash the resulting RNA pellet with 1 mL of 75% ethanol. Centrifuge at 6,800 × g for 5 min at 4 °C.
NOTE: Gently invert the tube after ethanol addition to lift the pellet. - Remove the supernatant carefully and air-dry the pellet for 10 min at 42 °C. Resuspend the dried pellet in RNase-free water and incubate at 55 °C for 10 min.
NOTE: When RNA purity is high, the white pellet may become translucent during the air-drying process. Avoid over-drying the pellet for more than 10 min, as excessive drying can reduce resuspension efficiency. - Measure RNA concentration and purity using a NanoDrop spectrophotometer.
- Synthesize cDNA from µg of RNA using the M-MLV cDNA Synthesis Kit, following the manufacturer's instructions (Table 2).
| Components | Volume used |
| 10X M-MLV RT buffer | 2 uL |
| dNTP | 2 uL |
| Primer (Random / Olido dT) | 1uL |
| M-MLV RT | 1uL |
| Rnase inhibitor | 0.5 uL |
| RNA sample | 2ug (Volume adjusted based on RNA sample concentration) |
| DW | Volume adjusted depending on RNA sample concentration (to make up the final volume) |
| Total Volume | 20 uL |
Table 2: Composition of the cDNA synthesis reaction (M-MLV reverse transcriptase). Detailed volumes and reagents used for reverse transcription of 2 µg of total RNA using the M-MLV cDNA Synthesis Kit. The volume of the RNA sample was adjusted based on its concentration, and nuclease-free DW was added to bring the final reaction volume to 20 µL.
- Incubate the cDNA reaction at 37 °C for 2 h, then heat-inactivate the enzyme at 85 °C for 5 min.
NOTE: Store synthesized cDNA at -20 °C. The typical cDNA concentration is approximately 100 ng/µL. To detect intragenic eRNAs, synthesize cDNA from the same RNA sample using both random hexamer primers and oligo(dT) primers.
4. Real-time quantitative polymerase chain reaction (RT-qPCR)
- Prepare a 10 µL reaction mixture containing 15 ng of cDNA, 5 µL of Power SYBR Green PCR master mix, 5 pmol of each primer, and distilled water (DW).
NOTE: eRNA loci often contain or are adjacent to repetitive sequences, requiring careful primer design. Use repeat-masked sequences to restrict candidate regions and verify primer-pair specificity across the genome using BLAST. When possible, include nearby control regions to exclude non-specific amplification36. - Perform amplification using a real-time PCR system with the following thermal cycling condition: an initial activation and denaturation step at 50 °C for 2 min and 95 °C for 10 min, followed by 40 cycles of denaturation at 95 °C for 15 s, and annealing, extension, and fluorescence measurement at 60 °C for 1 min34,37 (Table 3).
| Stage | Step | Temperature (°C) | Time | Cycle |
| Hold Stage | Reverse transcription | 50 | 2 min | 1 |
| Initial denaturation | 95 | 10 min | 1 | |
| PCR Stage | Denaturation | 95 | 15 s | 40 |
| Annealing/Extension | 60 | 1 min | 40 | |
| Melt curve Stage | Denaturation | 95 | 15 s | 1 |
| Annealing | 60 | 1 min | 1 | |
| Dissociation (melting curve) | 95 | 15 s | 1 |
Table 3: Thermal cycling conditions for RT-qPCR. Summarized temperature, time, and cycle conditions for reverse transcription, 40-cycle qPCR (10 µL reaction), and standard melt curve analysis.
- For intragenic eRNA quantification, analyze both Tbp (or other housekeeping/control gene) and the intragenic enhancer region using cDNA synthesized with oligo(dT) primers. For intergenic eRNAs, use only cDNA synthesized with random hexamer primers (Table 4 and Figure 1B).
NOTE: Run each sample in technical duplicates (two wells) to allow averaging during data analysis.
| Gene name | Primer probe | Sequence(5'-3') | Amplicon sizes |
| Tbp | Forward | TGACTCCTGGAATTCCCATC | 122 bp |
| Reverse | TTGCTGCTGCTGTCTTTGTT | ||
| Nsun2_mRNA | Forward | GGATGAAGCAGTGATCGCAG | 93 bp |
| Reverse | ATCCACTTCAGTCCTGGCAA | ||
| Pou5f1_mRNA | Forward | TCCCTACAGCAGATCACTCAC | 80 bp |
| Reverse | CGCCGGTTACAGAACCATAC | ||
| Sox2_mRNA | Forward | ACAGATGCAACCGATGCACC | 105 bp |
| Reverse | TGGAGTTGTACTGCAGGGCG | ||
| Nsun2_eRNA | Forward | CCTGAGAGGTGTTTGCTTTGT | 110 bp |
| Reverse | AGGTTAACACATCAGCCCCA | ||
| Pou5f1_eRNA | Forward | CACTTCTCTGGGGTCTCTGG | 107 bp |
| Reverse | CCAGGACAAGACAGCCATTG | ||
| Sox2_eRNA | Forward | AGTCAGCTACATGGGCAGAG | 119 bp |
| Reverse | CCCCTCTTCTCACCGTACAG | ||
| Nsun2_negative control | Forward | CCCCGTGTTTAAGAGGAATGA | 88 bp |
| Reverse | ACTGAGAACAACCCACTAGCA |
Table 4: Primer sequences for RT-qPCR analysis. Forward and reverse primer sequences used for specific amplification of each target gene in RT-qPCR experiments. These primers were optimized to ensure accurate quantification of mRNA and eRNA expression.
5. eRNA stability data Analysis 22
- Analyze all data using the ΔCt method, and normalize relative eRNA levels to Tbp_mRNA (Supplementary File 1 and Figure 2A).
NOTE: If the Ct value difference between two technical replicates exceeds 0.5, exclude the data from further analysis. Calculate relative gene expression levels using the ΔCt method by subtracting the Ct value of the control gene (e.g., Tbp_mRNA) from that of the target gene (ΔCt = Control_Ct - Target_Ct). Relative expression can then be computed as 2^-ΔCt (Supplementary File 2B). - For intragenic eRNA quantification, normalize expression values by dividing the values from cDNA synthesized using random hexamers by those from cDNA synthesized using oligo(dT) primers.
NOTE: Perform all qPCR reactions using three independent biological replicates (n = 3). - Normalize each time point's expression level (obtained viaΔCt method) to the 0 min value and plot the decay curve.
NOTE: Although this protocol employs short Actinomycin D treatment, prolonged exposure to transcription inhibitors (e.g., ActD) may also reduce housekeeping gene expression. For higher-precision quantification, we recommend adding an exogenous spike-in RNA (e.g., ERCC) at the cell lysis step to correct for variations in RNA extraction efficiency, reverse-transcription efficiency, and pipetting accuracy, thereby enabling more consistent normalization across samples38,39. - Plot normalized eRNA levels over time and fit them using a nonlinear regression model (one-phase exponential decay) in GraphPad Prism (Supplementary File 3).
- Estimate eRNA half-life from individual biological replicates.
- Open GraphPad Prism and select Create > XY (Options: X = Numbers; Y = Enter and plot a single Y value for each point).
- Enter the time points (0, 5, 10, 15, 20, and 30 min) as X-axis values.
- List the sample names on the Y-axis (Group) and input the corresponding single data value for each time point.
- Select Analyze > Regression and Curves > Nonlinear Regression (Curve Fit).
- In the Exponential tab, select the One phase decay model.
- In the Table to Result sheet, calculate the average and standard deviation of the half-life values for each sample using Excel or similar software. Plot the resulting values.
- Fit decay curves with 95% confidence intervals
- Open GraphPad Prism and select Create > XY (Options: X = Numbers; Y = Enter 3 replicate values in side-by-side subcolumns).
- Enter the time points (0, 5, 10, 15, 20, and 30 min) as X-axis values.
- List the sample names on the Y-axis (Group) and input the three replicate values for each eRNA sample into the corresponding data sheet.
- Select Analyze > Regression and Curves > Nonlinear Regression (Curve Fit).
- In the Exponential tab, select the One phase decay model for analysis.
- In the Table to Result sheet, extract the 95% confidence interval (CI) values obtained from the analysis of the triplicate samples.
NOTE: Use the following decay equation: Y = (Y0 - Plateau) • e-kt + Plateau, where Y is the relative eRNA level at time t, Y0 is the initial eRNA level, and k is the decay constant. Do not fix the Plateau to zero during eRNA curve fitting, as previous studies show that eRNA may persist and not completely degrade over time17,40. However, fix the Plateau to zero when analyzing mRNA decay, following prior mRNA protocols41,42. Allow GraphPad Prism to automatically calculate the eRNA half-life (t₁/₂) using the formula: t1/2 = In(2)/ k. Enter time in min; report the resulting half-life values in min.
Access restricted. Please log in or start a trial to view this content.
Results
To assess RNA stability following transcriptional arrest, mESCs were treated with actD, and total RNA was collected at defined time points (0 min, 5 min, 10 min, 15 min, 20 min, and 30 min). After cDNA synthesis, RT-qPCR was performed to quantify the intragenic eRNA of Nsun2 and Sox2, the intergenic eRNA of Pou5f1, and their corresponding mRNAs. These data were used to generate time-dependent degradation curves (Figure 2).In success...
Access restricted. Please log in or start a trial to view this content.
Discussion
This protocol outlines a reliable and reproducible method for measuring eRNA stability in mESCs. Critical experimental steps, including cell culture, actinomycin D treatment, RNA extraction, and RT-qPCR quantification, are clearly illustrated in the figures and supplementary files to guide users through the workflow. In addition, detailed analytical procedures such as nonlinear regression modeling and interpretation of confidence intervals are provided in Supplementary File 4 to support accurate hal...
Access restricted. Please log in or start a trial to view this content.
Disclosures
The authors declare no conflicts of interest to disclose.
Acknowledgements
This study was supported by the research fund of Chungnam National University [2024-0991-01 (S.-K.K.)]; the Basic Science Research Program [RS-2023-00209842 (S.-K.K.)] and the Bio&Medical Technology Development Program [RS-2025-02305916 (S.-K.K.)] of the National Research Foundation (NRF) funded by the Korean government (MSIT).
Access restricted. Please log in or start a trial to view this content.
Materials
| Name | Company | Catalog Number | Comments |
|---|---|---|---|
| 2-mercaptoethanol | Gibco | 21985023 | |
| Actinomycin D | Sigma-Aldrich | A9415 | |
| chloroform | Daejung chemicals | 2548-4105 | |
| DMSO | GenDEPOT | D2680 | |
| Fetal bovine serum (FBS) | Sigma-Aldrich | F0392 | |
| Gelatin | Sigma-Aldrich | G1890-100G | |
| Glasgow’s Minimum Essential Medium (GMEM) | Gibco | 11710035 | |
| GraphPad Prism (version 9) | GraphPad Software | ||
| isopropanol | Daejung chemicals | 5035-4105 | |
| KnockOut Serum Replacement (KOSR) | Gibco, | 10828028 | |
| Leukemia inhibitory factor (LIF) | Merck | ESG1106 | |
| MEM Non-Essential Amino Acids Solution (MnEA) | Welgene | LS005 | |
| M-MLV cDNA Synthesis Kit | Enzynomics | EZ006S | |
| OPTIZEN NanoQ Plus | KLAB | 01-QI685-M-16-C | |
| Penicillin-streptomycin | Welgene | LS202-02 | |
| Power SYBR-Green PCR master mix | Applied Biosystems | 4368708 | |
| QuanStudio1 Real-Time PCR system | Applied Biosystems | A40425 | |
| Sodium pyruvate | Welgene | LS013 | |
| TRIzol | Invitrogen | 15596018 |
References
- Bulger, M., Groudine, M. Functional and mechanistic diversity of distal transcription enhancers. Cell. 144 (3), 327-339 (2011).
- Gorbovytska, V., et al. Enhancer RNAs stimulate Pol II pause release by harnessing multivalent interactions to NELF. Nat Commun. 13 (1), 2429(2022).
- Joo, J. -Y., Schaukowitch, K., Farbiak, L., Kilaru, G., Kim, T. -K. Stimulus-specific combinatorial functionality of neuronal c-fos enhancers. Nat Neurosci. 19 (1), 75-83 (2016).
- Levine, M. Transcriptional enhancers in animal development anfd evolution. Curr Biol. 20 (17), R754-R763 (2010).
- Nord, A. S., et al. Rapid and pervasive changes in genome-wide enhancer usage during mammalian development. Cell. 155 (7), 1521-1531 (2013).
- Schwalb, B., et al. TT-seq maps the human transient transcriptome. Science. 352 (6290), 1225-1228 (2016).
- De Santa, F., et al. A large fraction of extragenic RNA pol II transcription sites overlap enhancers. PLoS Biol. 8 (5), e1000384(2010).
- Kim, T. -K., et al. Widespread transcription at neuronal activity-regulated enhancers. Nature. 465 (7295), 182-187 (2010).
- Songyue, G., et al. The roles of enhancer, especially super-enhancer-driven genes in tumor metabolism and immunity. Int J Biol Macromol. 308 (1), 142414(2025).
- Kim, S. H., et al. Epigenetic regulation of IFITM1 expression in lipopolysaccharide-stimulated human mesenchymal stromal cells. Stem Cell Res Ther. 11, 1-12 (2020).
- Li, W., Notani, D., Rosenfeld, M. G. Enhancers as non-coding RNA transcription units: Recent insights and future perspectives. Nat Rev Genet. 17 (4), 207-223 (2016).
- Sartorelli, V., Lauberth, S. M. Enhancer RNAs are an important regulatory layer of the epigenome. Nat Struct Mol Biol. 27 (6), 521-528 (2020).
- Lam, M. T., et al. Rev-Erbs repress macrophage gene expression by inhibiting enhancer-directed transcription. Nature. 498 (7455), 511-515 (2013).
- Li, W., et al. Functional roles of enhancer RNAs for oestrogen-dependent transcriptional activation. Nature. 498 (7455), 516-520 (2013).
- Melo, C. A., et al. eRNAs are required for p53-dependent enhancer activity and gene transcription. Mol Cell. 49 (3), 524-535 (2013).
- Mousavi, K., et al. eRNAs promote transcription by establishing chromatin accessibility at defined genomic loci. Mol Cell. 51 (5), 606-617 (2013).
- Schaukowitch, K., et al. Enhancer RNA facilitates NELF release from immediate early genes. Mol Cell. 56 (1), 29-42 (2014).
- Göttgens, B., et al. Establishing the transcriptional programme for blood: The SCL stem cell enhancer is regulated by a multiprotein complex containing Ets and GATA factors. The EMBO J. 21 (12), 3039-3050 (2002).
- Wang, H. F., et al. Defining essential enhancers for pluripotent stem cells using a features-oriented CRISPR-Cas9 screen. Cell Rep. 33 (4), 108309(2020).
- Cinghu, S., et al. Intragenic enhancers attenuate host gene expression. Mol Cell. 68 (1), 104-117.e106 (2017).
- Hobson, D. J., Wei, W., Steinmetz, L. M., Svejstrup, J. Q. RNA polymerase II collision interrupts convergent transcription. Mol Cell. 48 (3), 365-374 (2012).
- Moon, J., et al. Embryonic stem cell-specific intragenic enhancer RNA essential for NSUN2-mediated stem cell fate regulation. Int J Biol Macromol. 319, 145470(2025).
- Tata, P. R., Tata, N. R., Kühl, M., Sirbu, I. O. Identification of a novel epigenetic regulatory region within the pluripotency associated microRNA cluster, EEmiRC. Nucleic Acids Res. 39 (9), 3574-3581 (2011).
- Sohni, A., et al. Dynamic switching of active promoter and enhancer domains regulates Tet1 and Tet2 expression during cell state transitions between pluripotency and differentiation. Mol Cell Biol. 35 (6), 1026-1042 (2015).
- Borsari, B., et al. Enhancers with tissue-specific activity are enriched in intronic regions. Genome Res. 31 (8), 1325-1336 (2021).
- Bressin, A., et al. High-sensitive nascent transcript sequencing reveals BRD4-specific control of widespread enhancer and target gene transcription. Nat Commun. 14 (1), 4971(2023).
- Heintzman, N. D., et al. Distinct and predictive chromatin signatures of transcriptional promoters and enhancers in the human genome. Nat Genet. 39 (3), 311-318 (2007).
- Pérez-Molina, R., et al. An intronic Alu element attenuates the transcription of a long non-coding RNA in human cell lines. Front Genet. 11, 928(2020).
- Djebali, S., et al. Landscape of transcription in human cells. Nature. 489 (7414), 101-108 (2012).
- Rada-Iglesias, A., et al. A unique chromatin signature uncovers early developmental enhancers in humans. Nature. 470 (7333), 279-283 (2011).
- Atlasi, Y., Stunnenberg, H. G. The interplay of epigenetic marks during stem cell differentiation and development. Nat Rev Genet. 18 (11), 643-658 (2017).
- Young, R. A. Control of the embryonic stem cell state. Cell. 144 (6), 940-954 (2011).
- Ratnadiwakara, M., Änkö, M. -L. mRNA stability assay using transcription inhibition by actinomycin D in mouse pluripotent stem cells. Bio Protoc. 8 (21), e3072-e3072 (2018).
- Kim, S. -K., et al. Functional coordination of BET family proteins underlies altered transcription associated with memory impairment in fragile X syndrome. Sci Adv. 7 (21), eabf7346(2021).
- Peterson, S. M., Freeman, J. L. RNA Isolation from Embryonic Zebrafish and cDNA Synthesis for Gene Expression Analysis. J Vis Exp. (30), e1470(2009).
- Ye, J., et al. Primer-BLAST: A tool to design target-specific primers for polymerase chain reaction. BMC Bioinformatics. 13 (1), 134(2012).
- Kim, S. -K., et al. SET7/9 methylation of the pluripotency factor LIN28A is a nucleolar localization mechanism that blocks let-7 biogenesis in human ESCs. Cell Stem Cell. 15 (6), 735-749 (2014).
- Lugowski, A., Nicholson, B., Rissland, O. S. DRUID: A pipeline for transcriptome-wide measurements of mRNA stability. RNA. 24 (5), 623-632 (2018).
- Lugowski, A., Nicholson, B., Rissland, O. S. Determining mRNA half-lives on a transcriptome-wide scale. Methods. 137, 90-98 (2018).
- Tsai, P. F., et al. A muscle-specific enhancer rna mediates cohesin recruitment and regulates transcription in trans. Mol Cell. 71 (1), 129-141.e128 (2018).
- Woolley, C. R., et al. Full-length mRNA sequencing resolves novel variation in 5' UTR length for genes expressed during human CD4 T-cell activation. Immunogenetics. 77 (1), 14(2025).
- Zhang, H., et al. Algorithm for optimized mRNA design improves stability and immunogenicity. Nature. 621 (7978), 396-403 (2023).
- Kim, T. -K., Shiekhattar, R. Architectural and functional commonalities between enhancers and promoters. Cell. 162 (5), 948-959 (2015).
Access restricted. Please log in or start a trial to view this content.
Reprints and Permissions
