Method Article

Localization of Plasma Membrane and Intracellular Neuronal Nicotinic Acetylcholine Receptors Using Quantitative Imaging in Mammalian Cells

DOI:

10.3791/69371

December 19th, 2025

In This Article

Summary

Loading...
$$\rightleftharpoonup{xx}$$ $$\longleftharp{xx}$$, $$\longrightharp{xx}$$,

This protocol describes expression and quantification of neuronal nicotinic acetylcholine receptors subunits using the mammalian Neuro-2a cell line. pH-sensitive fluorescent tags and confocal microscopy enable precise evaluation of receptor localization at the plasma membrane versus those expressed in pH-neutral intracellular compartments, facilitating the study of nAChR trafficking and pharmacological modulation.

Abstract

Loading...
$$\rightleftharpoonup{xx}$$ $$\longleftharp{xx}$$, $$\longrightharp{xx}$$,

Quantification of neuronal nicotinic acetylcholine receptors (nAChRs) expressed on the plasma membrane of mammalian cells is important for the development of novel target-selective therapeutics and for studying chaperone proteins that modulate receptor trafficking. This study presents a robust set of methodologies to express both homomeric and heteromeric nAChRs in mammalian Neuro2a (N2a) cells and to quantify their surface versus intracellular localization using pH-sensitive fluorescent tags. pHuji and superecliptic pHluorin (SEP) are pH-sensitive proteins that can be engineered to tag recombinant proteins, allowing visualization of the spatial distribution of nAChR subunits. These fluorescent tags emit at neutral pH but are quenched in acidic environments. To track the relative internal versus plasma membrane localization of α7, α4, and β2 nAChR subunits, either pHuji or SEP is attached to the C-terminus of each DNA construct. To express α7-pHuji together with its chaperone NACHO, or (α4-SEP; β2-pHuji) in N2a cells, a lipid-based DNA transfection reagent is used. The transfection reagent and plasmid DNA are incubated separately in reduced-serum medium at room temperature, then combined to form lipid-DNA complexes that facilitate plasmid delivery into cells. Following incubation, cells are imaged using live-cell confocal microscopy under both high- and low-pH conditions or in the presence of a subtype-selective fluorescent ligand. Images are analyzed using corrected total cell fluorescence in the relevant fluorophore channels, providing quantitative information on the distribution of fluorescently tagged nAChR subunits between the plasma membrane and intracellular compartments. Live-cell confocal imaging enables real-time tracking of nAChR subunit localization to distinguish differences between internal and surface receptor populations. Robust plasma membrane expression of α7-pHuji or (α4-SEP; β2-pHuji) is achieved within 24 h at 37 °C. This method can be adapted to include additional chaperones, auxiliary subunits, or fluorescent ligands for the study of nAChR trafficking, pharmacological modulation, and disease-related alterations in nAChR expression.

Introduction

Loading...
$$\rightleftharpoonup{xx}$$ $$\longleftharp{xx}$$, $$\longrightharp{xx}$$,

Neuronal nicotinic acetylcholine receptors (nAChRs) are ligand-gated transmembrane ion channels expressed on the plasma membrane of many cell types, including neurons, glial cells, and immune cells. These receptors are composed of α (α2-α10) or β (β2-β4) subunits that assemble to form homomeric or heteromeric subtypes, with α7 and α4β2 nAChRs being the most abundant within the brain1,2. Dysregulation of these subtypes has been associated with Alzheimer's disease, nicotine use disorder, sleep-related hypermotor epilepsy, Parkinson's disease, and major depressive disorder, among other neurological and psychiatric conditions3,4,5,6,7,8,9,10,11,12. Rapid and reliable methods to express and quantify nAChRs are essential for understanding disease mechanisms and for developing target-selective therapeutics. However, achieving robust plasma membrane expression of these receptors is often challenging and time-consuming. The method described here enables strong surface expression of nAChRs within approximately 24 h after DNA transfection and can be combined with ligands or chaperone proteins that modulate receptor trafficking.

Several approaches exist for expressing nAChRs, including transient DNA transfection or the generation of stable cell lines that express the desired subtype. Although creating stable cell lines is useful for long-term studies involving the same receptor subtype, the process is labor-intensive and can require several months. Once established, such cell lines may exhibit variable receptor expression across passages, loss of expression over time, or selection bias for clones with suboptimal receptor function or density13. A reduction in incubation temperature from 37 °C to 30 °C, the addition of molecular chaperones such as nicotine, or extended incubation time can promote surface expression13,14,15. These limitations are particularly pronounced for heteromeric nAChRs, which require proper subunit assembly and trafficking, and for studies focusing on chaperone-assisted receptor regulation. Therefore, routine validation of receptor subtype expression across passages is necessary when working with stable nAChR-expressing cell lines.

Often, researchers are interested in nAChR subunit variants and chaperone or auxiliary protein subunits and thus need to express a variety of DNAs in quick succession to allow for rapid flexibility in their assays. Transient expression of nAChRs is advantageous in this regard because the process can be completed rapidly, allowing the researcher to study multiple receptor subtypes or experimental conditions without waiting months to generate stable cell lines. A common occurrence, even with transient expression, is that many nAChRs remain inside the cell 24 h after induction at 37 °C, requiring additional incubation periods of > 48 h16,17. For example, without the chaperone protein resistant to inhibitors of cholinesterase (RIC)-3, only ~1% of α7 nAChRs are expressed on the plasma membrane of mammalian SHE-P cells18. With co-expression of RIC-3, approximately 20% of α7 nAChRs are detected on the surface. While this represents an improvement, total receptor abundance remains low. Co-expression of α7 nAChRs with NACHO can further enhance surface expression, though still less than 40% of the total receptor population traffics to the plasma membrane19. Another approach involves incubating transfected cells at 30 °C to improve plasma membrane expression20,21. For α4β2 nAChRs, this temperature reduction yields a fivefold upregulation in surface receptor density with no corresponding increase in total subunit protein21. However, this improvement requires at least one additional day and greater use of consumables, reagents, and instrumentation.

The presented work offers a set of optimized methods to express and quantify specific nAChR subtypes within 24 h post-transfection in mammalian N2a cells, achieving approximately 83% for α7, 77% for α4, and 56% for β2 subunits localized to the plasma membrane. In the case of α7 nAChRs, plasma membrane expression can be quantified using α7-selective fluorescently labeled α-bungarotoxin (αBTX) or through recombinant fluorescent tagging. To label each subunit, the pH-sensitive fluorescent proteins pHuji and superecliptic pHluorin (SEP)22,23,24 are engineered onto the C-terminus of individual nAChR subunits25,26. pHuji and SEP are pH-sensitive variants of red and green fluorescent proteins, respectively, that fluoresce at pH 7.4 but are quenched under more acidic conditions27,28. As SEP and pHuji fluorescence is suppressed at pH < 6, any observed intracellular signal reflects fluorophores located in neutral compartments rather than on the plasma membrane. It should be noted that some organelles, such as the Golgi apparatus, have an acidic lumen; thus, fluorophores attached to the C-terminal region of nAChR subunits are not detected while subunits transit through the secretory pathway29. The difference between total fluorescence at pH 7.5 and that at pH < 6 represents the signal generated by nAChRs located on the plasma membrane. Capturing images using live-cell confocal microscopy provides high spatial resolution, enabling precise quantification of subunit localization. Additionally, performing all experiments on live cells allows each cell to serve as its own control, accounting for variability in protein expression between cells within each treatment group30. This method can be further adapted to include additional chaperone proteins, such as NACHO or others, to investigate nAChR trafficking. Additional applications include pharmacological modulation, incorporation of auxiliary subunits, and analysis of disease-associated changes in nAChR expression.

Access restricted. Please log in or start a trial to view this content.

Protocol

Loading...
$$\rightleftharpoonup{xx}$$ $$\longleftharp{xx}$$, $$\longrightharp{xx}$$,

NOTE: The following procedure describes methods that have been used successfully to transiently transfect the N2a cell line with nAChR subunits (Figure 1). Robust plasma membrane expression is achieved within 24 h, as captured with live-cell confocal microscopy.
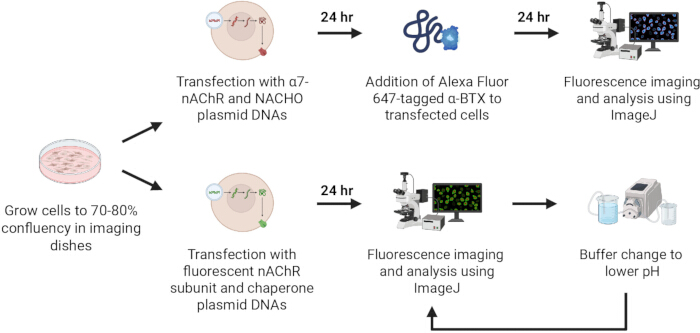
Cell transfection process diagram with fluorescence imaging, using α7-nAChR DNA and ImageJ analysis.
Figure 1: Schematic presentation of the individual methods presented in the protocol. Cells are grown until they are 70%-80% confluent in imaging dishes. The cells are then treated with the transfection reagent and the DNA complex. (Top) 24 h later, cells can be treated with a fluorescently tagged ligand to label subunits expressed on the plasma membrane and then imaged using a confocal microscope. (Bottom) Alternatively, for nAChR subunit genes that have been modified to be tagged with a pH-sensitive protein 24 h after transfection, cells can be imaged alive using a confocal microscope to capture the total fluorescence of the cells. The pH 7.4 imaging buffer is then changed to the pH 5.5 quenching buffer. This will stop the fluorescence of the pH-sensitive proteins tagged to the nAChR subunits located on the plasma membrane of the cell, allowing for only the internal subunits to remain fluorescent. The same cells are again imaged. Image analysis is performed using ImageJ to quantify the expression of internal and external subunits. These procedures can be modified to incorporate chaperone and auxiliary proteins. Created in BioRender. Please click here to view a larger version of this figure.

1. N2a nAChR transient transfection

NOTE: The N2a cell line was chosen because it exhibits a neuronal phenotype and low endogenous expression of nAChRs. The α7-pHuji, α4-SEP, and β2-pHuji subunit genes are each housed individually in the mammalian pcDNA3.1(+) expression vector. The chaperone protein NACHO is expressed from pREP9 (generously gifted by Dr. R. Loring, Northeastern University). In all steps, use sterile techniques and work inside a biosafety cabinet. Wear a clean laboratory coat, safety glasses, and gloves. Clean all materials entering or leaving the biosafety cabinet with 70% ethanol. The following steps describe transfection in a 35 mm poly-D-lysine-coated glass-bottom dish, which is suitable for imaging. Volumes may be adjusted as needed for different culture vessels.

  1. Culture N2a cells in a T25 (or similar) tissue culture flask containing Eagle's Minimum Essential Medium (EMEM) supplemented with 10% fetal bovine serum (FBS) and, if required, 100 U/mL penicillin and 100 µg/mL streptomycin. Incubate at 37 °C, 5% CO₂ until cells reach ~90% confluency. Visualize using a 4x light-microscope objective.
  2. Monitor confluency daily using a light microscope and replace the growth medium every 1-2 days to maintain optimal conditions. When cells reach ~90% confluency, they are ready to be passaged into imaging dishes.
  3. Prewarm all reagents to 37 °C in a water bath. Clean the biosafety cabinet and all materials with 70% ethanol before beginning the procedure.
    CAUTION: 70% ethanol is a highly flammable liquid and vapor that can cause serious eye irritation. Keep away from heat, sparks, open flames, and other ignition sources. Store in a well-ventilated area with containers tightly closed. Wear protective gloves and eye/face protection when handling. In case of contact with skin or eyes, rinse immediately with water and seek medical attention if irritation persists. An alternative disinfectant, such as a 5%-10% bleach solution, may be used instead.
  4. Aspirate the old medium from the flask and wash cells with 5 mL of PBS. Add 1 mL of trypsin to the flask and gently swirl. Incubate until cells lift (<5 min). To prevent over-digestion, immediately add 4 mL of EMEM growth medium and gently pipette to create a single-cell suspension.
  5. Using a hemocytometer, determine the cell concentration and calculate the required volume of EMEM growth medium to adjust the suspension so that 1 mL contains 0.5-2 x 10⁵ cells.
  6. Plate 1 mL of cell suspension per 35 mm dish and add enough EMEM growth medium to bring the total volume to 2 mL. Incubate overnight at 37 °C, 5% CO₂. Cells are ready for transfection at 70%-80% confluency.
  7. On the day of transfection, prewarm reagents to 37 °C, thaw nAChR subunit DNAs completely, and bring the transfection reagent to room temperature. Clean all reagents with 70% ethanol before placing them in the biosafety cabinet.
  8. To express α7 nAChRs: In a microcentrifuge tube, dilute 4 µg of α7 (1 µg/µL) and 1 µg of NACHO (1 µg/µL) plasmid DNAs dropwise into reduced serum medium (no antibiotic) to a final volume of 250 µL. Mix gently by pipetting after DNA addition.
    1. To express α4β2 nAChRs: Dilute 4 µg of each subunit DNA in a total of 250 µL of reduced serum medium. Mix gently by pipetting. Adjust the ratio of each subunit to optimize expression of specific receptor isoforms.
    2. To express α4β2 nAChRs with an additional plasmid, add equal amounts of each plasmid DNA. The blue fluorescent protein mTagBFP2³¹ in pcDNA3.1(+) serves as a control plasmid and can be replaced with any α4β2 chaperone.
  9. Gently mix the DNA transfection reagent before use. In a separate microcentrifuge tube, dilute 8 µL of transfection reagent dropwise in 250 µL of reduced serum medium. Incubate for 5 min at room temperature. Proceed to the next step within 25 min.
  10. After 5 min, combine the diluted DNAs with the diluted transfection reagent (total = 500 µL) dropwise. Mix gently by pipetting and incubate for 20 min at room temperature. DNA-lipid complexes remain stable for up to 6 h.
  11. While the complexes form, remove culture dishes from the incubator and replace the medium with 1 mL of serum-free EMEM (no antibiotics).
  12. Add 500 µL of the DNA-transfection reagent complex dropwise to each dish (final volume = 1.5 mL). Mix gently by rocking the plate to ensure even distribution across the dish, particularly over the glass-bottom surface. Incubate at 37 °C for 24 h, then replace the medium after 4-6 h to promote cell health.

2. Live cell labeling of plasma membrane-expressed α7 nAChRs using αBTX Alexa Fluor 647

NOTE: The following procedure is generally performed 24 h after transfection. Protect αBTX Alexa Fluor 647 (αBTX-AF647) from light to prevent photodestruction of the fluorophore.

  1. Prewarm all reagents to 37 °C and thaw the αBTX-AF647 stock (2.3 µM) solution. Clean with 70% ethanol and place in the biosafety cabinet.
  2. Retrieve the dish containing the cells transfected with α7 and NACHO DNAs from the incubator, clean the outside with 70% ethanol, and place it in the biosafety cabinet.
  3. Discard the old medium by vacuum suction. To wash the cells, add 2 mL of fresh EMEM growth medium.
  4. Remove the wash medium by vacuum suction. Add 2 mL of EMEM growth medium to the dishes.
  5. Replace the appropriate amount of medium with αBTX-AF647 to achieve a final concentration of 80 nM. Incubate overnight at 37 °C.
  6. In the morning, prewarm PBS or a preferred imaging medium and clean with 70% ethanol. Transfer to the biosafety cabinet.
  7. Remove transfected cells from the incubator, clean, and place them in the biosafety cabinet.
  8. Remove the old medium containing αBTX-AF647 and place it in an appropriate waste container.
  9. Wash cells with 2 mL of PBS for 3x, 10 min each at room temperature. The rinses remove unbound ligand and debris, and the time can be modified to meet the researcher's needs. Remove PBS after each wash.
  10. Add 2 mL of PBS or a preferred imaging medium and proceed to image cells using a confocal microscope.

3. Live-cell imaging of total and internal α7-pHuji nAChRs

NOTE: The following procedure uses an in-house-made α7-pHuji pcDNA3.1 plasmid co-transfected with the NACHO chaperone. A similar protocol was used to express α4-SEP and β2-pHuji in pcDNA3.1 with the control plasmid mTagBFP2 pcDNA3.1, as described in the Results section. Protect samples from light throughout the procedure to prevent photodestruction of the fluorophore.

  1. Prepare pH 7.4 imaging buffer (Table 1) and pH 5.5 quenching buffer (Table 2) as described23.
  2. Prewarm reagents to 37 °C, clean with 70% ethanol, and transfer to the biosafety cabinet. Remove the transfected cells from the incubator, clean with 70% ethanol, and place them in the biosafety cabinet.
  3. Remove the old medium by suction. Rinse the dish with 2 mL PBS for 3x, 10 min each at room temperature. Add 2 mL of pH 7.4 imaging buffer.
  4. Bring the dish to the confocal microscope. Insert the imaging dish with pH 7.4 imaging buffer into the slide holder and place the holder into the prewarmed environmental chamber on the confocal microscope.
  5. Connect the peristaltic pump tubing to the imaging dish holder and close the chamber.
  6. Open the imaging software and select lasers for the fluorophores of interest (pHuji 566/598 nm, α4-SEP 499/520 nm, β2-pHuji 568/603 nm, and mTagBFP2 359/461 nm).
  7. Scan the dish to locate cells for imaging using a 10x-60x objective. Increase magnification if desired and adjust focus depth as needed.
  8. Adjust laser intensity and detector sensitivity to visualize the fluorescence without a background signal. Adjust the aperture to increase the fluorescence signal, if required.
  9. Select the preferred resolution and capture the single image using the desired objective (e.g., 60x).
  10. Record the location on the dish map to relocate the same cells following the buffer change to pH 5.5 quenching buffer.
  11. Repeat the imaging process for several areas on the dish, recording each new location. Use the same capture settings for all images (experimental and control groups) to enable valid comparisons.
  12. Keeping only the outlet line connected to the peristaltic pump, slowly suction out the pH 7.4 buffer from the dish into a waste container.
  13. When most of the buffer is removed (without drying cells), transfer the inlet line to the pH 5.5 quenching buffer.
  14. Turn on the peristaltic pump to add pH 5.5 buffer slowly (1.5 mL/min) to the dish, ensuring cells remain attached.
  15. Run the pump for 20 min, observing that the buffer flows correctly into and out of the dish.
  16. Turn off the pump and incubate the cells with the pH 5.5 quenching buffer for an additional 20 min to allow equilibration.
  17. To repeat imaging, load the saved locations from the previous session to return to the same regions.
  18. Confirm that focal depth and position are correct, as they may shift after buffer exchange.
  19. Repeat imaging at all saved locations using the pH-quenched condition.
ReagentConcentration (mM)
NaCl135
KCl5
MgCl21.8
HEPES20
d-glucose1
Adjust solution to pH 7.4

Table 1: Imaging buffer recipe. The following reagents were added together, and the solution was adjusted to pH 7.4.

ReagentConcentration (mM)
NaCl135
KCl5
MgCl20.4
CaCl21.8
MES20
d-glucose1
Adjust solution to pH 5.5

Table 2: Quenching buffer recipe. The following reagents were mixed together, and the resulting solution was adjusted to a pH of 5.5.

4. Image quantification

NOTE: This procedure explains how to analyze cell images using ImageJ (National Institutes of Health, Bethesda, MD) and the corrected total cell fluorescence (CTCF) method32.

  1. Open ImageJ and open the image to be analyzed. The image will appear as a stack with each captured channel separated within the same frame.
  2. Navigate to the Phase channel. If the image is overly bright (common for blank or background regions), select Process > Enhance Contrast, then click OK.
  3. Using the magnifying glass tool, zoom in (+) on one cell. Using the Freehand selection tool, trace the outline of the cell in the Phase channel.
  4. Switch to the fluorescent channel corresponding to the fluorophore of interest. Set up the desired measurements by selecting Analyze > Set Measurements. Ensure that Area, Mean Gray Value, and Integrated Density are checked.
  5. To measure the selected region, choose Analyze > Measure or press Command + M (Mac) / Ctrl + M (Windows).
  6. Take three background measurements by tracing empty areas near the cell. Repeat steps for the desired number of cells.
  7. Measurement data will appear in a separate Results window in ImageJ. Copy and paste these data into Excel for analysis.
  8. Calculate the average background mean from the three background measurements.
  9. Compute the CTCF value for each cell using the following formula:
    CTCF=Integrated density−(Area of cell x Mean background fluorescence)
  10. Repeat this process for multiple cells and images for each experimental group (and pH condition, if applicable). Export all results to a data analysis software for statistical processing.

Access restricted. Please log in or start a trial to view this content.

Results

Loading...
$$\rightleftharpoonup{xx}$$ $$\longleftharp{xx}$$, $$\longrightharp{xx}$$,

Following the above transfection procedures, α7 nAChRs and the NACHO chaperone protein were co-expressed in N2a cells. Both non-transfected and transfected cells were labeled with αBTX-AF647 24 h post-DNA transfection. Because αBTX is not membrane-permeable, all fluorescence detected originates from receptors present on the plasma membrane. In Figure 2A,A′, weak αBTX-AF647 staining was observed in non-transfected N2a cells, as expected. N2a cells endogenously express a small...

Access restricted. Please log in or start a trial to view this content.

Discussion

Loading...
$$\rightleftharpoonup{xx}$$ $$\longleftharp{xx}$$, $$\longrightharp{xx}$$,

The methodologies presented for expressing and quantifying nAChR subunits in mammalian N2a cells address long-standing challenges in achieving rapid (~24 h) and abundant nAChR (> 60%) plasma membrane expression for drug discovery, localization, and trafficking studies. A key strength of this set of protocols is its adaptability for both homomeric (α7) and heteromeric (α4β2) nAChRs, and it is likely applicable to other nAChR subtypes, along with the co-expression of chaperone proteins. By leveraging pH-...

Access restricted. Please log in or start a trial to view this content.

Disclosures

Loading...
$$\rightleftharpoonup{xx}$$ $$\longleftharp{xx}$$, $$\longrightharp{xx}$$,

The authors have nothing to disclose.

Acknowledgements

Loading...
$$\rightleftharpoonup{xx}$$ $$\longleftharp{xx}$$, $$\longrightharp{xx}$$,

The authors would like to thank James Janoso for his technical microscopy expertise and the Center for Transformative Research in Metabolism (National Institute of General Medical Sciences of the National Institutes of Health under Award Number P20GM130443) for supporting the Microscopy Core at the University of Alaska Fairbanks. LW's efforts were partially supported by funding from the Higher Education Investment Fund, provided by the state of Alaska through the University of Alaska. SMS's efforts were supported by the Institutional Development Award (IDeA) from the National Institute of General Medical Sciences of the National Institutes of Health under grant number P20GM103395. Research reported in this publication was supported by the National Institute of Mental Health of the National Institutes of Health (MMW by award number R03MH135358) and the National Institute of General Medical Sciences (MMW by award number R16GM150455) of the National Institutes of Health.

Access restricted. Please log in or start a trial to view this content.

Materials

List of materials used in this article
NameCompanyCatalog NumberComments
0.25% Trypsin-EDTA (1X) Gibco25200-056Cell detachment reagent
Alpha-Bungarotoxin Alexa Fluor 647InvitrogenB35450Alpha-Bungarotoxin conjugate
BSL-level 1 Biosafety Cabinet NuaireNU-425-400Sterile cell culture working area
Calcium chlorideAventor/VWRBDH9224Buffer component
D-(+)-GlucoseMilliPore Sigma G8270Buffer component
EMEM with L-glutamineATCC30-2003Cell medium
Endotoxin-free DNAMade in house using Zymo kitsnot applicablenAChR DNAs to be used for cell transient transfections
Endotoxin-free microcentrifuge tubes, 0.5 mL Aventor/VWR89000-010DNA and transfection preparation
Endotoxin-free microcentrifuge tubes, 1.5 mL Aventor/VWR20170-038DNA and transfection preparation
Fetal Bovine SerumAventor/VWR97068-085Serum supplement
Fluoview FV10iOlympusFV10iConfocal Microscope
Glass Bottom MatTek DishesMatTekP35GC-0-10-CImaging dishes
GraphPad Prism v. 10GraphPad Prismhttps://www.graphpad.com/featuresData analysis software
HEPESMilliPore Sigma H3375Buffer component
Lipofectamine 2000Invitrogen11668019Transfection reagent
Magnesium chloride hexahydrateThermo scientific413410025Buffer component
MES hydrateMilliPore Sigma M5287Buffer component
mTagBFP2-pBADAddGene 54572Control DNA to be used for cell transient transfection 
Neuro 2 a (N2a) cellsAmerican Type Culture CollectionCCL-131Cells used for DNA transfections and nAChR expression
Opti-MEMGibco31985-070Reduced serum medium
Penicillin/StreptomycinAventor/VWRK952-100mLAntibiotic
Peristalsis pumpGilsonMiniPuls3Buffer changes when imaging 
Phosphate-buffered salineQuality Biological119-069-131Saline buffer
Pipet AidDrummond 140084Precise liquid transfer
Pipet tips (sterile and endotoxin-free, 1000uL)Rainin30389216Precise liquid transfer
Pipet tips (sterile and endotoxin-free, 20uL)Rainin30389229Precise liquid transfer
Pipet tips (sterile and endotoxin-free, 250uL )Rainin30389246Precise liquid transfer
Pipettes, P10Rainin L-10XLSPrecise liquid transfer
Pipettes, P100Rainin L-100XLSPrecise liquid transfer
Pipettes, P1000Rainin L-1000XLSPrecise liquid transfer
Potassium chlorideMilliPore Sigma P3911Buffer component
Serological pipets (sterile and endotoxin-free, 10 ML )Aventor/VWR89130-898Precise liquid transfer
Serological pipets (sterile and endotoxin-free, 25 mL )Aventor/VWR89130-900Precise liquid transfer
Serological pipets (sterile and endotoxin-free, 5 mL )Aventor/VWR76201-710Precise liquid transfer
Serological pipets (sterile and endotoxin-free, 50 mL )Aventor/VWR75816-088Precise liquid transfer
Sodium chlorideAventor/VWRBDH9286Buffer component
Tissue Culture FlaskFalcon353109Growing dishes
ZymoPure II Plasmid Maxiprep KitZYMO RESEARCHD4203-A + D4203-BProduction of endotoxin-free DNA
α4-SEP ThermoFisher Scientific GeneArt Gene Synthesis Services  https://www.thermofisher.com/us/en/home/life-science/cloning/c-misc/geneart.htmlCustom gene synthesis services
α7-pHujiTwist Biosciencehttps://www.twistbioscience.com/Custom gene synthesis services
β2-pHujiThermoFisher Scientific GeneArt Gene Synthesis Services  https://www.thermofisher.com/us/en/home/life-science/cloning/c-misc/geneart.htmlCustom gene synthesis services

References

Loading...
$$\rightleftharpoonup{xx}$$ $$\longleftharp{xx}$$, $$\longrightharp{xx}$$,
  1. Whiting, P. J., et al. Expression of nicotinic acetylcholine receptor subtypes in brain and retina. Mol Brain Res. 10 (1), 61-70 (1991).
  2. Albuquerque, E. X., et al. Nicotinic Receptor Function in the Mammalian Central Nervous System. Ann New York Acad Sci. 757 (1), 48-72 (1995).
  3. Picard, F., et al. Alteration of the in vivo nicotinic receptor density in ADNFLE patients: a PET study. Brain. 129 (8), 2047-2060 (2006).
  4. Breese, C. Abnormal Regulation of High Affinity Nicotinic Receptors in Subjects with Schizophrenia. Neuropsychopharmacology. 23 (4), 351-364 (2000).
  5. De Luca, V., Voineskos, S., Wong, G., Kennedy, J. L. Genetic interaction between α4 and β2 subunits of high affinity nicotinic receptor: analysis in schizophrenia. Exp Brain Res. 174 (2), 292-296 (2006).
  6. Maskos, U., et al. Nicotine reinforcement and cognition restored by targeted expression of nicotinic receptors. Nature. 436 (7047), 103-107 (2005).
  7. Picciotto, M. R., et al. Acetylcholine receptors containing the β2 subunit are involved in the reinforcing properties of nicotine. Nature. 391 (6663), 173-177 (1998).
  8. Staley, J. K. Human Tobacco Smokers in Early Abstinence Have Higher Levels of β2 Nicotinic Acetylcholine Receptors than Nonsmokers. J Neurosci. 26 (34), 8707-8714 (2006).
  9. Gotti, C., Zoli, M., Clementi, F. Brain nicotinic acetylcholine receptors: native subtypes and their relevance. Trends Pharmacol Sci. 27 (9), 482-491 (2006).
  10. Mineur, Y. S., Mose, T. N., Blakeman, S., Picciotto, M. R. Hippocampal α7 nicotinic ACh receptors contribute to modulation of depression-like behaviour in C57BL/6J mice. British J Pharmacol. 175 (11), 1903-1914 (2018).
  11. Fernandes, S. S., et al. Enhanced cholinergic-tone during the stress induce a depressive-like state in mice. Behav Brain Res. 347, 17-25 (2018).
  12. Ren, J. M., Zhang, S. L., Wang, X. L., Guan, Z. Z., Qi, X. L. Expression levels of the α7 nicotinic acetylcholine receptor in the brains of patients with Alzheimer's disease and their effect on synaptic proteins in SH-SY5Y cells. Mol Med Rep. 22 (3), 2063-2075 (2020).
  13. Letchworth, S. R., Whiteaker, P. Progress and Challenges in the Study of α6-Containing Nicotinic Acetylcholine Receptors. Biochem Pharmacol. 82 (8), 862-872 (2011).
  14. Nelson, M. E., et al. Functional Properties of Human Nicotinic Achrs Expressed by Imr-32 Neuroblastoma Cells Resemble Those of α3β4 Achrs Expressed in Permanently Transfected Hek Cells. J General Physiol. 118 (5), 563-582 (2001).
  15. Cooper, S. T., Harkness, P. C., Baker, E. R., Millar, N. S. Up-regulation of Cell-surface α4β2 Neuronal Nicotinic Receptors by Lower Temperature and Expression of Chimeric Subunits *. J Biol Chem. 274 (38), 27145-27152 (1999).
  16. Harkness, P. C., Millar, N. S. Inefficient cell-surface expression of hybrid complexes formed by the co-assembly of neuronal nicotinic acetylcholine receptor and serotonin receptor subunits. Neuropharmacology. 41 (1), 79-87 (2001).
  17. Dhara, M. Polyamine regulation of ion channel assembly and implications for nicotinic acetylcholine receptor pharmacology. Nat Commun. 11 (1), (2020).
  18. Vallés, A. S., Roccamo, A. M., Barrantes, F. J. Ric-3 chaperone-mediated stable cell-surface expression of the neuronal α7 nicotinic acetylcholine receptor in mammalian cells. Acta Pharmacol Sinica. 30 (6), 818-827 (2009).
  19. Dawe, G. B., et al. α7 nicotinic acetylcholine receptor upregulation by anti-apoptotic Bcl-2 proteins. Nat Comm. 10 (1), (2019).
  20. Peng, J. H., et al. Inducible, heterologous expression of human α7-nicotinic acetylcholine receptors in a native nicotinic receptor-null human clonal line. Brain Res. 825 (1-2), 172-179 (1999).
  21. Cooper, S. T., Harkness, P. C., Baker, E. R., Millar, N. S. Up-regulation of Cell-surface α4β2 Neuronal Nicotinic Receptors by Lower Temperature and Expression of Chimeric Subunits. J Biol Chem. 274 (38), 27145-27152 (1999).
  22. Richards, C. I., et al. Trafficking of α4* Nicotinic Receptors Revealed by Superecliptic Phluorin. J Biol Chem. 286 (36), 31241-31249 (2011).
  23. Shen, Y., Rosendale, M., Campbell, R. E., Perrais, D. pHuji, a pH-sensitive red fluorescent protein for imaging of exo- and endocytosis. J Cell Biol. 207 (3), 419-432 (2014).
  24. Miesenböck, G., De Angelis, D. A., Rothman, J. E. Visualizing secretion and synaptic transmission with pH-sensitive green fluorescent proteins. Nature. 394 (6689), 192-195 (1998).
  25. O'Brien, B. C. V., Weber, L., Hueffer, K., Weltzin, M. M. SARS-CoV-2 spike ectodomain targets α7 nicotinic acetylcholine receptors. J Biol Chem. 299 (5), 104707(2023).
  26. O'Brien, B. C. V., et al. The human alpha7 nicotinic acetylcholine receptor is a host target for the rabies virus glycoprotein. Front Cell Infect Microbiol. 14, (2024).
  27. Shen, Y., Rosendale, M., Campbell, R. E., Perrais, D. pHuji, a pH-sensitive red fluorescent protein for imaging of exo- and endocytosis. J Cell Biol. 207 (3), 419-432 (2014).
  28. Sankaranarayanan, S., Angelis, D. D., Rothman, J. E., Ryan, T. A. The Use of pHluorins for Optical Measurements of Presynaptic Activity. Biophy J. 79 (4), 2199-2208 (2000).
  29. Henderson, B. J., et al. Nicotine exploits a COPI-mediated process for chaperone-mediated up-regulation of its receptors. J General Physiol. 143 (1), 51-66 (2013).
  30. Nichols, W. A., et al. Lynx1 Shifts α4β2 Nicotinic Receptor Subunit Stoichiometry by Affecting Assembly in the Endoplasmic Reticulum. J Biol Chem. 289 (45), 31423-31432 (2014).
  31. Subach, O. M., Cranfill, P. J., Davidson, M. W., Verkhusha, V. V. An Enhanced Monomeric Blue Fluorescent Protein with the High Chemical Stability of the Chromophore. PLoS One. 6 (12), e28674(2011).
  32. Fitzpatrick, M. Measuring cell fluorescence using ImageJ. , http://theolb.readthedocs.io/en/latest/imaging/measuring-cell-fluorescence-using-imagej.html#measuring-cell-fluorescence-using-imagej (2025).
  33. Srinivasan, R., et al. Nicotine up-regulates α4β2 nicotinic receptors and ER exit sites via stoichiometry-dependent chaperoning. J Gen Physiol. 137 (1), 59-79 (2011).
  34. Subach, O. M., Cranfill, P. J., Davidson, M. W., Verkhusha, V. V. An Enhanced Monomeric Blue Fluorescent Protein with the High Chemical Stability of the Chromophore. PLoS One. 6 (12), e28674(2011).
  35. Matta, J. A., et al. NACHO Mediates Nicotinic Acetylcholine Receptor Function throughout the Brain. Cell Rep. 19 (4), 688-696 (2017).
  36. Flores, C. M., Rogers, S. W., Pabreza, L. A., Wolfe, B. B., Kellar, K. J. A subtype of nicotinic cholinergic receptor in rat brain is composed of alpha 4 and beta 2 subunits and is up-regulated by chronic nicotine treatment. Mol Pharmacol. 41 (1), 31-37 (1992).
  37. Mazzaferro, S., Whiteman, S. T., Alcaino, C., Beyder, A., Sine, S. M. NACHO and 14-3-3 promote expression of distinct subunit stoichiometries of the α4β2 acetylcholine receptor. Cell Mol Life Sci. 78 (4), 1565-1575 (2021).
  38. Nichols, W. A., et al. Lynx1 Shifts α4β2 Nicotinic Receptor Subunit Stoichiometry by Affecting Assembly in the Endoplasmic Reticulum. J Biol Chem. 289 (45), 31423-31432 (2014).
  39. Fasoli, F., et al. In vivo chronic nicotine exposure differentially and reversibly affects upregulation and stoichiometry of α4β2 nicotinic receptors in cortex and thalamus. Neuropharmacology. 108, 324-331 (2016).
  40. Wada, E., et al. Distribution of alpha2, alpha3, alpha4, and beta2 neuronal nicotinic receptor subunit mRNAs in the central nervous system: A hybridization histochemical study in the rat. J Comparative Neurol. 284 (2), 314-335 (1989).
  41. Zoli, M., Léna, C., Picciotto, M. R., Changeux, J. P. Identification of Four Classes of Brain Nicotinic Receptors Using β2 Mutant Mice. J Neurosci. 18 (12), 4461-4472 (1998).
  42. Briggs, C. A., et al. and Low-Sensitivity Subforms of α4β2 and α3β2 nAChRs. J Mol Neurosci. 30 (1-2), 11-12 (2006).
  43. Weltzin, M. M., George, A. A., Lukas, R. J., Whiteaker, P. Distinctive single-channel properties of α4β2-nicotinic acetylcholine receptor isoforms. PLoS One. 14 (3), e0213143(2019).
  44. Moroni, M., Bermudez, I. Stoichiometry and Pharmacology of Two Human α4β2 Nicotinic Receptor Types. J Mol Neurosci. 30 (1-2), 95-96 (2006).
  45. Nelson, M. E., Kuryatov, A., Choi, C. H., Zhou, Y., Lindstrom, J. Alternate Stoichiometries of α4β2 Nicotinic Acetylcholine Receptors. Mol Pharmacol. 63 (2), 332-341 (2003).
  46. Tapia, L., Kuryatov, A., Lindstrom, J. Ca2+ Permeability of the (α4)3(β2)2 Stoichiometry Greatly Exceeds That of (α4)2(β2)3 Human Acetylcholine Receptors. Mol Pharmacol. 71 (3), 769-776 (2007).
  47. Eaton, J. B., et al. The Unique α4(+)/(−)α4 Agonist Binding Site in (α4)3(β2)2 Subtype Nicotinic Acetylcholine Receptors Permits Differential Agonist Desensitization Pharmacology versus the (α4)2(β2)3 Subtype. J Pharmacol Exp Ther. 348 (1), 46-58 (2014).
  48. Mazzaferro, S., et al. Additional Acetylcholine (ACh) Binding Site at α4/α4 Interface of (α4β2)2α4 Nicotinic Receptor Influences Agonist Sensitivity. J Biol Chem. 286 (42), 31043-31054 (2011).
  49. Richards, C. I., et al. Trafficking of α4* Nicotinic Receptors Revealed by Superecliptic Phluorin. J Bio Chem. 286 (36), 31241-33124 (2011).
  50. Asokan, A., Cho, M. J. Exploitation of Intracellular pH Gradients in the Cellular Delivery of Macromolecules. J Pharma Sci. 91 (4), 903-913 (2002).

Access restricted. Please log in or start a trial to view this content.

Reprints and Permissions

Request permission to reuse the text or figures of this JoVE article

Request Permission

Tags

Plasma Membrane LocalizationIntracellular LocalizationLive Cell ConfocalpH Sensitive FluorescenceReceptor TraffickingChaperone ProteinsNeuro2a CellsImageJ Analysis

Related Articles