This protocol describes the generation of a murine prostate organoid-based model grown in 2D. It includes organoid dissociation, cell seeding, differentiation, epithelial integrity assessment, and in-vitro infection with uropathogenic Escherichia coli. The model provides apical accessibility and is suitable for studying host-pathogen interactions, overcoming limitations of traditional 3D organoid systems.
Method Article
Generation of a Mouse Prostate Organoid-Based Model for Studying Host-Pathogen Interactions
In This Article
Summary
Abstract
Aging men are highly affected by prostate diseases, such as benign prostatic hyperplasia, prostatitis, and prostate cancer. Together, these conditions contribute significantly to the global health burden and are a leading cause of illness in men. Organoid models have transformed disease modeling by allowing the replication of key features of epithelial structure and function in vitro. However, the closed lumen structure of organoids limits experimental access to the apical surface, hindering studies of host-pathogen interactions. To overcome these challenges, we generated a physiologically relevant culture system in which cells derived from mouse prostate organoids are seeded as a two-dimensional (2D) model. This approach maintains essential epithelial characteristics while providing direct access to the apical surface. This step-by-step protocol describes the dissociation of mature mouse prostate organoids and optimal seeding conditions to support cell attachment, proliferation, and differentiation. Immunofluorescence microscopy confirmed the expression of prostate-specific markers in the organoid-based model and demonstrated an accurate representation of the prostate tissue's cellular organization. TEER measurements, along with F-actin and tight junction staining, further confirmed cell differentiation and barrier formation. Infection of the model with uropathogenic Escherichia coli (UPEC) demonstrated its utility in investigating host-pathogen interactions. This model provides a valuable platform to investigate prostate epithelial biology and disease mechanisms and is particularly well-suited for studying host-pathogen interactions and evaluating potential therapeutic strategies.
Introduction
The prostate gland is a small organ located below the bladder, surrounding the urethra. It is an essential organ of the male reproductive tract, and its main function is to produce the prostatic fluid. This fluid accounts for up to 30% of seminal plasma, and it is key to nourish and protect the sperm during its journey through the female reproductive tract1. Prostate diseases, such as prostatitis, benign prostatic hyperplasia, and prostate cancer, are highly prevalent and represent a significant burden on healthcare worldwide2,3,4,5. While benign prostatic hyperplasia and prostate cancer are being extensively studied, prostatitis, and particularly bacterial prostatitis, remain comparatively understudied. Prostatitis affects up to 16% of men globally6,7, with bacterial infections accounting for approximately 10% of cases. Despite its prevalence, bacterial prostatitis is still poorly understood. Escherichia coli (E. coli) strains, specifically uropathogenic E. coli (UPEC), are the leading cause of bacterial prostatitis8,9.
Research into the molecular mechanisms of prostate infection remains limited by the absence of physiologically relevant in vitro models. Most studies on prostate disease have traditionally relied on cell lines or animal models. In particular, cancerous or transformed cell lines such as LNCaP or RWPE-1 have been widely used to model prostate disease and response to treatment10,11,12,13. However, these models lack cell composition and the complexity of healthy or cancerous prostate epithelium. Moreover, many other studies have employed animal models (mostly mouse models) to study different hypotheses regarding prostate infection, immune response, prostate tumor growth, and metastasis14,15,16,17. While these models have been the most advanced and informative so far, they typically raise ethical concerns, require substantial time and resources, and can be expensive. Alternatively, ex vivo tissue explants and primary cell cultures have also been used for short-term studies of tissue responses to drugs or cancer development18,19,20. Yet, these models have a limited lifespan, and the availability of fresh human tissue is often restricted.
Three-dimensional (3D) organoid cultures derived from adult stem cells have emerged as a promising alternative for modeling epithelial tissues in vitro. Unlike conventional cell lines, organoids retain key features of the original epithelium, such as cellular heterogeneity, tissue-specific architecture, and functional characteristics21,22,23. Contrary to the primary cell cultures or ex vivo explants, organoid cultures can be expanded and passaged over a long period of time without becoming senescent. These properties make organoid systems particularly well-suited for studying disease and host-pathogen interactions in a physiologically relevant context. Prostate organoids have been generated from healthy and cancerous human tissue, as well as from mouse models, and used primarily in prostate cancer research24,25,26. Nevertheless, for infection studies, the 3D structure of organoids presents a significant challenge, primarily due to limited access to the luminal cell surface. Traditionally, intact 3D organoids have been infected either by microinjecting the pathogenic agent, or by first dissociating the organoid into fragments or single cells before incubation with the pathogen23. Here, variability in size and 3D structure can affect reproducibility and throughput. As an alternative, apical-out organoids provide a way to overcome the limitation of lumen inaccessibility. Culturing organoids in suspension, either in ultra-low attachment tissue culture plates or on surfaces coated with non-adhesive surfactants, induces a reversal of organoid polarity. As a result, the apical surface faces outward, allowing direct access for pathogen infection studies27,28. However, these cultures cannot be maintained long term, and variability in organoid size and cell number complicates the determination of multiplicity of infection (MOI). Additionally, the mechanisms underlying the reversal of polarity and its effects on the organoid cells are not yet fully understood. To overcome the limitations of organoids as in vitro infection models, apically accessible organoid-based models have been developed using organoids from organs such as the stomach, intestine, or lung29,30,31. Such systems preserve the main epithelial features and allow easier manipulation, imaging, and controlled exposure to pathogens and/or drugs. However, the culture conditions that allow for cell differentiation do not always translate from the organoid cultures to the 2D culture models31,32.
Here, we describe a protocol to generate an apically accessible prostate epithelial model using mouse prostate organoids. This model was previously developed and validated in our laboratory, where we demonstrated its strong resemblance to native prostate tissue and its relevance for infection biology studies involving UPEC32. The system closely mimics the cellular composition and polarity of the prostate epithelium while offering enhanced accessibility for experimental manipulation. Moreover, we demonstrate its applicability for studying host-pathogen interactions in the prostate, providing a more tractable alternative to in vivo models and a more physiologically relevant system than conventional cell lines or 3D organoid models.
Protocol
Ethical statement: All animal procedures complied with the animal care and use guidelines of the University of Würzburg and were approved under the relevant institutional and governmental regulations. Only WT mice that had been euthanized at our institute by other research groups for independent purposes were used in this study. No animals were sacrificed specifically for this work, in accordance with the 3R principles (replacement, reduction, and refinement).
NOTE: The protocol presented here is based on a previous study published by the authors32. All steps described herein must be carried out in a sterile biosafety cabinet using the applicable aseptic techniques and using appropriate personal protective equipment. Murine prostate organoids were generated from C57BL/6 mice and maintained in 3D culture, as previously described25,26. To follow the 3R principles, mouse prostates were donated by the animal facility from untreated naïve WT mice (at least 6-month-old) sacrificed for other reasons. Briefly, mouse prostates were minced and digested in two steps using collagenase and TrypLE Express Enzyme. Cells were then seeded in drops of extracellular matrix (ECM) to generate the 3D organoids. Culture medium was added to the culture and replenished every 3 days. 3D organoid cultures were passaged once a week and used for 2D seeding from passage 3 onward. One-week-old mouse prostate organoids were used to seed the organoid-based model onto a 2D surface following the present protocol. Coating tissue culture plates with ECM proteins is not required for this protocol.
1. Generation of the prostate organoid-based model
- 3D organoid isolation
- Aspirate the medium from the desired number of wells of 3D organoids from a 24-well plate. Replace it with 500 µL of adDMEM/F12+/+ per well (see Table of Materials).
- Use a P1000 pipette to mechanically disrupt the ECM drop. Collect the suspension in a 15-mL conical tube. Collect only a maximum of two wells per tube.
- Top up with adDMEM/F12+/+ up to 10 mL. Gently, invert the tube 3-4 times to mix. Centrifuge at 450 x g for 5 min at 4 °C.
- 3D organoid disruption into single cells
- Aspirate the supernatant. Resuspend the pellet in 2 mL of prewarmed (37 °C) TrypLE Express Enzyme supplemented with 10 µM RHOKi.
- Incubate in a water bath at 37 °C for 15 min. Use a P1000 pipette to mix the cell suspension every 5 min.
NOTE: Check the cell suspension under an inverted microscope using 4x objective to verify that the cells are mostly single. Small clumps of 2-3 cells are acceptable. Typically, 15 minutes of incubation is sufficient, but this can be extended if needed. - Top up with 10 mL of adDMEM/F12+/+. Gently, invert the tube 3-4 times to mix. Centrifuge at 450 x g for 5 min at 4 °C.
- Plating single-cell suspension
- Aspirate the supernatant without disturbing the pellet. Resuspend the cell pellet in culture medium supplemented with 10 µM RHOKi (300 µL of culture medium per well of 3D organoids used in step 1.1.1).
NOTE: Culture medium is composed of: Advance Dulbecco's Modified Eagle Medium/F12, 10 mmol L−1 HEPES, 1x GlutaMAX, 1x B27, 1 mM N-Acetylcysteine, 10% Noggin conditioned medium, 10% R-spondin 1 conditioned medium, 50 ng·mL-1 EGF, 1 nM 5α-dihydrotestosterone (DHT), 0.2 µM TGFβi, and 100 ng·mL-1 Primocin (see Table of Materials). For infection experiments, use culture medium without Primocin. - Count the number of cells in the suspension using a Neubauer counting chamber.
- Dilute the cell suspension in culture medium supplemented with 10 µM RHOKi to a concentration of 62,500 cells·mL-1. Use 200 µL of the cell suspension per well to seed on 48-well plates (tissue-culture treated from the manufacturer, see Table of Materials) or 300 µL per well on chambered µ-slides (see Table of Materials). Place the plate in a cell culture incubator at 37 °C and 5% CO2.
NOTE: Each well of 3D organoids, used in Step 1.1.1. typically yields approximately 200,000 cells. - After one day, most of the single cells are attached to the 2D surface. Change the culture medium every 2-3 days. Confluency is reached within 7 days.
NOTE: Ensure that RHOKi is added only for initial seeding and not for subsequent medium changes.
- Aspirate the supernatant without disturbing the pellet. Resuspend the cell pellet in culture medium supplemented with 10 µM RHOKi (300 µL of culture medium per well of 3D organoids used in step 1.1.1).
- Differentiating the organoid-based model.
NOTE: Follow the next steps to obtain a differentiated organoid-based model enriched with luminal cells.- Add 10 nM DHT to the cell suspension (step 1.3.3). Use culture medium supplemented with 10 nM DHT for subsequent medium changes (every 2-3 days).
NOTE: If no DHT is added to the cell suspension (and subsequent medium changes), the organoid-based model will be enriched with basal cells.
- Add 10 nM DHT to the cell suspension (step 1.3.3). Use culture medium supplemented with 10 nM DHT for subsequent medium changes (every 2-3 days).
2. Transepithelial electric resistance (TEER) measurements
- Seed the organoid cell suspension at a concentration of 62,500 cells·mL-1, using 300 µL (obtained in step 1.3.3.) on an 8-well PET µ-slide with 40 electrodes per well (see Table of Materials). Add 300 µL of culture medium, described in 1.3.1 to one of the wells without cells.
NOTE: The cell-free well is used as a blank for measurements. - Connect the µ-slide to the impedance-based cell analysis system (see Table of Materials) with the 16-well station placed inside a tissue culture incubator. Measure the TEER at 400 Hz for 7 days. Change the culture medium every 2-3 days.
3. Immunofluorescence staining
NOTE: For this method, ensure that cells are seeded in chambered µ-slides (see Table of Materials), which are compatible with high resolution microscopy applications.
- At the selected time point, remove medium, and wash the cells 3 times with 1x PBS. Fix the cells with 4% paraformaldehyde (PFA) for 15 min at room temperature (avoid light exposure).
CAUTION: 4% paraformaldehyde may cause an allergic skin reaction, serious eye damage, and is suspected of causing cancer. Always use appropriate personal protective equipment (PPE). Avoid inhalation of dust, fumes, gases, mists, vapors, or sprays. Wear protective gloves and ensure that contaminated clothing remains within the laboratory until properly decontaminated. Dispose of contents and containers through an approved waste disposal facility. - After fixation, wash the cells 3 times with 1x PBS (5 min each). Permeabilize the cells with 0.5% Triton X-100 (see Table of Materials) for 15 min at room temperature.
CAUTION: Triton X-100 causes skin irritation and serious eye damage. It is very toxic to aquatic life with long-lasting effects and may cause endocrine disruption in the environment. When handling, wear protective gloves, eye, and face protection. Dispose of contents and containers through an approved waste disposal facility. Avoid release into the environment. - Wash the cells twice with 1x PBS (5 min each). Block the cells with blocking buffer (1% BSA in PBS, see Table of Materials) for 30 min at room temperature.
- Dilute the primary antibodies in blocking buffer (1% BSA in 1x PBS) and incubate with the cells overnight at 4 °C on a rocking platform. On the following day, incubate 1 h at room temperature. (see Table of Materials for antibody dilutions).
NOTE: For the staining of F-actin with phalloidin or plasma membrane with CellMask (see Table of Materials), skip step 3.4. - Wash the cells 3 times with 1x PBS (5 min each). Dilute the secondary antibodies, phalloidin or CellMask (see Table of Materials) in blocking buffer (1% BSA in 1x PBS) and incubate with the cells 1 h at room temperature.
- Wash the cells 3 times with 1x PBS (5 min each). Incubate the cells 15 min at room temperature with Hoechst (see Table of Materials) diluted in 1x PBS to stain the nuclei.
- Wash the cells 3 times with 1x PBS (5 min each) and leave the cells with 1x PBS. Store at 4 °C.
- Image the chambered µ-slides slides (see Table of Materials) in a laser scanning confocal microscopy or fluorescence microscope.
NOTE: Overview images could be acquired using a 20x objective on a fluorescence microscope to assess overall infection efficiency and distribution. Higher resolution images were obtained using a confocal microscope equipped with a 40x water immersion objective to visualize individual bacteria attached to or internalized within epithelial cells. Fluorophores were excited using laser lines at 405, 499, 590, and 653 nm, depending on the fluorophores used. Emission was detected with emission windows set to 415 to 516 nm for Hoechst, 509 to 573 nm for GFP or Alexa 488, 600 to 651 nm for mcherry or Alexa 594, and 663 to 720 nm for Alexa 647. Z stacks were acquired with a step size of 0.5 µm and covering the full thickness of the epithelial layer. Images were acquired at a resolution of 1024 by 1024 pixels, with a scan frequency of 400 Hz and frame averaging set to 4, which provides good image quality. Laser power and detector gain were kept constant across all conditions within the same experiment. All imaging parameters including laser power, detector gain, scan speed, and averaging should be optimized and adjusted as required depending on the confocal microscope used.
4. Bacterial infection with uropathogenic E. coli (UPEC)
NOTE: Ensure to use an organoid-based model maintained for 7 days without Primocin (see Table of Materials) for the following steps.
The uropathogenic E. coli strain UTI89, constitutively expressing a mCherry protein from the plasmid pFPV-mCherry (ampicillin resistant), was used in this study.
CAUTION: When handling infectious pathogens (Biosafety Level 2), wear gloves and appropriate eye and face protection. Always wear a fully buttoned lab coat. Conduct all procedures within a certified biological safety cabinet. Decontaminate work surfaces and wash hands thoroughly after handling biological materials. Collect BSL-2 waste in designated biohazard containers suitable for autoclaving. Decontaminate waste materials prior to disposal by autoclaving or other suitable decontamination method.
- Three days before the infection experiment, streak out the UPEC strain on a LB agar plate supplemented with the corresponding antibiotic (ampicillin 100 µg·mL-1 was used in this protocol) and incubate 16-24 h at 37 °C.
CAUTION: Some antibiotics may cause allergic reactions or irritation upon contact and contribute to antimicrobial resistance if improperly discarded. Always prepare and add antibiotics within a biological safety cabinet while wearing appropriate personal protective equipment (gloves and eye protection). Dispose of antibiotic-containing solutions as chemical waste through an approved waste disposal facility. - Two days before the infection experiment, inoculate 3 mL of LB broth supplemented with the corresponding antibiotic (ampicillin 100 µg·mL-1) using a single UPEC colony from the agar plate (step 4.1). Incubate statically at 37 °C for 12-16 hours.
- One day before the infection experiment, vortex the bacterial culture from step 4.2 and measure its OD600. Calculate the volume of this culture required to inoculate 3 mL of LB broth supplemented with ampicillin (100 µg·mL-1) to a starting OD600 of 0.05 using the following formula: Volume (µL) = (0.05 * 3,000 µL) / measured OD600. Add the calculated volume of the culture from step 4.2. to the fresh LB broth and incubate statically at 37 °C for 24 hours.
NOTE: The OD600 of the overnight culture from step 4.2 should be between 1.7 and 2.2. - On the day of infection, vortex the bacterial culture from step 4.3 and measure its OD600. Harvest OD600 1 from the culture, then centrifuge at 12,000 x g for 2 min at room temperature. Remove the supernatant.
- Resuspend in 1 mL of Primocin-free organoid culture medium without DHT. Dilute to a MOI of 100.
NOTE: Each well in a 48-well plate is considered to have approximately 150,000 cells on day 7. This estimate was obtained by counting cells in a well before infection across multiple experiments. To accurately adjust the MOI, it is recommended to seed one extra well for cell counting before infection. To determine the volume of bacterial suspension (step 4.4) required, multiply the number of cells per well by the MOI to obtain the total number of bacteria needed per well, then divide this number by the bacterial concentration (8 × 10⁵ bacteria/µL) to obtain the volume in µL. - Replace the culture medium of the organoid-based model with culture medium containing bacteria. Adjust the volume according to the culture surface: use 200 µL per well for 48-well plates and 300 µL per well for µ-slides. Incubate for 1 h in a cell culture incubator at 37 °C and 5% CO2.
- After the incubation period, aspirate the bacteria-containing medium from the organoid-based model. Wash the well 3 times with adDMEM/F12+/+ to remove extracellular bacteria.
- Add culture medium containing 50 µg·mL-1 gentamicin to kill extracellular bacteria. Incubate it for 30 min.
NOTE: Gentamicin concentration may need to be adjusted depending on the bacterial strain used. If using a concentration higher than 50 µg·mL-1, checking for cellular cytotoxicity is recommended. - Remove medium and replace with fresh medium supplemented with 10 µg·mL-1 gentamicin for the remaining infection time.
Process the infected cells for fluorescence staining, following section 3, or for quantification by flow cytometry, following section 5.
5. Infection quantification by flow cytometry
- Aspirate the culture medium and wash the cells 3 times with 1x PBS. Use 100 µL of TrypLE Express Enzyme to detach the cells. Incubate for 5-10 min until all the cells are detached.
NOTE: A well from a 48-well plate is sufficient per condition. - Collect the cell suspension and transfer it to a well of a 96-well plate (conical bottom). Add 100 µL of flow cytometer buffer (1x PBS, 10% FBS, 5 mM EDTA) on top to inactivate the TrypLE Express Enzyme.
- Centrifuge the 96-well plate at 450 x g for 5 min at 4 °C. Remove the supernatant and resuspend the pellet in 150 µL of flow cytometer buffer.
- Acquire and quantify infected cells using the flow cytometer (see Table of Materials).
NOTE: Flow cytometry was performed using a 488 nm excitation laser and a 615/20 nm emission filter for detection of mCherry-positive cells. Data were acquired at a high flow rate (66 µL·min⁻¹), collecting at least 10,000 events per sample and including only events with forward scatter height values larger than 80,000. Infected cells were identified based on mCherry fluorescence in comparison with a non-infected (naïve) control, following exclusion of debris and doublets. A viability marker (e.g., propidium iodide or other live/dead stains) can be included in the gating strategy to assess cell viability. This may be particularly useful when first working with the model to ensure that cell dissociation does not adversely affect the cells.
Results
This protocol describes the generation of an organoid-based model of the mouse prostate epithelium that recapitulates the cell type and transcriptional expression of the epithelial compartment of the native tissue. This model is generated using 3D adult stem cell organoids generated from adult mouse prostate tissue. These organoid cultures are then maintained in culture and passaged weekly. For the organoid-based model, the first step in the workflow (Figure 1A) starts by using 7-days-old 3D organoids. This period of time is necessary for them to reach an appropriate size and cell density for subsequent seeding onto a 2D surface. After passaging, small fragments of organoids (Figure 1B, Day 0) were seeded in ECM and allowed to grow. Over time, they grow into large, spherical structures with a defined inner lumen by Day 7 (Figure 1B). After dissociating the 7-day-old organoids into single cells, the cells were seeded onto a tissue culture-treated plate (Figure 1C, Day 0) using the same culture medium as for the 3D organoid cultures (1nM DHT) to form a monolayer. By day 1, the adhered cells had begun to proliferate. Over the following days, the monolayer expanded and reached confluence between Day 3 and Day 5, as observed by brightfield microscopy (Figure 1C). To characterize the morphological changes over time and to monitor the time at which the organoid-based model reaches confluence, we stained the plasma membrane with CellMask and performed fluorescence imaging at multiple time points (Figure 1D).
Because androgen receptor (AR) signaling is a key regulator of cell differentiation in the prostate, and modulating the concentration of testosterone (or DHT) in the organoid culture medium was shown to directed differentiation of stem cells into basal or luminal cells32, we adjusted the DHT levels in the culture medium to promote enrichment of either luminal cells (DHT 10 nM) or basal cells (no DHT, Control; Method1, Figure 2A). As shown in Figure 2 (B-F), no major differences were observed in cell growth or confluency. As expected, in the control condition (organoid culture medium without DHT), most cells expressed cytokeratin 5 (KRT5), a marker of prostate basal stem cells (Figure 2B,E). In contrast, only a few cells expressed low levels of CD24a, a marker of differentiated luminal prostate cells (Figure 2B,F).
Supplementation with 1 nM DHT, as we previously described32, resulted in a mixed population containing both basal and luminal cells. However, CD24a expression remained low, indicating incomplete differentiation into luminal cells (Figure 2C,F32). Increasing DHT to 10 nM promoted full differentiation of luminal cells while still maintaining some basal cells after 7 days of culture (Figure 2D-F). The differentiation of the organoid-based models can also be assessed using brightfield microscopy. Although differences between the conditions are not very clear when cells are sparse (Day 0 - 5, Figure 1C, Supplementary Figure 1A), cell morphology and appearance become distinct and noticeable between the three culture conditions by brightfield microscopy at Day 7 (Figure 1C, Supplementary Figure 1A,B). In the absence of DHT, cells appeared flatter and more irregular in shape, whereas in 10 nM DHT, cells were tightly packed with a polygonal arrangement, resembling a cobblestone morphology (Supplementary Figure 1B).
Notably, 3D organoid cultures also underwent morphological changes when cultured at different concentrations of DHT. Specifically, a clear dose-dependent increase in organoid size was observed, with the largest organoids forming in the presence of 10 nM DHT (Figure 1B, Supplementary Figure 2A,B). These results indicate that the AR pathway is critical not only for cell differentiation but also for modulating the growth dynamics of mouse prostate organoids.
To assess epithelial integrity and polarization of the models, we performed transepithelial electrical resistance (TEER) measurements in the organoid-based model grown with no or 10 nM DHT. TEER values increased over time in both conditions but were substantially higher in the presence of 10 nM DHT (Figure 3A), indicating enhanced epithelial barrier function. These results were supported by phalloidin staining of actin filaments, which are typically organized into an apical ring at the cell-cell junctions in luminal prostate epithelial cells. In the 10 nM DHT condition, the actin ring appeared more defined compared to the control condition, consistent with increased cell polarity and epithelial organization (Figure 3B). Additionally, immunostaining for zonula occludens 1 (ZO-1) revealed an increase in tight junctions in the 10 nM DHT condition (Figure 3C), further supporting reinforced epithelial barrier integrity and differentiation toward a luminal phenotype. Orthogonal projections reveal that organoids cultured with 10 nM DHT exhibit well-defined epithelial polarity (Supplementary Figure 3A). Basal KRT5⁺ cells are located at the bottom, and luminal CD24a⁺ cells are distributed along the epithelial layer, showing stronger staining intensity toward the apical side. This architecture is similar to that observed in mouse prostate tissue (Supplementary Figure 3B). Of note, data from the Human Protein Atlas shows that these markers have a comparable localization in human prostate tissue, with KRT5⁺ basal cells underlying a CD24a⁺ luminal layer (Supplementary Figure 3C)33. In contrast, cells cultured under control or 1 nM DHT conditions do not show a clear spatial separation between basal and luminal markers, and cell height was much lower than in the 10 nM condition (Supplementary Figure 3A). This indicates that 10 nM DHT supplementation promotes epithelial differentiation and polarization in the 2D model in a way that is comparable to the native prostate epithelium. Since the organoid-based model grown with 10 nM DHT closely resembles the native mouse prostate epithelium (Figure 2D, Supplementary Figure 3A,B), it serves as a relevant platform for investigating host-pathogen interactions. To demonstrate the model's applicability, we used infections with UPEC, specifically the UTI89 strain, one of the most commonly used UPEC strains in the genitourinary tract field, as an example. As shown in Figure 4A, bacteria were grown in LB broth for 24h (as described in Method 4) and incubated with the cells for one hour. Extracellular bacteria were then killed with gentamicin to quantify invasion and intracellular replication. Upon infection of the organoid-based model, UPEC adhered to the epithelial cells in high numbers (0 hpi; Figure 4B, left panel; Figure 4C). Then, and following the gentamicin treatment (1 hpi), the number of UPEC-positive cells significantly decreased, due to the extracellular bacteria death (Figure 4B, middle panel; Figure 4C). At 24 hpi, the number of infected cells remained unchanged (Figure 4C), however, confocal microscopy imaging showed that intracellular bacteria continued to replicate, forming community-like structures, similar to those previously described in the bladder epithelium (Figure 4B, right panel). Infected cells were identified by mCherry fluorescence using non-infected (naïve) controls as a reference, following exclusion of debris and doublets (Supplementary Figure 4).
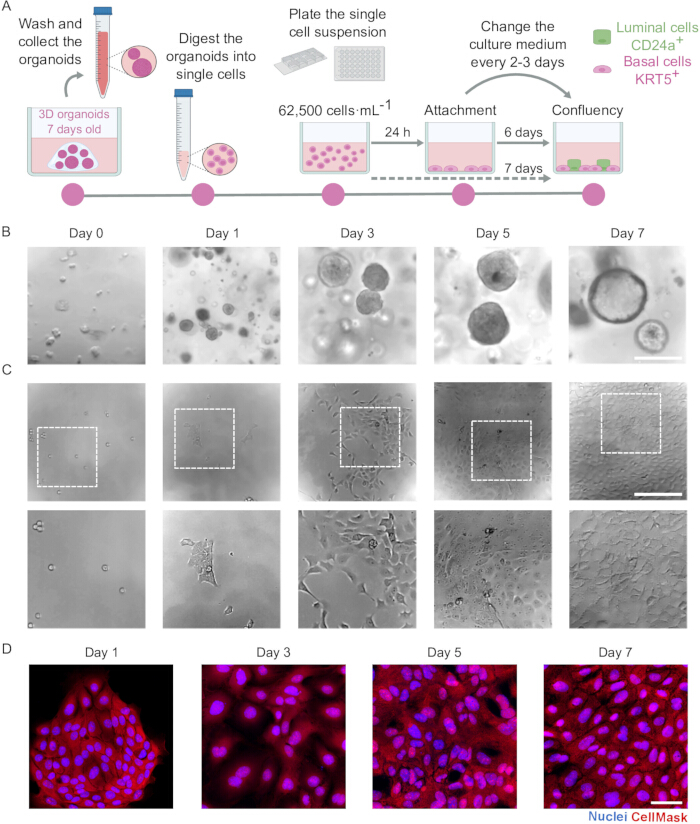
Figure 1: Overview of the workflow and morphological evolution of the prostate organoids and the organoid-based models over time. (A) Schematic representation of the experimental workflow (Method 1). (B) Brightfield images showing the morphological development of the prostate organoids supplemented with 1 nM DHT, captured at days 0, 1, 3, 5, and 7 (left to right). Scale bar: 200 µm. (n = 3). (C) Brightfield images of the organoid-based model supplemented with 1 nM DHT, captured at days 0, 1, 3, 5, and 7 (left to right). Scale bar: 200 µm. (n = 3). (D) Representative immunofluorescence microscopy images of the organoid-based model supplemented with 1 nM DHT and stained with CellMask (red), at days 1, 3, 5, and 7 (left to right). Nuclei were counterstained using Hoechst 33342 (blue). Scale bar: 50 µm. (n = 3) Please click here to view a larger version of this figure.
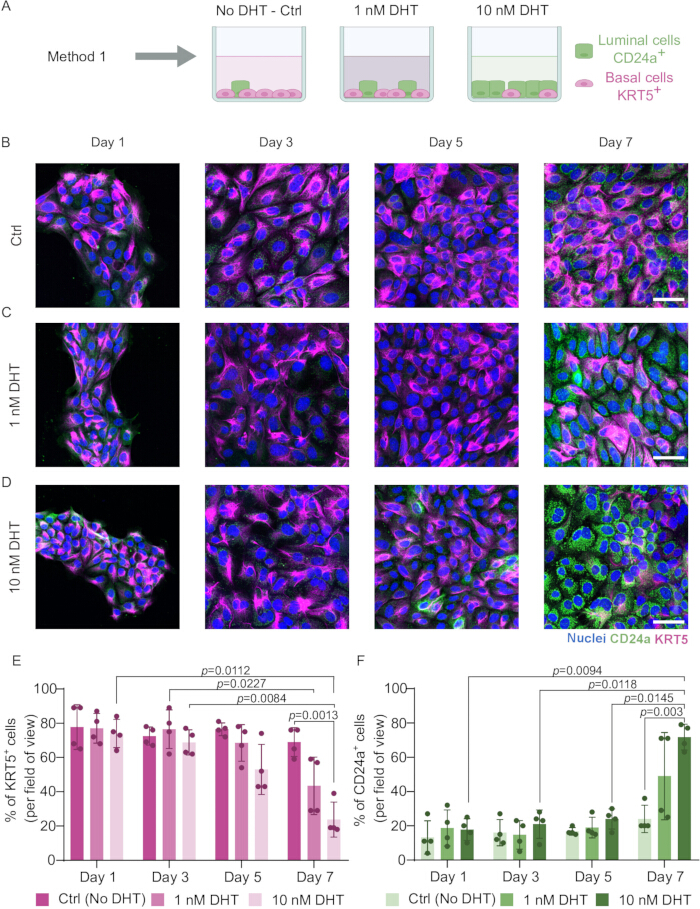
Figure 2: DHT modulates lineage differentiation in the organoid-based model. (A) Schematic representation of the different conditions used for differentiation. (B-D) Representative immunofluorescence microscopy images of the organoid-based model grown for 7 days in the (B) absence (Ctrl) or presence of (C) 1 nM or (D) 10 nM DHT. Images were captured at days 1, 3, 5, and 7 (left to right). The organoid-based models were stained for CD24a (luminal cell marker, green) and KRT5 (basal cell marker, magenta). Nuclei were counterstained using Hoechst 33342 (blue). Scale bar: 50 µm. (n = 4). (E,F) Image quantification of (E) KRT5+ and (F) CD24a+ cells in the organoid-based model grown with no DHT (Ctrl), 1nM or 10nM. Data is shown as % of positive cells per field of view. Statistical test: one-way ANOVA with Tukey's post hoc test. Please click here to view a larger version of this figure.
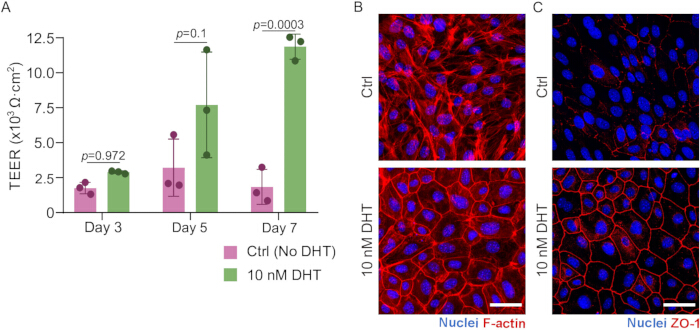
Figure 3: The organoid-based model differentiated with 10 nM DHT shows higher cell polarization compared to the control. (A) TEER analysis of the organoid-based model grown for 7 days in the absence (Ctrl; pink) and presence of DHT (10 nM; green). Error bars represent SD (n = 3). Statistical test: one-way ANOVA with Tukey's post hoc test.(B,C) Representative immunofluorescence microscopy images of the organoid-based model grown for 7 days without (Ctrl; top) or with 10 nM DHT (bottom) and stained for (B) F-actin (red) and (C) ZO-1 (red). Nuclei were counterstained using Hoechst 33342 (blue). Scale bar: 50 µm. (n = 3) Please click here to view a larger version of this figure.
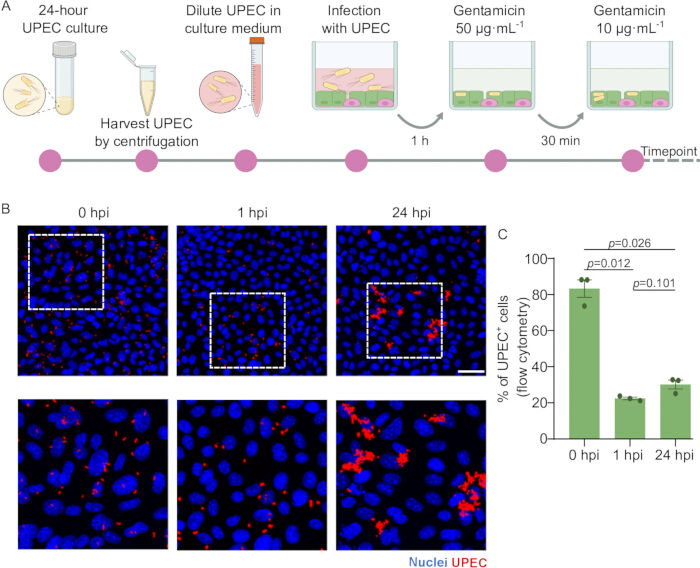
Figure 4: Analysis of infection dynamics in the organoid-based model. (A) Schematic representation of the infection protocol (section 4). (B) Representative immunofluorescence microscopy images showing the infected organoid-based model at 0, 1, and 24 h post-infection (hpi; left to right). UPEC are visualized in red. Nuclei were counterstained using Hoechst 33342 (blue). Scale bar: 50 µm. (n = 3). (C) Flow cytometry analysis of UPEC-positive cells (mCherry positive, infected cells) at 0, 1, and 24 hpi. Gating strategy is shown in Supplementary Figure 4. Error bars represent SEM (n = 3). Statistical test: one-way ANOVA with Tukey's post hoc test. Please click here to view a larger version of this figure.
Supplementary Figure 1: Morphological evolution of the organoid-based model over time. (A,B) Brightfield images of organoid-based model in the (A) absence (Ctrl) and (B) presence of 10 nM DHT, captured at days 0, 1, 3, 5, and 7 (left to right). Scale bar: 200 µm. (n = 3) Please click here to download this File.
Supplementary Figure 2: DHT concentration affects 3D prostate organoid growth. (A) Brightfield images of organoid-based model in the absence (Ctrl; top) and presence of 10 nM DHT (bottom), imaged at days 0, 1, 3, 5, and 7 (left to right). Scale bar: 200 µm. (n = 3). (B) Quantification of 3D organoid size at Day 7 grown under the three different conditions: no DHT (Ctrl; pink), 1 nM DHT (purple), and 10 nM DHT (green). Statistical test: one-way ANOVA with Tukey's post hoc test (n = 3). Please click here to download this File.
Supplementary Figure 3: Characterization of prostate organoid morphology and epithelial polarity. (A) Orthogonal projections of confocal z-stacks illustrating epithelial organization and apical-to-basal polarity under different DHT concentrations (Ctrl, 1 nM, and 10 nM DHT). Basal cells were stained for KRT5 (magenta) and luminal cells for CD24a (green). Scale bar: 50 µm.(B) Immunofluorescence staining of OCT-embedded mouse prostate tissue showing basal (KRT5, magenta) and luminal (CD24a, green) epithelial markers. Nuclei are counterstained with DAPI (blue). Scale bar: 50 µm. Briefly, mouse tissue pieces were fixed with 4% PFA, dehydrated overnight with 30% sucrose, and OCT-embedded32. Slides were then rehydrated in PBS for 10 min and immunostained following section 3. (C) Immunohistochemistry analysis of CD24a and KRT5 protein expression in human prostate tissue (Panel C has been mined from The Human Protein Atlas Database(version 25.0; Human Protein Atlas proteinatlas.org), Uhlén, M. et al(2015)33, https://www.proteinatlas.org/ENSG00000186081-KRT5/tissue/prostate). Please click here to download this File.
Supplementary Figure 4: Flow cytometry gating strategy for identifying infected cells. Cells were first gated based on side scatter height (SSC-H) versus forward scatter height (FSC-H) to exclude debris, followed by gating on SSC-H versus side scatter area (SSC-A) to select single cells. mCherry-positive (infected) cells were then identified using Counts versus PE-Texas Red-H fluorescence (Histogram). Please click here to download this File.
Discussion
A range of diseases can affect the prostate, including benign prostatic hyperplasia, prostatitis, and prostate cancer. These diseases are highly prevalent and significantly influence the quality of life of patients2. Despite their significant impact on healthcare, our understanding of these diseases, particularly the underlying mechanisms and host responses in non-cancerous conditions, remains limited. This is largely due to the lack of physiologically relevant experimental models. On the one hand, immortalized cell lines do not capture the complexity or differentiation status of normal prostate epithelium. On the other hand, animal models, primarily rodents, raise ethical concerns and are not cost-effective. An alternative approach is the use of human primary cells or patient-derived tissue explants. However, the limited availability of fresh prostate tissue restricts their widespread application. These limitations highlight the need for other in-vitro systems that are physiologically relevant, easy to use, and experimentally manageable. In this context, adult stem cell organoid technology has transformed disease modeling. These 3D cultures have the capacity to self-organize, preserving epithelial identity and epithelial cellular diversity23,34,35,36,37,38. While their 3D architecture has enabled applications in cancer research, drug testing, and regenerative medicine23,34,35,36,37,38,39,40,41, their enclosed structure, with the apical surface facing inward, poses practical challenges for experimental access, particularly as in-vitro infection models. Apical-out organoids address this limitation by reversing epithelial polarity, exposing the apical surface for direct infection studies27,28. However, their effectiveness as an infection model may be limited by variability in their size, unequal exposure to pathogens, and fragility during long-term infection.
Here, we present a protocol for generating an organoid-based model of the mouse prostate that recapitulates the epithelial cell composition and transcriptional profile of the native murine epithelium, while providing easy access to the apical surface. Optimized in our previous work32, this model allows precise control over key experimental variables, including seeding density, uniform exposure to stimuli, defined bacteria-to-cell ratios (MOI), and high-throughput imaging parameters that are often difficult to standardize in conventional 3D organoid systems.
In line with the 3Rs principle (Replace, Reduce, Refine) for animal experimentation42, the organoids used as a source of primary cells for this model are derived from wild-type naïve mice that were sacrificed for unrelated purposes, such as breeding. Prostates are obtained through donations from nearby animal facilities, thereby reducing the need to sacrifice additional animals specifically for this protocol.
Robust and reliable differentiation of organoids and organoid-based models is critical for faithfully replicating the cellular composition and functional characteristics of native tissue, ensuring their relevance as in vitro models. Cell differentiation within organoids is strongly influenced by the specific composition of the culture medium, including the precise concentrations of growth factors and pharmacological agents (i.e. drug inhibitors). Manipulating these factors enables direct differentiation toward specific cell lineages, as demonstrated in various organoid systems. For instance, in intestinal organoids, removal of WNT promotes enterocyte differentiation, which can be further enhanced by interferon gamma (reviewed in38). Differentiation into goblet cells can be achieved by removal of p38 inhibitor and nicotinamide or by Notch inhibition via DAPT/DBZ (reviewed in38). IGF-1 and FGF-2 have been also shown to support long-term expansion of secretory cell-enriched cultures43. Moreover, IL-22 enhances Paneth cell differentiation, and enteroendocrine cells arise via inhibition of pathways including Notch and BMP38. Similarly, gastric organoids and organoid-based monolayers show differentiation toward pit cells when WNT is withdrawn from the culture medium, while adding nicotinamide to the medium directs cells into a gland phenotype (neck and chief cells)31,44,45.
In the prostate, the androgen receptor (AR) plays a crucial role in maintaining tissue homeostasis46,47,48,49. Testosterone, produced by Leydig cells in the testicles, is converted to DHT in the prostate epithelial cells by the 5α-reductase. DHT activates AR, which dimerizes, translocates to the nucleus, and binds to androgen response elements to regulate genes involved in cell differentiation and homeostasis50. Previous studies have shown that supplementation of 1 nM in 3D mouse prostate organoids is sufficient to achieve cell differentiation into luminal cells51. Others have also shown that supplementation with vitamin D (specifically 1,25-dihydroxyvitamin D) promoted human prostate organoid growth and accelerated differentiation by inhibiting canonical WNT activity and suppressing the WNT family member DKK352. However, in these studies, only 3D organoids were used. Our previous work32 and others53 showed that supplementation with 10 nM DHT in 3D organoids is not enough to achieve full differentiation. In contrast, using the 2D model described here, that is seeding the cells in 2D with 10 nM DHT, is sufficient to differentiate the model to a state similar to the native tissue32. To understand this difference between the 3D and 2D models, further work will be needed, but it could be explained by the different mechano-physical cues between the systems or by the presence of ECM containing growth factors in the 3D model.
Three major epithelial cell types can be found in adult prostate tissue: luminal, basal, and neuroendocrine cells. Of these, only luminal and basal cells are present in all organoid models published so far. The lack of the rare neuroendocrine cells suggests that current organoid protocols might not be fully optimized. Between luminal and basal cells, a prostate intermediate cell population has also been described as a transitional state expressing both luminal (i.e. CD24a) and basal (i.e. SCA-1) markers18,51. This subpopulation is often found in the periurethral prostate region, which is why they are frequently referred to as periurethral luminal cells54. Although this has been reported in some 3D organoid systems under specific differentiation or signaling conditions53,55, we do not observe a clear separation between luminal and intermediate cells in our system32. One possible explanation is that during 3D organoid generation, we do not distinguish between different prostate regions, and to avoid contamination with urethral cells, we remove the tissue directly adjacent to the urethral prostate connection. Therefore, organoid cultures derived from proximal or urethra adjacent regions are likely more capable of generating intermediate cells.
Barrier integrity is considered a hallmark of a mature and differentiated epithelium, providing a protective barrier against toxins and microbes reaching the underlying tissue. Tight junctions (rich in ZO-1 proteins56) play a vital role in regulating paracellular permeability and maintaining the integrity of the epithelial barrier57. As epithelial cells differentiate, the maturation of these intercellular junctions strengthens the barrier58. Hence, assessing barrier integrity is an important readout for an in vitro epithelial model. In this protocol, we show three complementary methods for assessing barrier integrity: TEER measurement, ZO-1 immunostaining, and F-actin staining. While all three methods effectively assess barrier integrity, they differ significantly in the equipment and resources required. TEER measurements provide a quantitative value that can be tracked over time, offering dynamic insight into barrier function; however, this technique demands specialized hardware and software that may not be available in every laboratory. By contrast, staining with anti-ZO-1 antibodies or phalloidin is much more manageable in terms of time and cost (e.g. phalloidin staining can be done in around 3 h - section 3).
This protocol describes how to use 3D mouse prostate organoids to generate an apically accessible 2D model. Several reviews have outlined the advantages and disadvantages of organoids and organoid-based systems in studying host-pathogen interactions23,36,59. In infection studies, it is critical to consider the natural site of interaction between pathogens and the host epithelium. In the prostate, luminal cells are typically the first point of contact, and therefore, access to the apical surface is essential for accurately modeling infection dynamics. In conventional 3D prostate organoids, the apical surface faces the organoid lumen and is not directly accessible. In these, pathogen exposure can be achieved through microinjection, which is low-throughput and technically challenging, or by disrupting the organoids, which compromises epithelial polarity and results in non-physiological interaction sites23. In contrast, the apically accessible 2D model presented in this protocol offers direct access to the luminal surface. This enables controlled and physiologically relevant exposure to pathogens, precise regulation of the MOI, and compatibility with high-throughput, high-resolution or live-cell imaging platforms. Here, we showcase the use of this model as an in vitro infection system using the UPEC reference strain UTI89, a widely used reference representing the main bacterial species responsible for bacterial prostatitis9. However, this model can be readily adapted to study other prostate pathogens such as Enterococcus faecalis or Pseudomonas aeruginosa, making it a versatile platform for infection biology in the prostate.
The dissociation of 3D organoids is a critical step for the successful establishment of the organoid-based model. Failure to fully dissociate the 3D organoids, resulting in large fragments, can impair cell adhesion to the culture surface, while prolonged exposure to the dissociation reagent for longer than 30 minutes reduces cell viability. Moreover, maintaining a consistent passage interval of approximately seven days prior to dissociation and seeding is essential, as the physiological state of the organoids strongly influences their ability to attach and differentiate. Another critical variable influencing the successful development of the prostate organoid-based model is the seeding density. The seeding concentration used here was optimized for differentiation over 7 days. Increasing or decreasing this concentration would likely result in different differentiation times. Moreover, inadequate cell resuspension before plating can lead to uneven distribution of cells across wells, resulting in variable cell densities that, in turn, influence both proliferation and differentiation. In addition, as in other organoid models, different batches of ECM or growth factors can influence growth and differentiation capacity. Therefore, it is important to verify that the organoid-based model retains a consistent phenotype after any change in growth factor batch or lot number.
Once the organoid-based model is established, the infection parameters must also be carefully optimized. Different MOIs are often required to achieve robust and reproducible infection levels depending on the bacterial strain and the chosen readout. For UPEC strain UTI89 (used here and in32) and for several prostatitis isolates32, an MOI of 100 was sufficient to obtain a reliable number of infected cells across adhesion, invasion and replication time points. However, if the incubation of cells with bacteria needs to be extended beyond 1 h, a lower MOI should be used to prevent extracellular overgrowth of UPEC in the medium and subsequent toxicity to the cells. In this protocol, infection was assessed using two methods: I) flow cytometry to quantify the proportion of infected cells, and II) confocal microscopy to evaluate bacterial localization. However, several other approaches can also be used, such as colony forming unit assays to measure bacterial32, immunostaining to detect host or bacterial markers32, or transcriptomic analyses to profile host responses.
While the prostate organoid-based model provides a physiologically relevant system, several limitations should be considered when applying it to infection research. One major constraint of this model is the absence of resident or peripheral immune cells, which limits its ability to fully capture the host response to infection (e.g. immune cell recruitment or immune-mediated clearance). Other essential components missing from the model include vasculature, stroma, and nerves, all of which may influence host-pathogen interactions. Incorporating additional cell types, such as stromal fibroblasts, immune cells, and endothelial cells, would help recreate a more complete tissue microenvironment. Advanced co-culture systems or microfluidic organ-on-a-chip platforms could further support complex cellular interactions and enable dynamic studies of infection. Additionally, when using organoids derived from animal models, species-specific differences must be considered, particularly when studying human-specific pathogens. Although our previous work32 showed that findings from the murine prostate organoid-based model could be reproduced in human tissue, interspecies variation in gene regulation, receptor expression, or hormone responses may still limit the model's direct relevance to human physiology. Incorporating human-derived organoids, when possible, would enhance translational value by enabling the study of human-specific pathogen interactions and responses. While these additions could strengthen organoid-based models as powerful tools for studying prostate biology, infection pathogenesis, and therapeutic development, the purely epithelial model we present offers a simplified and compartmentalized system. This allows focused investigation of epithelial-specific host-pathogen interactions without interference from other tissue components.
Disclosures
The authors declare no conflict of interest.
Acknowledgements
This work was supported by the BMFTR (FiRe-UPec, 01KI2107 to C.A.), the Deutsche Forschungsgemeinschaft (DFG GRK 2157; 3D Tissue Models for Studying Microbial Infections by Human Pathogens, Project 11, to C.A.). We thank Natalie Burkard and Nicolas Schlegel (University Hospital Würzburg) for support with ECIS1600R equipment. Schematics were created with BioRender.com.
Materials
| Name | Company | Catalog Number | Comments |
|---|---|---|---|
| 48 well plates | Sarstedt | 83.3923 | Bottom shape: flat |
| 5α-Androstan-17β-ol-3-one dihydrotestosterone | Sigma-Aldrich | A8380 | It was designated as DHT. Stock solution 10μM in 100% ethanol |
| 8-well PET slide with 40 electrodes per well | Applied Biophysics | 8W10E+ | Slides used for TEER measurments |
| 96 well plates | Sarstedt | 82.1583 | Bottom shape: conical |
| Advance Dulbecco’s modified Eagle medium/F12 | Thermo Fisher Scientific | 12634028 | It was designated adDMEM/F12+/+ when supplemented with 10 mmol L−1 HEPES and 1x GlutaMAX |
| Ampicilin | Roth | K029.2 | Concentration stock 100 mg/mL |
| Anti-CD24a antibody | Proteintech | 10600-1-AP | Primary antibody; dilution 1:100 in 1x PBS 1%BSA |
| Anti-Cytokeratin 5 Alexa Fluor 647 antibody | Abcam | ab193895 | Primary antibody; dilution 1:100 in 1x PBS 1%BSA |
| anti-Rabbit IgG Alexa Fluor 488 antibody | Invitrogen | A21441 | Secondary antibody; dilution 1:500 in 1x PBS 1%BSA |
| Anti-ZO-1 Polyclonal antibody | Proteintech | 21773-1-AP | Primary antibody; dilution 1:750 in 1x PBS 1%BSA |
| B27, 50x | Thermo Fisher Scientific | 12587010 | |
| Bovines Serumalbumin (BSA) Fraktion V, NZ-Origin | Roth | 8076.3 | Component of blocking buffer used at 1% in 1x PBS |
| chambered µ-Slide 8 Wells | Ibidi | 80806 | Surface modification: ibiTreat |
| Conical tube (15 mL) | Sigma Aldrich | T1943 | The flat bottom is better for small pellets. |
| Disodium ethylenediaminetetra-acetate 2H2O (EDTA) | Roth | 8043.2 | Homemade: 93.0 g in 400 mL of H2O, adjust pH to 8.0, ajust the volume with H2O up to 500 mL; 0.5 M EDTA; component of flow cytometer buffer |
| Dulbecco's Balanced Salt Solution (DPBS) | Gibco | 14190-144 | PBS |
| ECHO Revolve Microscope | ECHO | ||
| ECIS Z-Theta - impedance-based cell analysis system | Applied Biophysics | ECIS Z-Theta | System includes: 16 and/or 96 well station; external control module; Laptop PC; ECIS control, acquisition, and display software; elevated field module for automated cell migration and electroporation |
| Fetal Bovine Serum (FBS) Superior | Sigma Aldrich | S0615 | Component of Flow cytometer buffer; component of culture medium of 293T Cell Line; component of culture medium HEK293T cell line |
| Flash Phalloidin Red 594 | Biolegend | 424203 | Dilution 1:250 in 1x PBS 1%BSA |
| Flow cytometer buffer | 1x PBS, 10% FBS, 5 mM EDTA | ||
| Gentamicin | Sigma Aldrich | G1272 | |
| GlutaMAX | Thermo Fisher Scientific | 35050-038 | L-alanyl-L-glutamine dipeptide, component of adDMEM/F12+/+ |
| Harvard Biochrom Ultrospec 10 Cell Density Meter | Fisher Scientific | 10704417 | |
| HCS CellMask Deep Red stain | Life Technologies | H32721 | Dilution 1:1,000 in 1x PBS 1%BSA |
| HEK293T cell line transfected with mouse Noggin-Fc expression vector | Cell line from Prof. Dr. Clevers | Used to produce Noggin; culture medium: 500ml DMEM, high glucose, GlutaMAX, pyruvate (Gibco Life Technologies, 31966)+ 50ml FBS; Farin et al. Gastroenterology 143.6 (2012): 1518-1529 | |
| HEPES | Thermo Fisher Scientific | 15630056 | Component of adDMEM/F12+/+ |
| Hoechst 33342 | Life Technologies | H3570 | Dilution 1:5,000 in 1x PBS |
| Human epidermal growth factor (EGF) | Peprotech | AF-100-15 | Concentration stock 500 µg/mL |
| Inoculation loops | Sarstedt | 86.1567.010 | |
| Inoculation tubes | Sarstedt | 62.515.006 | |
| Leica Stellaris 5 confocal microscope | Leica | ||
| Luria Bertani Broth (LB broth) | Roth | X968.1 | |
| Matrigel | Corning | 356231 | Extracellular Matrix (ECM) |
| N-Acetylcysteine | Sigma-Aldrich | A9165-25G | Concentration stock 500 mM |
| Noggin CM | |||
| NovoCyte Quanteon | Agilent | Flow Cytometer | |
| Paraformaldehyde (PFA) | Sigma Aldrich | P6148 | used at 4% in 1x PBS, 4% sucrose |
| Primocin | Invivogen | Ant-pm-1 | |
| Q-VETTES semi-micro | Ratiolab | 2712120 | |
| RHOKi (Y-27632) | AbMole | M1817 | RhoA/ROCK inhibitor; Concentration stock 10 mM |
| R-spodin1 CM | |||
| R-Spondin1 expressing 293T Cell Line | Sigma Aldrich | SCC111 | Used to produce R-spo1 CM; culture medium: 500ml DMEM, high glucose, GlutaMAX, pyruvate (Gibco Life Technologies, 31966)+ 60ml FBS |
| TGFβi (A-83-01) | Tocris | 2939 | ALK4/5/7 inhibitor; Concentration stock 5 mM |
| Triton X-100 | Sigma Aldrich | T9284 | used 0.5% diluted in PBS 1x |
| TrypLE Express Enzyme | Gibco | 12605028 | Enzymatic cell dissociation agent to digest 3D mouse prostate organoids |
| Uropathogenic Escherichia coli strain UTI89 | WT strain from Prof. Dr. Dobrindt | transformed with pFPV-mCherry (addgene #20956) |
References
- Samanta, L., Parida, R., Dias, T. R., Agarwal, A. The enigmatic seminal plasma: A proteomics insight from ejaculation to fertilization. Reprod Biol Endocrinol. 16 (1), 1-11 (2018).
- Ma, C., Su, H., Li, H. Global Research Trends on Prostate Diseases and Erectile Dysfunction: A Bibliometric and Visualized Study. Front Oncol. 10, 627891(2021).
- Roehrborn, C. G. Benign prostatic hyperplasia: an overview. RIU. 7 (Suppl 9), S3-S14 (2005).
- Calhoun, E. A., et al. The economic impact of chronic prostatitis. Arch Intern Med. 164 (11), 1231-1236 (2004).
- Sung, H., et al. Global Cancer Statistics 2020: GLOBOCAN Estimates of Incidence and Mortality Worldwide for 36 Cancers in 185 Countries. CA Cancer J Clin. 71 (3), 209-249 (2021).
- Krieger, J. N., Nyberg, L., Nickel, J. C. NIH consensus definition and classification of prostatitis [5]. JAMA. 282 (3), 236-237 (1999).
- Khan, F. U., et al. Comprehensive overview of prostatitis. Biomed Pharmacother. 94, 1064-1076 (2017).
- Lipsky, B. A., Byren, I., Hoey, C. T. Treatment of bacterial prostatitis. Clin Infect Dis. 50 (12), 1641-1652 (2010).
- Krieger, J. N., Thumbikat, P. Bacterial Prostatitis: Bacterial Virulence, Clinical Outcomes, and New Directions. Microbiol Spectr. 4 (1), (2016).
- Mizokami, A., Gotoh, A., Yamada, H., Keller, E. T., Matsumoto, T. Tumor necrosis factor-alpha represses androgen sensitivity in the LNCaP prostate cancer cell line. J Urol. 164 (3 Pt 1), 800-805 (2000).
- Lin, H. P., et al. Difference in protein expression profile and chemotherapy drugs response of different progression stages of LNCaP sublines and other human prostate cancer cells. PLoS ONE. 8 (12), e82625(2013).
- Conte, M. P., et al. The adherent/invasive escherichia coli strain lf82 invades and persists in human prostate cell line rwpe-1, activating a strong inflammatory response. IAI. 84 (11), 3105-3113 (2016).
- Pennanen, P., et al. The effects of metformin and simvastatin on the growth of LNCaP and RWPE-1 prostate epithelial cell lines. Eur J Pharmacol. 788, 160-167 (2016).
- Abate-Shen, C., Shen, M. M. Mouse models of prostate carcinogenesis. Trends Genet. 18 (5), S1-S5 (2002).
- Rudick, C. N., et al. Uropathogenic Escherichia coli induces chronic pelvic pain. IAI. 79 (2), 628-635 (2011).
- Irshad, S., Abate-Shen, C. Modeling prostate cancer in mice: Something old, something new, something premalignant, something metastatic. Cancer Metastasis Rev. 32 (1-2), 109-122 (2013).
- Lupo, F., Rousseau, M., Canton, T., Ingersoll, M. A. The Immune System Fails to Mount a Protective Response to Gram-Positive or Gram-Negative Bacterial Prostatitis. J Immunol. 205 (10), 2763-2777 (2020).
- Peehl, D. M. Primary cell cultures as models of prostate cancer development. Endocr Relat Cancer. 12 (1), 19-47 (2005).
- Centenera, M. M., Raj, G. V., Knudsen, K. E., Tilley, W. D., Butler, L. M. Ex vivo culture of human prostate tissue and drug development. Nat Rev Urol. 10 (8), 483-487 (2013).
- McClurg, U. L., et al. Human ex vivo prostate tissue model system identifies ING3 as an oncoprotein. Br J of Cancer. 118 (5), 713-726 (2018).
- Lancaster, M. A., Knoblich, J. A. Organogenesisin a dish: Modeling development and disease using organoid technologies. Sci. 345 (6194), 1247125(2014).
- Kim, J., Koo, B. K., Knoblich, J. A. Human organoids: model systems for human biology and medicine. Nat Rev Mol Cell Biol. 21 (10), 571-584 (2020).
- Aguilar, C., Alves da Silva, M., Saraiva, M., Neyazi, M., Olsson, I. A. S., Bartfeld, S. Organoids as host models for infection biology - a review of methods. Exp and Mol Med. 53 (10), 1471-1482 (2021).
- Gao, D., et al. Organoid cultures derived from patients with advanced prostate cancer. Cell. 159 (1), 176-187 (2014).
- Karthaus, W. R., et al. Identification of multipotent luminal progenitor cells in human prostate organoid cultures. Cell. 159 (1), 163-175 (2014).
- Drost, J., et al. Organoid culture systems for prostate epithelial and cancer tissue. Nat Prot. 11 (2), 347-358 (2016).
- Co, J. Y., et al. et al Controlling Epithelial Polarity: A Human Enteroid Model for Host-Pathogen Interactions. Cell Rep. 26 (9), 2509-2520.e4 (2019).
- Stroulios, G., et al. Apical-out airway organoids as a platform for studying viral infections and screening for antiviral drugs. Sci Rep. 12 (1), 7673(2022).
- Mayorgas, A., et al. A Novel Strategy to Study the Invasive Capability of Adherent-Invasive Escherichia coli by Using Human Primary Organoid-Derived Epithelial Monolayers. Front Immunol. 12, 646906(2021).
- Tindle, C., et al. Adult stem cell-derived complete lung organoid models emulate lung disease in COVID-19. eLife. 10, e66417(2021).
- Aguilar, C., et al. Helicobacter pylori shows tropism to gastric differentiated pit cells dependent on urea chemotaxis. Nat Commun. 13 (1), 5878(2022).
- Guedes, M., et al. Uropathogenic Escherichia coli invade luminal prostate cells via FimH-PPAP receptor binding. Nat Microbiol. , 1-16 (2026).
- Uhlén, M., et al. Tissue-based map of the human proteome. Science. 347 (6220), 1260419(2015).
- Bar-Ephraim, Y. E., Kretzschmar, K., Clevers, H. Organoids in immunological research. Nat Rev Immunol. 20 (5), 279-293 (2020).
- Bose, S., Clevers, H., Shen, X. Promises and challenges of organoid-guided precision medicine. Med. 2 (9), 1011-1026 (2021).
- Puschhof, J., Pleguezuelos-Manzano, C., Clevers, H. Organoids and organs-on-chips: Insights into human gut-microbe interactions. Cell Host Microbe. 29 (6), 867-878 (2021).
- van der Vaart, J., Clevers, H. Airway organoids as models of human disease. J Intern Med. 289 (5), 604-613 (2021).
- Paužuolis, M., Samperio Ventayol, P., Neyazi, M., Bartfeld, S. Organoids as a tool to study the impact of heterogeneity in gastrointestinal epithelium on host-pathogen interactions. Clin Exp Immunol. 218 (1), 16-27 (2024).
- Kondo, J., Inoue, M. Application of cancer organoid model for drug screening and personalized therapy. Cells. 8 (5), 470(2019).
- Mulaudzi, P. E., Abrahamse, H., Crous, A. Insights on Three Dimensional Organoid Studies for Stem Cell Therapy in Regenerative Medicine. Stem Cell Rev Rep. 20 (2), 509-523 (2024).
- Peng, Z., Lv, X., Sun, H., Zhao, L., Huang, S. 3D tumor cultures for drug resistance and screening development in clinical applications. Mol Cancer. 24 (1), 93(2025).
- Sneddon, L. U., Halsey, L. G., Bury, N. R. Considering aspects of the 3Rs principles within experimental animal biology. J Exp Biol. 220 (17), 3007-3016 (2017).
- Fujii, M., et al. Human Intestinal Organoids Maintain Self-Renewal Capacity and Cellular Diversity in Niche-Inspired Culture Condition. Cell Stem Cell. 23 (6), 787-793.e6 (2018).
- Bartfeld, S., et al. In vitro expansion of human gastric epithelial stem cells and their responses to bacterial infection. Gastroenterology. 148 (1), 126-136.e6 (2015).
- Boccellato, F., et al. Polarised epithelial monolayers of the gastric mucosa reveal insights into mucosal homeostasis and defence against infection. Gut. 68 (3), 400-413 (2019).
- Tan, M. E., Li, J., Xu, H. E., Melcher, K., Yong, E. Androgen receptor: structure, role in prostate cancer and drug discovery. Acta Pharmacol Sin. 36 (1), 3-23 (2015).
- Zhou, Y., Bolton, E. C., Jones, J. O. Androgens and androgen receptor signaling in prostate tumorigenesis. J Mol Endocrinol. 54 (1), R15-R29 (2015).
- Xie, Q., Liu, Y., Cai, T., Horton, C., Stefanson, J., Wang, Z. A. Dissecting cell-type-specific roles of androgen receptor in prostate homeostasis and regeneration through lineage tracing. Nat Commun. 8 (1), 14284(2017).
- Vickman, R. E., et al. The role of the androgen receptor in prostate development and benign prostatic hyperplasia: A review. Asian J Urol. 7 (3), 191-202 (2020).
- Likos, E., Bhattarai, A., Weyman, C. M., Shukla, G. C. The androgen receptor messenger RNA: what do we know. RNA Biol. 19 (1), 819-828 (2022).
- Karthaus, W. R., et al. Regenerative potential of prostate luminal cells revealed by single-cell analysis. Science. 368 (6490), 497-505 (2020).
- McCray, T., et al. Vitamin D sufficiency enhances differentiation of patient-derived prostate epithelial organoids. iScience. 24 (1), 101974(2021).
- De Felice, D., et al. Rarγ-Foxa1 signaling promotes luminal identity in prostate progenitors and is disrupted in prostate cancer. EMBO Rep. 2024 (2), 443-469 (2024).
- Crowley, L., et al. A single-cell atlas of the mouse and human prostate reveals heterogeneity and conservation of epithelial progenitors. eLife. 9, 1-24 (2020).
- Cambuli, F., et al. Intra-epithelial non-canonical Activin A signaling safeguards prostate progenitor quiescence. EMBO Rep. 23 (5), e54049(2022).
- Kuo, W. T., Odenwald, M. A., Turner, J. R., Zuo, L. Tight junction proteins occludin and ZO-1 as regulators of epithelial proliferation and survival. Ann N Y Acad Sci. 1514 (1), 21-33 (2022).
- Yazici, D., et al. The epithelial barrier: The gateway to allergic, autoimmune, and metabolic diseases and chronic neuropsychiatric conditions. Semin. Immunol. 70, 101846(2023).
- Zeyneloglu, C., et al. The epithelial barrier theory proposes a comprehensive explanation for the origins of allergic and other chronic noncommunicable diseases. FEBS Lett. 599 (22), 3208-3243 (2025).
- Blutt, S. E., Estes, M. K. Organoid Models for Infectious Disease. Annu Rev Med. 73 (1), 167-182 (2022).
Reprints and Permissions
