Many important reactive minerals are formed during in situ groundwater remediation; however, conventional drill core-based methods often present challenges in collecting these minerals. This article offers techniques for utilizing the Min-Trap, an innovative passive sampling device, to effectively collect and measure reactive minerals from conventional monitoring wells.
Method Article
Deployment and Retrieval of Mineral Samplers
In This Article
Summary
Abstract
Subsurface chemical, geochemical, and microbiological interactions, such as reactive mineral formation, gas generation, and contaminant sorption, play a critical role in shaping remediation strategies. However, evaluating these processes at the field scale is often limited by the expense and invasiveness of traditional sampling methods. The mineral trap sampler offers a practical, low-cost alternative for in situ monitoring of reactive mineral formation without requiring additional drilling or core extraction. Deployed within the screen interval of a monitoring well, the sampler passively collects mineral precipitates and microbial biomass over a period of at least thirty days. Once retrieved, the sampler is vacuum sealed and transported on ice to a laboratory for analysis using standard commercial techniques. This innovation enables scientists and engineers to assess both the rate and spatial distribution of mineral precipitation, providing valuable insights into subsurface conditions. By delivering actionable data on mineral formation and microbial activity, the mineral trap sampler supports performance evaluations and helps guide optimization strategies for remediation systems. Its simplicity and affordability make it a useful tool for improving site characterization and long-term management.
Introduction
Groundwater remediation of chlorinated solvents and metal contaminants often depends on the in situ formation, dissolution, or transformation of reactive minerals that degrade or sequester pollutants. Injection of organic carbon sources (e.g., lactate, molasses, emulsified vegetable oil) stimulates indigenous iron- and sulfate-reducing bacteria, which generate hydrogen sulfide and reduced iron. These react to form iron sulfide minerals -- primarily mackinawite (FeS) and pyrite (FeS2), that abiotically transform chlorinated volatile organic compounds (CVOCs)1,2,3,4,5,6.
Direct field verification of the formation of target reactive minerals can enhance the optimization of remedial strategies by promoting conditions that maximize mineral development and, consequently, the abiotic degradation potential of chlorinated volatile organic compounds (CVOCs). However, mineral formation assessments are typically inferred from aqueous-phase indicators (i.e., groundwater analyses), due to the considerable logistical and financial constraints associated with acquiring solid-phase samples7,8. Conventional assessment of reactive mineral formation relies on inferring solid-phase changes from aqueous-phase measurements. Direct solid-phase samples can be collected, but this requires high-cost, discrete drilling or coring for soil/rock sampling, which is also typically associated with limited spatial coverage and the inability to collect repeated samples to assess changes over time. Furthermore, drilling is associated with increased time, labor, and health-safety risks. These constraints often hinder the timely optimization of remedial strategies and definitive proof of reactive-mineral presence.
The Min-Trap, hereafter referred to as a mineral trap, is a low-cost, in situ sampling device designed for 2-inch diameter or larger monitoring wells. It consists of nylon-mesh "pillows" packed with a solid-phase matrix (e.g., silica sand or site material) enclosed in a slotted PVC housing9. Deployed for weeks to months under native groundwater flow, mineral traps capture precipitating minerals without intrusive drilling. Following this incubation period, mineral traps are removed from the monitoring well, and the sand pillows within the PVC casing are submitted for laboratory analysis to identify and quantify minerals captured during deployment. Further details of the mineral trap design specifications and the results of laboratory tank experiments and initial field results, including comparison against site soil core samples for validation, are available10.
The key advantages of the mineral trap approach include the following: direct physical evidence of reactive mineral formation, elimination of expensive, labor-intensive coring, repeatable sampling to track treatment progression, broad adaptability to any mineral-forming treatment, and customizability of pillow matrix (i.e., sand, clay, site soil, site soil with an added amendment, etc.).
Mineralogical data from the mineral traps can guide all stages of a remedial program, from initial site characterization and feasibility testing to remedy optimization and long-term monitoring. By providing a cost-effective tool for documenting and verifying mineral-driven treatment processes, the mineral trap enhances the reliability and transparency of groundwater remediation. The mineral trap is particularly applicable to monitoring reactive mineral formation during in situ chemical reduction (ISCR) and/or enhanced reductive dechlorination (ERD) to treat CVOCs. Data from mineral traps collected over time can be used to inform transitions from active to passive remediation phases.
In addition, the mineral trap is currently being adapted to facilitate the measurement of contaminant field distribution coefficients (Kd-field) to assess the feasibility of immobilizing contaminants, such as per- and polyfluoroalkyl substances (PFAS), in the subsurface as a treatment strategy. Ongoing experiments are utilizing mineral trap samplers as field-deployed microcosms to compare the Kd-field of unamended site soil to soil amended with colloidal carbon products. The employment of a mineral trap sampler in this approach displays clear marginal benefits by providing direct in situ contaminant groundwater/soil distribution comparisons between native site soil and the addition of sorbent-based amendments. This adaptation can provide important evidence for the design of colloidal carbon application to the subsurface as well as other potential applications.
The mineral trap sampler can be used to collect mineral precipitate samples from a variety of geochemical environments and assess different remediation processes. The protocol described below is generic and is generally appropriate for most applications. However, specific aspects, such as incubation times, sampling frequency, support matrix material, and analytical methods used, should be tailored to the specific anticipated geochemical process and site conditions.
Protocol
The reagents and the equipment used in this study are listed in the Table of Materials.
1. Site assessment planning
- Select the matrix to be used inside the mineral traps. See the Discussion section for more information about mineral trap matrices. If the standard Ottawa sand matrix is used, proceed to Field Deployment. If site soil is used, proceed to steps 1.1.1-1.1.2.
- Drill, core, or use other means to collect 250-300 g of material.
- Ship to the vendor for incorporation into the sampler.
NOTE: Depending on the project goals, cores may need to be shipped under anaerobic conditions using vacuum-sealed bags and oxygen scavenger packets.
2. Field deployment
- Obtain the unit from the vendor. Refer to Figure 1 for an image of the sampler provided by the vendor11.
- Purge the well, as if sampling.
- Tie nylon rope to the eyebolt on the top of the mineral trap housing and connect to the well cap using a rope length that reaches the desired end point within the well screen.
- Deploy mineral traps directly within the screened interval of the monitoring well, similar to other commercially available passive diffusion samplers, such as passive diffusion samplers (https ://itrcweb.org/teams/projects/diffusion-passive-samplers), Bio-Trap samplers (https ://microbe.com/bio-trap-samplers/), and Hydrasleeve samplers (https ://hydrasleeve.com/).
NOTE: Additional mineral traps can be attached together in a "daisy chain" fashion. - Attach a weight to the bottom eyebolt if needed to help reach deeper depths within the screen.
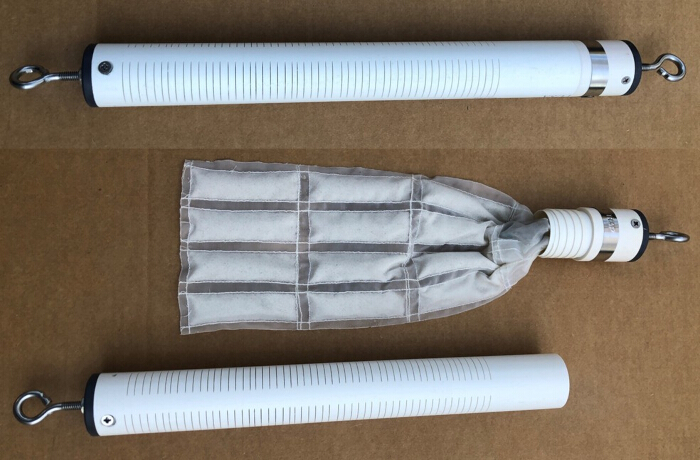
Figure 1: Mineral Trap sampler. Mineral Trap on its side (up is to the right), fully assembled (top), and ready for deployment in a monitoring well and opened (bottom), showing multiple distinct sand-filled "pillows" that can be individually removed and submitted for laboratory analysis. Many aspects of the mineral trap samplers are modifiable based on project needs. This includes the length of the housing unit, the dimensions of the mesh insert, and the number, dimensions, and material of the pillows. Adapted from Divine et al.11. Please click here to view a larger version of this figure.
3. Retrieval and preservation
- Leave the mineral trap sampler in the monitoring well for the desired deployment interval (typically 1-2 months).
NOTE: To determine an optimal deployment period, project managers may consult existing literature on ideal geochemical conditions for iron sulfide formation in enhanced reduction remediation strategies12. - Assemble the following materials for retrieval as shown in Figure 2, including the following: vacuum sealer and vacuum sealer bags (alternatively, anaerobic GENbags may also be used), electric power source (if needed), scissors, camera, a white board (at least 24 inches across), dry erase markers, ruler, permanent markers, 1-gal sealable polyethylene bags, paper towels, coolers, and ice.
- Arrange the work area to ensure swift and efficient mineral trap retrieval.
- Fill the coolers with ice.
- Label the sample bag with the site name, well name, sampling date, destination laboratory, desired analysis, and sampler initials.
- If a vacuum sealer rather than a GENbag is being used, seal three of the four sides of the bag, leaving one side open to insert the mineral trap samples.
- Start a timer to ensure that less than 15 min elapse from the time that the unit is pulled from the well until the pillows are vacuum sealed13.
- Carefully pull the nylon line to remove the mineral trap from the well.
- Denote any precipitate (i.e., grey, black, or brown material) on or odors from the mineral trap housing.
- Photograph the appearance of the housing.
- Unscrew the top of the mineral trap to expose the inner mesh insert of material-filled pillows (Figure 3).
- Denote and/or photograph any precipitate on the mesh insert.
- Use scissors to cut the loop or zip tie that secures the mesh insert to the top of the housing unit.
- Place the mesh insert inside the GENbag or vacuum seal bag and seal immediately.
- Double bag the sampler in a large (i.e., one-gallon) zippered bag.
- Photograph the sample.
- Place the sample in the cooler on ice immediately.
- Stop the timer and record the time elapsed in the field logbook.
- Repeat as needed for each well, being sure to always keep the samples on ice.
- Complete the chain of custody.
- Securely package the cooler and ship it to the laboratories for overnight delivery.
NOTE: The maximum hold time before reaching the laboratory is 48 h. Ensure that samples are never colder than -18 °C. Cryogenic sample storage (about -78°C) may induce the conversion of mackinawite to pyrite prior to analyses14. This effect was not evidenced when samples were stored under modest freezing conditions (-18 °C.)15. Samples collected with mineral traps are viable for many analyses. Table 1 below provides analytical methods that have been used on mineral trap samples, as well as references as applicable. The high quartz content of the standard silica sand matrix may preclude the use of XRD analyses, so alternative support media types could be considered to permit the more effective use of XRD.
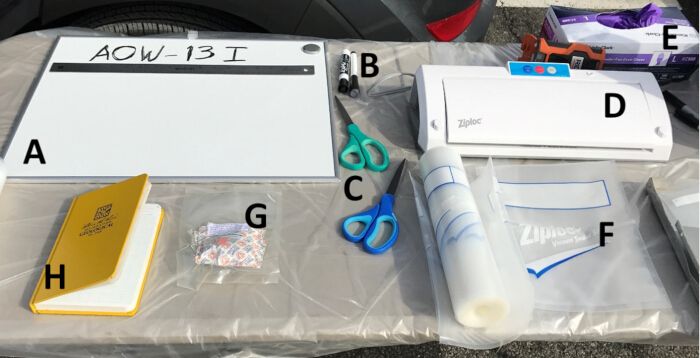
Figure 2: Photograph showing field equipment (clockwise from upper left corner). (A) Whiteboard; (B) dry erase markers; (C) scissors (green and blue); (D) vacuum sealer; (E) box of latex gloves; (F) vacuum seal bags; (G) food storage oxygen absorber packets; and (H) field notebook. Adapted from Divine et al.11. Please click here to view a larger version of this figure.
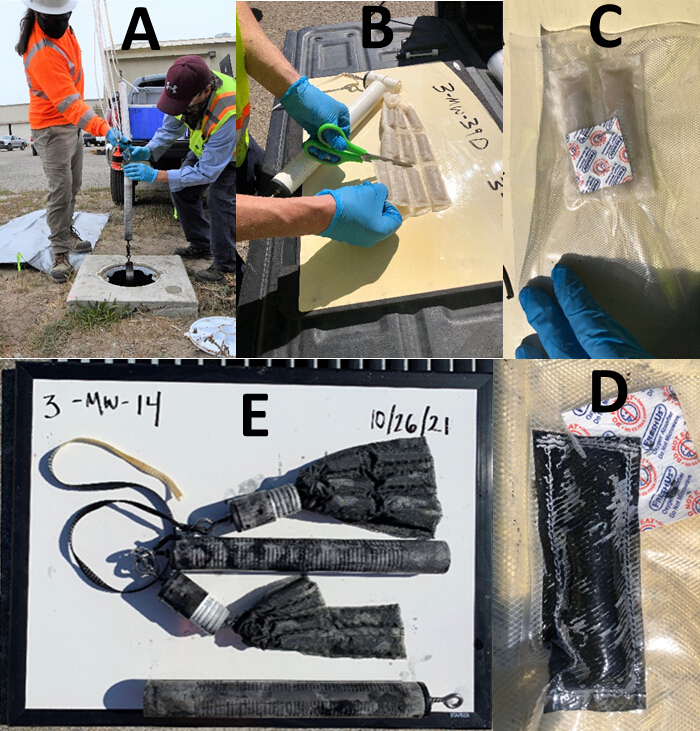
Figure 3: Photographs showing field equipment (clockwise from upper left corner). (A) Mineral trap removal from monitoring well; (B) cutting and separating individual mineral trap pillows; (C) two mineral trap pillow samples sealed with an oxygen absorbent; (D) two mineral trap pillow samples sealed with an oxygen absorbent (note the black coloration indicative of the presence of iron sulfide minerals); (E) two recovered and opened mineral trap prior to sampling (note the black coloration indicative of the presence of iron sulfide minerals). Adapted from Divine et al.11. Please click here to view a larger version of this figure.
Results
Four representative example applications of mineral traps to document the formation of target minerals are presented below.
Example 1
In situ bioremediation has been implemented at the site for over 10 years through the injection of a soluble, fermentable carbon source to treat trichloroethene and related compounds. Aqueous geochemical data from monitoring wells indicate that sulfate-reducing conditions have persisted for many years, while elevated concentrations of cis-1,2-DCE and other daughter products confirm that microbially mediated reductive dechlorination processes are well established. To verify active iron sulfide formation, mineral trap samplers were deployed at the site. The mineral trap samplers were installed in monitoring wells for approximately five months, after which the samples were analyzed for total iron, AMIBA, and Scanning Electron Microscopy-Energy Dispersive X-Ray Spectroscopy (SEM-EDS). Elevated concentrations of total Fe (100 mg/kg), CrES Fe²⁺ (44 mg/kg), and CrES (41 mg/kg) were observed. Elemental mapping from SEM-EDS images (Figure 4) clearly demonstrates the co-location of iron and sulfur. Collectively, these findings provide strong evidence that remediation activities resulted in active in situ precipitation of iron sulfides. In contrast, the absence of extractable Fe²⁺ and sulfide, together with a lack of co-located iron and sulfur in SEM-EDS analyses, would indicate that iron sulfides were not present in the sample.
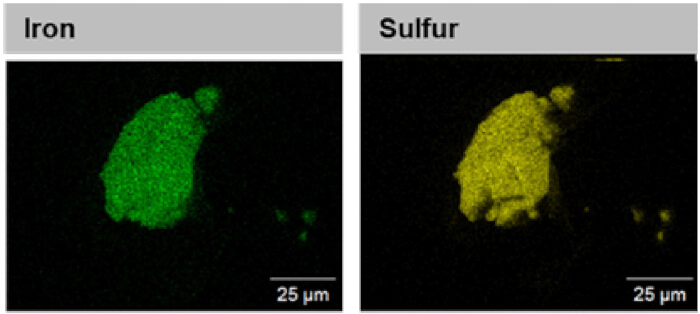
Figure 4: SEM-EDS element maps of this mineral trap sample showing the spatial locations of Fe and S (middle and right). Scale bars: 25 µm. Adapted from Divine et al.15. Please click here to view a larger version of this figure.
Example 2
Groundwater contaminated with dissolved nickel was treated by injecting a soluble, fermentable carbon source to promote mineral precipitation of nickel via microbially mediated formation of solid-phase nickel sulfides (NiS). Reductions in dissolved nickel concentrations were observed in monitoring wells, and mineral trap samplers were used to confirm that these decreases resulted from nickel precipitation as NiS. Mineral traps containing sterile sand were deployed in monitoring wells for 64 days, after which the samples were analyzed for total nickel, nickel measured by Simultaneously Extracted Metals/Acid Volatile Sulfide (SEM/AVS) analysis, which indicates Ni-S complexes, and Scanning Electron Microscopy-Energy Dispersive X-Ray Spectroscopy (SEM-EDS). Elevated nickel concentrations were detected in all mineral trap samples, with total nickel ranging from 5.2 to 89 mg/kg and SEM/AVS-extractable nickel ranging from 3.7 to 100 mg/kg. Elemental mapping from an SEM-EDS image of one sample (Figure 5) demonstrates the co-location of nickel and sulfur. Taken together, these results confirm that remediation activities resulted in the in situ precipitation and sequestration of nickel, including as NiS. In addition, total iron measurements and other SEM data suggest that a portion of the nickel may also be associated with non-sulfide iron minerals (data not shown).
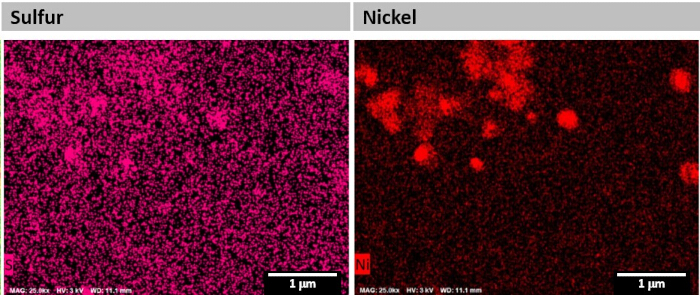
Figure 5: SEM-EDS element maps of a mineral trap sample showing the spatial locations of S (left) and Ni (right). Scale bars: 1 µm. Adapted from Divine et al.11. Please click here to view a larger version of this figure.
Example 3
A mineral trap containing sterile soil was deployed at a site where a soluble fermentable carbon solution was injected, and the subsurface was modestly heated (increase in temperatures of about 5-15 °C) to promote in situ bioremediation16. After an incubation period of approximately four months, the mineral trap sample was analyzed for microbiological characteristics via Microbial Insight's advanced qPCR methods known as QuantArray-MIC and CENSUS qPCR-AHY analyses (https://microbe.com/quantarray-mic/). These data (Figure 6) provide insight into redox poise/geochemical conditions and abundance of key microbial groups relevant to the formation of reactive iron mineral species. The mineral trap matrix was sterile upon deployment, so all microorganisms detected by qPCR represent in situ colonizers that established during the incubation period. For example, three of the most abundant targets in the mineral trap sample were identified as fermenters (FER), IRB, and SRB (identified as APS in Figure 6), which indicate active microbial processes consistent with the observed redox conditions. Fermenters are anaerobic bacteria that metabolize organic carbon substrates to produce organic acids and hydrogen. Hydrogen production, in turn, supports the growth of other MIC-associated organisms, including SRB. IRB reduces insoluble ferric iron to soluble ferrous iron, potentially facilitating the availability of ferrous iron for reactive iron mineral formation. SRB consume hydrogen and produce hydrogen sulfide. Hydrogen sulfide, in turn, can react with available ferrous iron to form reactive iron sulfides. While DNA-based methods do not directly quantify enzyme activity, the presence and dominance of these organisms in a previously sterile substrate strongly support ongoing biogeochemical reactions contributing to reactive mineral formation. Overall, the results provide useful insight into the relative abundance of key microbial groups involved in redox reactions and the formation of reactive iron sulfide minerals. These results are consistent with and explain the more than 99.9% reduction in CVOC concentrations at this well and a significant shift in molar mass to ethene and ethane (Figure 7), and the associated decrease in chlorine number (the average number of chlorines for the chlorinated ethenes measured in the sample). These results highlight that reductive dechlorination has been enhanced and is proceeding through detoxification.
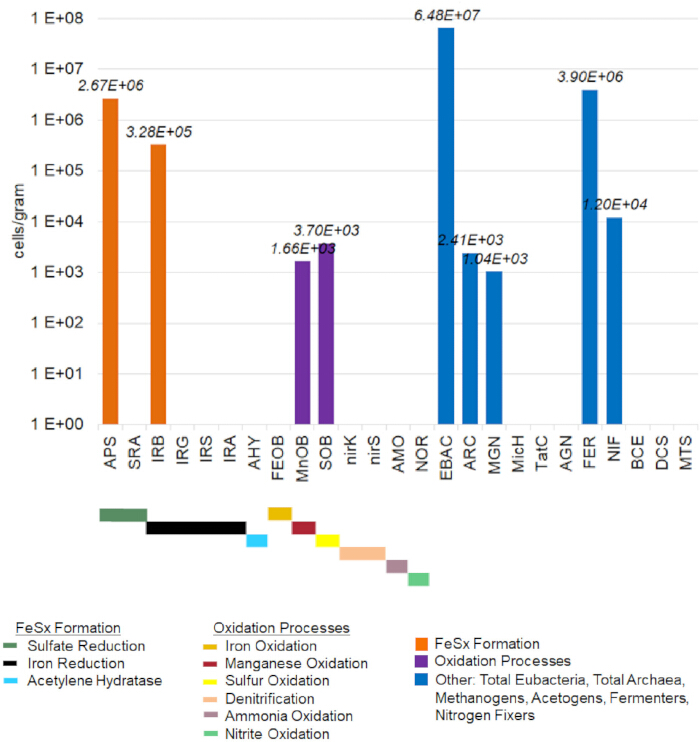
Figure 6: QuantArray-MIC and CENSUS qPCR-AHY results from a mineral trap collected from a monitoring well after a 4-month incubation period. Adapted from Divine et al.11. Please click here to view a larger version of this figure.
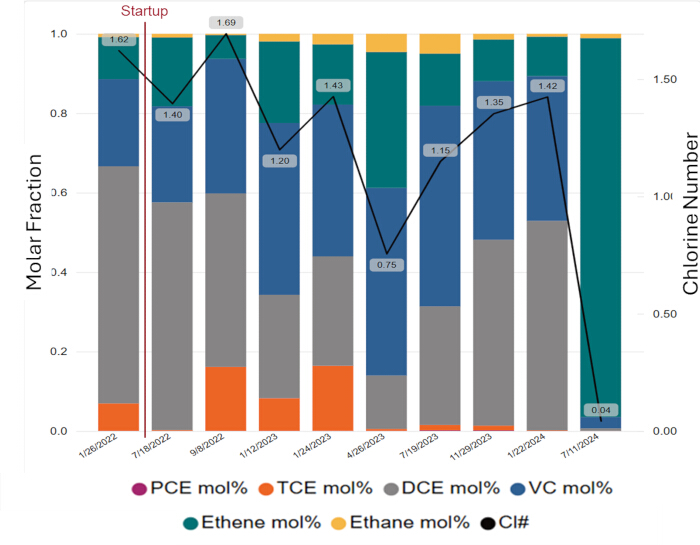
Figure 7: Changes in time in molar mass from more chlorinated ethenes to ethene and ethane in groundwater concentrations, and the associated decrease in chlorine number (the average number of chlorines for the chlorinated ethenes measured in the sample). Please click here to view a larger version of this figure.
Example 4
Mineral traps can be used in situ to efficiently measure relative contaminant distribution between soil and groundwater. Because mineral trap samplers operate under flowing, biogeochemically active field conditions, the values represent effective distribution coefficients (Kd-eff) that encompass both sorptive and microbially mediated retention processes rather than equilibrium batch sorption parameters. As such, Kd-eff may be more useful than laboratory-derived Kd values as it represents actual sorption behavior observed in the field. As a pilot study, mineral traps with a customized support matrix were deployed at a site contaminated with per- and polyfluoroalkyl substances (PFAS) to calculate site-specific PFAS Kd-eff values and to determine the efficacy of contaminant sorption onto a colloidal carbon product. In this experimental design, three mineral traps were deployed in separate wells for 30 days. The mineral trap pillows were filled with either site soil, Ottawa sand (to determine the sand's suitability as a proxy for site soil), or site soil mixed with an activated carbon remediation product. Upon retrieval of the traps, groundwater was also collected from each well, and the groundwater and three matrices from each location were analyzed via EPA method 1633. The individual and summed PFAS sorption coefficients were calculated by dividing the concentration in the solid (mg/kg) by the concentration in the groundwater (mg/L). Summed PFAS Kd-eff values, calculated for each monitoring well and matrix, are shown in Figure 8 below.
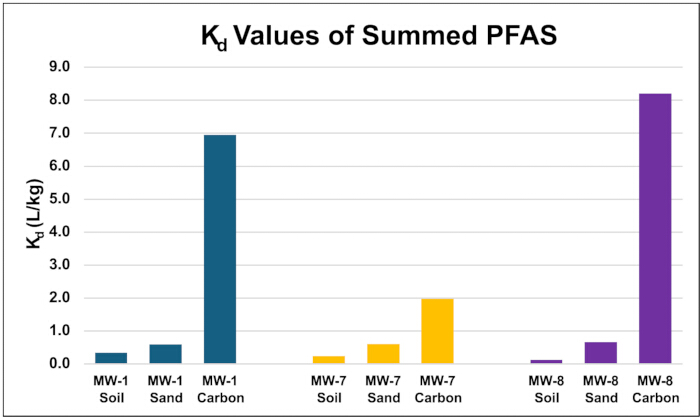
Figure 8: Sorption coefficients of summed PFAS by location and matrix. These results demonstrate that the activated carbon remediation product dramatically increased sorption of the contaminants. Please click here to view a larger version of this figure.
16S rRNA amplicon sequencing was also conducted on each matrix from each location for exploratory purposes. While the composition of microbial communities seems to correlate more closely with support matrix than with well location (Figure 9), more datasets are expected to elucidate patterns in PFAS-related bacteria.
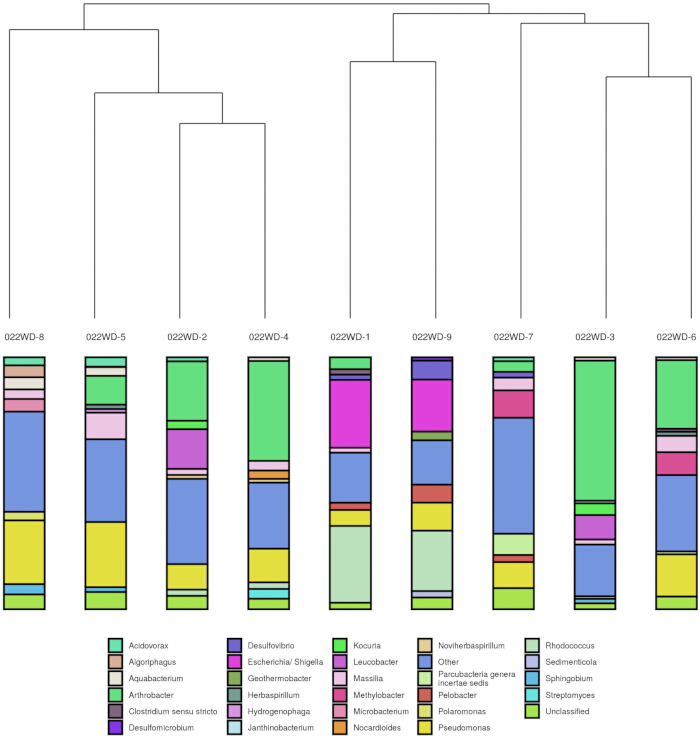
Figure 9: A hierarchical clustering dendrogram of the genus-level classifications from the mineral trap samples. The samples that are more similar to each other are grouped together, so shorter bars denote more similarity. For example, sample MW-7 Carbon is similar to MW-1 Carbon but very dissimilar to MW-8 Sand. Please click here to view a larger version of this figure.
Taken together, these results demonstrate the value of mineral trap samplers for addressing emerging contaminants and informing remediation strategies. The approach enables quantification of effective contaminant sorption and in situ sampling of microbial communities in PFAS-impacted groundwater. Importantly, the technique is most useful as a comparative tool, for example, evaluating the relative performances of different sorbents between traps, rather than as a means to directly reflect equilibrium conditions within the subsurface.
| Analysis | Objective | Use Study | |
| Aqueous and Mineral Intrinsic Bioremediation Assessment (AMIBA) • Acid volatile sulfide (AVS) • Chromium extractable sulfides (CrES) • Strong acid soluble ferrous and ferric iron (SAS-Fe) • Weak acid soluble ferrous and ferric iron (WAS-Fe) | Iron and sulfur biogeochemistry | Ulrich et al. (2021a) Divine et al. (2023a) | |
| Scanning Electron Microscopy/Energy Dispersive X-Ray Spectroscopy (SEM/EDS) | Mineralogy and elemental composition | Divine et al. (2023a) | |
| Total metals, including total iron (USEPA methods 3050B and 6020) | Metal composition | Divine et al. (2023a) | |
| X-Ray Diffraction (XRD)* | Crystalline mineral identification | ||
| Magnetic Susceptibility | Magnetite composition | ||
| Quantitative polymerase chain reaction (qPCR) and QuantArray | Microbial population concentration | Divine et al. (2023a) | |
| DNA Sequencing (16S rRNA, ITS) | Microbial community composition | ||
Table 1: Potential Analyses applicable to samples collected with mineral trap samplers.
Discussion
Several steps in the protocol are critical for its success. First, all preparatory actions that enable quick and efficient mineral trap retrieval are essential to prevent sample exposure and maintain integrity. Most importantly, mineral traps must be placed under anaerobic conditions as soon as possible after retrieval.
Protocol modifications to accommodate the procurement of the mineral trap matrix may be necessary if a non-standard matrix is selected. The standard design utilizes Ottawa silica sand. Advantages to this matrix include its high hydraulic conductivity and porosity, similarity to materials in many sandy alluvial aquifers, and absence of ferrous iron content9. Site soil is a common non-standard matrix, so instructions for site soil procurement have been included in the main protocol. Soil or sand mixed with remediation products such as colloidal carbon may also be used in mineral traps. Additionally, the protocol may be adapted to reflect best practices for different field crews, considering personnel and documentation requirements.
The mineral trap sampler addresses many challenges associated with drilling and coring for mineralogical sampling, but it also has its own limitations. First, the sampling matrix within the mineral trap may not accurately represent the site's aquifer material. For example, the standard Ottawa sand works well in sandy aquifers but is less representative of silty or clay-rich environments. Site soil is often used as an alternative, though it can be difficult to obtain. Additionally, because mineral traps must be deployed in monitoring wells, sampling locations are restricted to existing wells or boreholes. Finally, data from mineral trap samplers should not be considered a direct substitute for bulk geochemical sampling.
Mineral traps have several additional potential applications beyond the examples described above. These include remediation approaches aimed at precipitating other metal contaminants, such as arsenic, chromium, and uranium, as sulfides, iron oxides, or phosphate minerals through the injection of reductants, oxidants, phosphates, and/or acid or base solutions. The procedure described above is expected to be broadly applicable; however, alternative analytical methods may be required for sample analysis depending on the target contaminant and mineral phase.
Disclosures
Authors Taggart and Ward are employed by Microbial Insights, which is exclusively licensed to manufacture and sell Min-Traps. Authors Divine, Justicia-León, Martin Tilton, Carter, and Zardouzian are employed by Arcadis, which is the Min-Trap Patent Assignee.
Acknowledgements
Funding and support for this work were provided through Satellite, the global innovation program for Arcadis (http://www.lovinklaan.nl/en/programs/imagine-satellite/), and ESTCP (Project ER19-5190).
Materials
| Name | Company | Catalog Number | Comments |
|---|---|---|---|
| 18-in stainless ruler | Staples (www.staples.com) | 2772901 | Alternate models may be acceptable |
| 1-gal sealable polyethylene bags | Staples (www.staples.com) | 24401543 | Alternate models may be acceptable |
| 2200-Watt Honda Generator | Home Depot (www.homedepot.com)) | 316604378 | Alternate models may be acceptable |
| 5-gm food storage silica gel oxygen sorbent packets | Amazon (www.amazon.com) | 7.47607E+11 | Alternate models may be acceptable |
| Coolers | Staples (www.staples.com) | 24299978 | Alternate models may be acceptable |
| Digital camera | Alternate models may be acceptable | ||
| dry erase markers | Staples (www.staples.com) | 24398946 | Alternate models may be acceptable |
| Dry-erase white board (at least 24 inches across) and | Staples (www.staples.com) | 814930 | Alternate models may be acceptable |
| GENbag Anaerobic | bioMérieux (https://biomerieuxdirect.com/biomerieux) | 45534 | Can be used as an alternative to a vacuum sealer, anaerobic GENbags (https://biomerieuxdirect.com/), which are airtight bags that contain a generator sachet that absorbs oxygen and releases carbon dioxide, can be used to rapidly produces an anaerobic atmosphere for Min-Trap sample preservation and storage. |
| Ice | Local convenience store | ||
| Min-Trap Samplers | Microbial Insights, Inc. (https://microbe.com/min-trap-sampler/) | NA | (US Patent 11,002,643 B1) |
| Nylon Rope | Staples (www.staples.com) | 191591 | Alternate models may be acceptable |
| Paper towels | Staples (www.staples.com) | 2126874 | Alternate models may be acceptable |
| Permanent marker | Staples (www.staples.com) | 125328 | Alternate models may be acceptable |
| Scissors | Staples (www.staples.com) | 24380498 | Alternate models may be acceptable |
| Vacuum sealer | Cabelas (www.cabelas.com) | 100113832 | Alternate models may be acceptable |
| Vacuum sealer bag roll (8-on) | Cabelas (www.cabelas.com) | 2514954 | Alternate models may be acceptable |
References
- He, Y. T., Wilson, J. T., Su, C., Wilkin, R. T. Review of abiotic degradation of chlorinated solvents by reactive iron minerals in aquifers. Ground Water Monit Remediat. 35, 57-75 (2015).
- Horst, J., et al. New tools for assessing reactive mineral-mediated abiotic contaminant transformation. Ground Water Monit Remediat. 39 (2), 12-21 (2019).
- Horst, J., Munholland, J., Hegele, P., Klemmer, M., Gattenby, J. In situ thermal remediation for source areas: technology advances and a review of the market from 1988-2020. Ground Water Monit Remediat. 41, 17-31 (2021).
- Jeong, H. Y., Hayes, K. F. Reductive dechlorination pathways of tetrachloroethylene and trichloroethylene and subsequent transformation of their dechlorination products by mackinawite (FeS) in the presence of metals. Environ Sci Technol. 41 (22), 7736-7743 (2007).
- Lee, W., Batchelor, B. Abiotic reductive dechlorination of chlorinated ethylenes by iron-bearing minerals. 1. Pyrite and magnetite. Environ Sci Technol. 36 (23), 5147-5154 (2002).
- Lee, W., Batchelor, B. Abiotic reductive dechlorination of chlorinated ethylenes by iron-bearing minerals. 2. Green rust. Environ Sci Technol. 36 (24), 5348-5354 (2002).
- Whiting, K., et al. Factors controlling in situ biogeochemical transformation of trichloroethene: field study. Ground Water Monit Remediat. 34, 79-94 (2014).
- Lebrón, T. H., et al. Development and validation of a quantitative framework and management expectation tool for the selection of bioremediation approaches at chlorinated ethene sites. ESTCP Project ER-201129. , (2015).
- Ulrich, S., et al. Laboratory and initial field testing of the Min-Trap for tracking reactive iron sulfide mineral formation during in situ remediation. Remediat J. 31 (3), 35-48 (2021).
- In-situ device for collecting minerals. United States Patent. , US 11002643 B1 (2021).
- Divine, C., et al. Field methods and example applications for the Min-Trap mineral sampler. Remediat J. 33, 209-216 (2023).
- Horst, J., McCaughey, M., Justicia-Leon, S., Tillotson, J., Divine, C. Viewing the end from the beginning: designing for the transition to long-term passive phases of in situ chlorinated solvent treatment. Ground Water Monit Remediat. , (2022).
- Wilkin, R. T. Mineralogical preservation of solid samples collected from anoxic subsurface environments. EPA/600/R-06/112. , (2006).
- Hua, H., et al. Impacts of cryogenic sampling processes on iron mineral coatings in contaminated sediment. Sci Total Environ. 765, 142796(2021).
- Divine, C., et al. Min-Trap samplers to passively monitor in-situ iron sulfide mineral formation for chlorinated solvent treatment. Ground Water Monit Remediat. 43 (3), 57-69 (2023).
- Divine, C., et al. Final project report: Demonstration of mineral traps to passively evaluate and monitor in-situ reactive minerals for chlorinated solvent treatment. ESTCP Project ER19-5190. , (2019).
Reprints and Permissions
