This study presents a rapid ddPCR method for quantifying soil microbial biomass and fungal-to-bacterial ratios. Although ddPCR-derived microbial biomass carbon shows only weak correlation with chloroform fumigation estimates, the method provides a sensitive, scalable molecular approach for assessing microbial abundance without additional soil sampling or the use of harsh chemicals.
Method Article
Determination of Microbial Biomass in Soil using Digital Droplet PCR (ddPCR)
In This Article
Summary
Abstract
Soil represents the largest terrestrial pool of organic carbon, yet more than 133 Gt of carbon has been lost from soils over the past two centuries. Accurate quantification of soil microbial biomass, particularly fungi and bacteria, the primary decomposers driving carbon and nutrient cycling, is essential for understanding soil ecological functioning and health. Conventional approaches, including chloroform fumigation extraction and PLFA analysis, are limited by high sample requirements and uncertainties associated with converting biochemical markers into microbial biomass estimates. Here, we present an optimized workflow for quantifying bacterial and fungal abundance in soil using digital droplet PCR (ddPCR) targeting the 16S and 18S rRNA genes. The method enables absolute quantification of microbial gene copies, conversion to cell numbers using gene copy number correction factors, and subsequent estimation of microbial biomass carbon. We applied this protocol to soils from five globally distributed agricultural systems differing in soil texture, land use, and organic matter content. ddPCR-derived estimates were compared with conventional chloroform fumigation estimates of microbial biomass carbon. ddPCR provided high-resolution quantification of microbial abundance and produced broader and more sensitive estimates of F:B ratios across soil types than whole genome sequencing. Although ddPCR-derived MBC showed only a weak correlation with chloroform fumigation values, this method offers an effective molecular approach for assessing microbial biomass and ecological indicators such as the F:B ratio. This protocol provides a reproducible and scalable strategy for integrating microbial abundance measures with compositional analyses to advance soil health assessment.
Introduction
Soil is the largest terrestrial organic carbon pool, holding more carbon than vegetation and atmospheric carbon combined1. Over 133 gigatons (Gt) of carbon have been lost from soils in the past 200 years, and ongoing efforts to restore and maintain soil carbon stocks are vital for global soil health2. Given the immense carbon storage capacity of soils, accurately determining the major contributors to these carbon stocks is fundamentally important3. Microbes play a fundamental role in nutrient cycling within soil, and microbial biomass represents a significant component of soil organic carbon (SOC)3. Fungi and bacteria are the principal decomposers in soil environments and are essential in the biogeochemical cycles of these ecosystems4,5. In bacterial-dominated soil, organic matter decomposition and nutrient mineralization are much faster than in a fungal-dominated5. The fungal-to-bacterial (F:B) ratio is increasingly employed as an indicator of soil health6,7; therefore, accurate assessment of both fungi and bacteria is critical.
Microbial biomass estimations in soils often rely on disruptive chemical treatments, such as chloroform fumigation8. Other approaches selectively target the active microbial community through techniques like substrate-induced respiration or phospholipid fatty acid (PLFA) analysis9. PLFA analysis has been widely used to assess microbial community composition and estimate the F:B ratio. However, significant variation in cell size across different fungal and bacterial species introduces uncertainty when converting PLFA concentrations into biomass or population-based F:B ratios, rendering such estimations potentially unreliable10. Other methods, such as flow cytometry, can be used to increase sample throughput for determining bacterial abundance in soils; however, their accuracy may be reduced due to non-microbial particles having similar size, shape, and autofluorescence characteristics to the microbes11. Chloroform fumigation requires a relatively large amount of soil (>10 g) to estimate microbial biomass, whereas a sample size of 500 mg of soil is sufficient for DNA-based methods when performing extractions with commercial kits. A previous comparison between DNA-based methods and chloroform fumigation showed that although both approaches were capable of estimating microbial biomass, using them in conjunction provided a more robust assessment of soil microbial biomass12.
Microbial community assessments are an under-utilized metric of soil health that has the potential to transform how we measure and understand soils13. Metabarcoding approaches are conventionally used to determine the soil microbial community, with relative bacterial abundances assessed by amplifying regions of the 16S rRNA gene, while fungal taxa are targeted using the 18S rRNA gene or internal transcribed spacer (ITS) region14. Metabarcoding approaches for fungi may rely on different genomic target regions, affecting the diversity and abundance of the fungal species identified. The uneven ITS length among fungal species may promote preferential amplification and sequencing, therefore incorrect estimation of their abundance, leading to an incorrect evaluation of fungal communities15. The Fungiquant primers were developed to target specific variable regions within the 18S rRNA gene that show comprehensive coverage of diverse fungi and specificity compared to other eukaryotes16.
Most bacteria and fungi have more than one copy of the targeted gene, which leads to biased cell count estimates. Furthermore, fungi often have multinucleate cells with variable numbers of nuclei per cell6. There is considerable rRNA gene copy number variation both within and among taxonomic groups, typically totalling less than 15 copies in prokaryotes, and estimated to range between 28 and 511 for fungi17. Due to this variation, molecular techniques that are used to analyze microbial community structures are considered semi-quantitative, as they can skew the estimation of species relative abundance in a community18. Measured gene copy numbers (GCN) are routinely converted to cell abundances using the estimated average GCN in the taxonomic group of interest18,19,20.
Some studies have used metagenomic approaches, as they offer several advantages over metabarcoding, including the elimination of amplification bias and the ability to examine the entire microbial community comprehensively21. In addition, they enable simultaneous comparison of fungal and bacterial compositions, as well as their relationships to each other22. In general, RT qPCR is commonly employed to detect microbial content and function23. qPCR has limitations when compared to digital droplet PCR (ddPCR) for absolute quantification due to its sensitivity to inhibitors, as it requires an external standard24.
ddPCR is a breakthrough technology that relies on partitioning individual amplification reactions into separate droplets. The template is subsequently amplified by PCR in every single droplet as a separate reaction. ddPCR has low sensitivity to enzymatic inhibitors, better precision, repeatability, sensitivity, and stability in bacterial and fungal quantitation than qPCR25. Furthermore, it is a method that can be utilised for absolute quantification of bacteria and fungi in soil5. Since ddPCR relies on the same extracted DNA used to assess microbial compositional shifts, abundance data from ddPCR can be directly linked to community composition data26 and be used to quantify the soil microbial biomass.
This study provides a methodology for the quantification of fungi and bacteria in soils using digital droplet PCR (ddPCR). This optimized method was applied to soils from five different global locations and land uses. Sample locations were selected to encompass a broad spectrum of soil properties, environmental conditions, and management practices, thereby enabling evaluation of the robustness and generality of our approach across diverse settings. These data enabled the determination of the F:B ratio as a molecular bioindicator of soil ecological quality. Finally, a comparison of estimated microbial biomass between the microbial ddPCR data and conventional chloroform fumigation methods was performed.
Protocol
An overall schematic of these protocols is shown in Figure 1. The reagents and the equipment used are listed in the Table of Materials.
1. Soil Sampling
- Collect composite topsoil samples (0–20 cm) from five global locations, with three samples from randomly selected points within a 25 m area from each location.
NOTE: All samples were collected from agricultural systems representative of the regional land-use in which they were situated. Soil texture was characterised using laser diffraction, measured by a laser diffraction particle size analyzer (Table 1). Samples were transported at ambient temperature and stored at 4 ˚C until further analysis.
2. DNA extraction
NOTE: Perform the DNA extraction using a soil DNA extraction kit following the manufacturer's instructions. Room temperature for all the steps was 20 ˚C.
- Spin the 2 mL bead-beating tube briefly to ensure that the beads have settled at the bottom. Add 100 mg of soil and 800 µL of Solution CD1. Vortex briefly to mix.
- Homogenize samples thoroughly using a bead mill homogenizer, with samples lysed for 40 s at 6 m s−1.
- Centrifuge a bead beating tube for mechanical cell lysis at 15,000 x g for 1 min at room temperature.
- Transfer the supernatant to a clean 2 mL microcentrifuge tube.
NOTE: The supernatant may still contain soil particles. - Add 200 µL of Solution CD2 and vortex for 5 s.
- Centrifuge at 15,000 x g for 1 min at room temperature.
- Transfer up to 700 µL of supernatant to a clean 2 mL microcentrifuge tube, avoiding the pellet. The pellet should be visible.
- Add 600 µL of Solution CD3 and vortex for 5 s.
- Load 650 µL of the lysate onto a spin column and centrifuge at 15,000 x g for 1 min at room temperature.
- Discard the flow-through and repeat step 2.9 to ensure that all of the lysate has passed through the spin column.
- Place the spin column into a clean 2 mL collection tube.
- Add 500 µL of Solution EA to the spin column. Centrifuge at 15,000 x g for 1 min at room temperature.
- Discard the flow-through and place the spin column back into the same 2 mL collection tube.
- Add 500 µL of Solution C5 to the spin column. Centrifuge at 15,000 x g for 1 min at room temperature.
- Discard the flow-through and place the spin column into a new 2 mL collection tube.
- Centrifuge at up to 16,000 x g for 2 min at room temperature.
- Place the spin column into a new 1.5 mL elution tube.
- Add 50–100 µL of Solution C6 to the centre of the white filter membrane.
- Centrifuge at 15,000 x g for 1 min at room temperature. Discard the spin column and save the elute at -20 °C.
3. Quantification of purified DNA
NOTE: Purified DNA was quantified using a fluorometer and a double-stranded (dsDNA) Broad range (BR) assay kit following the manufacturer's instructions.
- Prepare a working solution using a 199:1 ratio of buffer to reagent.
- Add 10 µL of each DNA standard to 190 µL of the working solution.
- Add 1–20 µL of purified DNA to 180–199 µL of working solution. The final volume should be 200 µL. Vortex and incubate standard and DNA samples at ambient temperature for 2 min.
- Analyze the standards before the DNA samples on the fluorometer using the on-screen instructions.
4. Primer choice
- For the analysis of soil microorganisms, select specific primers based on relevant references. For bacteria, 16S rRNA primers were used25,27, and for fungi, 18S rRNA primers16.
- Perform amplification using the DNA-binding dye-based real-time PCR (qPCR) master mix and a thermal cycler. The primer sequences are provided in Table 2.
5. Microbial quantification using ddPCR
- Thaw and vortex all reagents on ice.
- Set up the ddPCR reaction as follows: 0.1 µL (10 µM) forward and 0.1 µL (10 µM) reverse 16S or 18S primer, 10 µL ddPCR Evagreen Supermix, 0.5 ng template DNA X µL, using nuclease-free water (NFW) to adjust the final reaction volume to 22 µL. Create a negative control by adding NFW instead of the template for each column.
- Place the DG8 into the cartridge holder.
- Place a total of 20 µL of the reaction mix into the sample wells in the cartridge.
- Add 70 µL of Droplet Generation Oil for Evagreen into the cartridge well labelled ‘oil’.
- Place the cartridge into the droplet generator and cover the cartridge with a gasket.
- Transfer 40 µL of the generated droplets to a 96-well (semi-skirted) plate for PCR amplification.
- Seal the 96-well plate using the plate sealer (Temperature, 180 ˚C for 5 s).
- Use the following cycling conditions with a heated lid set at 105 ˚C.
NOTE: (a) Bacteria: 98 ˚C for 5 min, 40 cycles of; 94 ˚C for 30 s, 61˚C for 60 s, 5 min at 4 ˚C, 10 min at 98 ˚C. (b) Fungi: 95 ˚C for 5 min, 40 cycles of; 95 °C for 30 s, 55 °C for 1 min, 72 °C for 30 s, 5 min at 4 °C, and 5 min at 90 °C. - Transfer the 96-well plate to the plate reader.
- Evaluate the copy concentration of each well using QuantaSoft version 2.1. Adjust the threshold of the amplitude to separate negative and positive droplets.
- Calculate the number of gene copies per ng of DNA in the reaction by multiplying copies/µL by the final reaction volume (20 µL) and dividing by the total template DNA input into the reaction as follows: (copies µL-1 x reaction volume) / Total DNA input into reaction.
- Calculate the total gene copies per ng of DNA extracted by multiplying the gene copies per ng by total DNA extracted (ng) as follows: (gene copies per ng x total DNA extracted).
- Calculate the gene copies per gram by dividing total gene copies per ng of DNA extracted by the amount of dry weight of soil processed in the extraction (g), as follows:
gene copies per gram = (total gene copies per ng of DNA extracted / gram dry weight of soil (gdw) of soil processed in the extraction). - Calculate the cell count per gdw by converting the gene copies using the average gene copy number (GCN) following the equation:
Cell count = gene copies per gram / Mean gene copies cell-1). - Convert the cell numbers to Microbial biomass carbon (MBC) using the following equation:
MBC for 16S (mg C g-1 soil) = cells gdw-1 × (100 fg cell-1) × 10−15 (g fg-1) × 103(mg g-1)28
MBC for 18S (mg C g-1 soil) = cells gdw-1 × (6 fg cell-1) x 10−12 (g fg-1) × 103 (mg g-1)29
The complete process is explained in Figure 2.
NOTE: The average 16S rRNA gene copy (mean ± SD) for 46 bacterial phyla20 was calculated and used as a correction factor for bacteria, with a final value of 2.48. While for fungi, the gene copy number was calculated with a correction factor of 113 according to Lofgren et al.17. Microbial biomass carbon (MBC) was estimated from ddPCR-derived cell counts, using assumed cellular carbon contents of 100 fg per bacterial cell28, and 6 pg per fungal cell29.
6. Soil molecular analysis from whole genome sequencing
- Prepare the sequencing library following the Oxford Nanopore Technologies SQK-NBD114 protocol, using the Native Barcoding Kit 24 V14 (SQK-NBD114.24) (see Table of Materials). Ensure to use one barcode, provided in the kit, for each sample.
- Sequence the prepared library using an Oxford Nanopore Technologies R10.4.1 flowcell.
- Perform basecalling in MinKnow during the sequencing run by selecting the super accuracy (SUP) model and selecting barcode trimming “ON”. Dorado version: 0.7.2+9ac85c6.
- Perform taxonomic classification of DNA sequence reads against using the taxonomic classifier Kraken2 (v2.1.3)30 against the NCBI non-redundant protein (nr) database, confidence 0.05.
- Inspect the Kraken2 report files for total bacteria and fungi read classifications.
- Calculate the relative abundance of bacteria and fungi for each sample.
7. Soil microbial biomass carbon estimation by chloroform fumigation
- Weigh fresh soil samples into pre-weighed pans and dry in an oven at 105 °C for 24 h.
- Calculate soil moisture content by subtracting dry soil weight from fresh soil weight and dividing the difference by fresh soil weight.
Moisture content (%) = ((W wet – Wdry)/ Wdry) × 100 - Use the moisture content to calculate the dry matter of the soil.
Dry Matter (%) = 100 – Moisture content (%) - Add 5 g of soil to two individual 50 mL centrifuge tubes, labeled unfumigated and fumigated.
- Add a total of 25 mL of 0.5 M K2SO4 to the unfumigated labelled tube.
- Shake the unfumigated samples in an orbital shaker for 1 h at room temperature.
- Add 2 mL of ethanol-free chloroform directly to the soil in the tubes labelled fumigated. Close and secure the lids with parafilm, and incubate in the dark for 24 h at room temperature.
- Centrifuge the unfumigated sample for 10 min at 2,500 x g at room temperature.
- Decant the supernatant from the unfumigated sample, strain through a 0.45 µm cellulose filter, and store at -20 ˚C.
- Remove the lids from the fumigated samples and vent in the fume hood for 2 h, then perform the K2SO4 extraction (repeating steps 5-9) and store at -20 ˚C.
- Measure the carbon concentration of the extract for both ‘fumigated’ and ‘unfumigated’ samples, using a Total Organic Carbon analyzer.
- Calculate microbial biomass carbon (MBC) using the following equation MBC = (Fumigated C content-Unfumigated C content)/0.45. Normalise for per gram dry weight soil.
8. Soil organic matter content estimation
- Dry a porcelain crucible in a convection oven at 105 ˚C for 30 min, then weigh it after cooling to 20 ˚C (WC).
- Place up to 2 g of soil into the dried crucible and weigh again.
- Dry the soil samples in the filled crucible in a convection oven at 105 ˚C for 24 h.
- Place in a sealed desiccator to cool and weigh again (WS).
- Preheat a muffle furnace to 550 ˚C, then place the crucible containing the soil in the furnace for 4 h.
- Remove the crucible with soil from the furnace and place it in a desiccator to cool.
- Weigh the crucible with soil (WA).
- Measure the percentage of SOM by calculating the difference in soil dry weight before and after incubation at 550 ˚C.
SOMLOI = [(WS –W A)/(WS –WC)] × 100
Results
Soil samples were collected from five locations, and soil organic matter content was determined by loss-on-ignition. Soil organic matter contents ranged from 3.38% to 10.34 % across each of the soils used in the study (Table 1). DNA extractions were performed on each soil sample in triplicate, with resultant DNA yields ranging from 32 ng to 4,590 ng per gram of dry soil (Figure 3A).
DNA concentration differed significantly among soils with varying organic matter content (one-way ANOVA p < 0.0001, R2=0.97). The soil with the lowest organic matter content, soil A, did not exhibit the lowest DNA concentration. However, soil E, which had the highest organic matter content, had significantly greater concentration of DNA from all other soils (A–D, p < 0.0001), while soil B had the lowest, differing significantly from A and D (p < 0.05). The ddPCR protocol was performed on DNA purified from each of the soil samples using the 16S and 18S rRNA gene primers. The number of gene copies per gram dry weight of soil for each of the 16S (Figure 3B) and 18S rRNA (Figure 3C) genes was determined using the ddPCR. Across all soil samples, there were fewer copies of the 18S rRNA gene than the 16S rRNA gene. Tukey’s post-hoc tests revealed that soil B had the fewest 16S and 18S rRNA gene copies, with an average of 8.8 x 10⁷ and 4.6 x 10⁶ genes copies, respectively, per gram of dry soil. Soil E differed significantly from all the other soils and exhibited the greatest number of 16S and 18S rRNA gene copies with 4.4 x 10⁹ and 2.5 x 10⁹ gene copies, respectively, per gram of dry soil. Fungal copies in soils A–D did not differ significantly from each other, while bacterial copies in soil D differed significantly from soil B and E.
Whole genome shotgun (WGS) sequencing was employed on DNA purified from each of the soil samples, and taxonomic classifications were performed using Kraken2 against the NCBI nr database. The total number of DNA sequence reads classified against bacteria and fungi was used to calculate the fungal:bacterial ratio (F:B) for each soil and compared to fungal:bacterial ratios calculated from gene copy numbers estimated by ddPCR (Supplementary Figure 1). The F:B ratio values obtained with ddPCR ranged from 0.022 to 0.66 across all soil samples and were higher than those obtained from whole genome sequencing. The highest average F:B was observed in soil E, with an F:B of 0.56 for ddPCR and 0.038 for the WGS methods. Moreover, there was a larger range of F:B values identified in the soil samples using ddPCR rather than WGS. In addition, a positive correlation was observed between F:B ratio determined by the ddPCR method and WGS data (r = 0.59, R2 = 0.35, p = 0.019), as shown in Supplementary Figure 1.
An average gene copy number for bacteria and fungi was used to convert calculated gene copies to the number of bacteria and fungi cells in the originating samples (Supplementary Figure 2). These data were combined to estimate the total number of microbial cells within the soil (Figure 3D) and differed significantly among soils (one-way ANOVA p < 0.0001). Tukey’s pairwise comparison analysis showed the highest microbial content was observed in soil E, while the lowest microbial content was found in samples collected from soil B, differing significantly from A, D, and E.
Chloroform fumigation was performed on each soil sample in triplicate to estimate total microbial biomass carbon (MBC) in each sample (Figure 4A). Between 3.6 and 9.6 mg carbon per gram of dry soil was identified across the soils used, with no significant differences observed between each of the samples (one-way ANOVA p = 0.266). An average carbon content for bacterial and fungal cells was used to convert the ddPCR-estimated microbial cell number to an estimated total microbial biomass carbon. These ddPCR-derived estimates were compared with the chloroform fumigation method (Figure 4B). To assess the relationship between MBC measured by chloroform fumigation and the ddPCR method, a Pearson correlation was conducted (n = 15). A positive correlation was found between the two methods (r = 0.43, R2 = 0.18, p-value = 0.05). Outliers from soil E, characterised by the highest organic matter content, likely contributed disproportionately to this marginally significant result (Figure 4B).
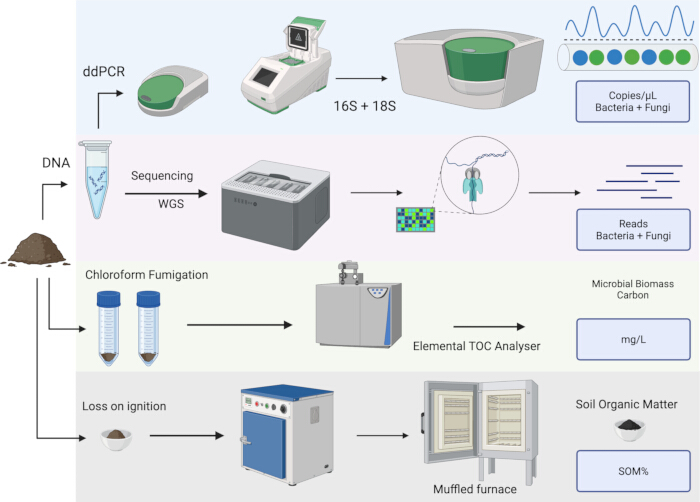
Figure 1: An overview of soil sample processing. The figure illustrates the molecular methods using soil DNA for microbial quantification and the conventional methods for measuring microbial biomass carbon and soil organic matter. Please click here to view a larger version of this figure.
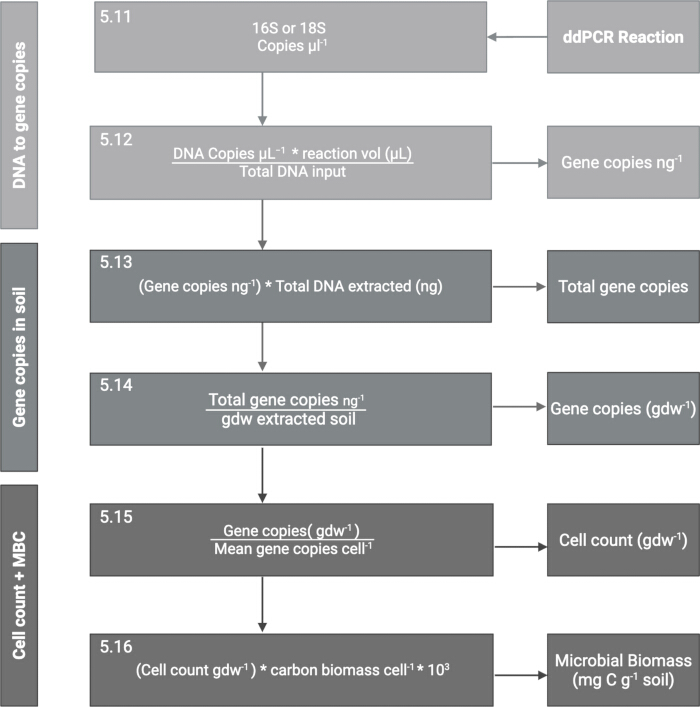
Figure 2: Flowchart of the cell counting process from ddPCR copies for both 16S and 18S, to the final microbial biomass carbon estimation, showing steps 5.11–5.16 of the protocol. Please click here to view a larger version of this figure.
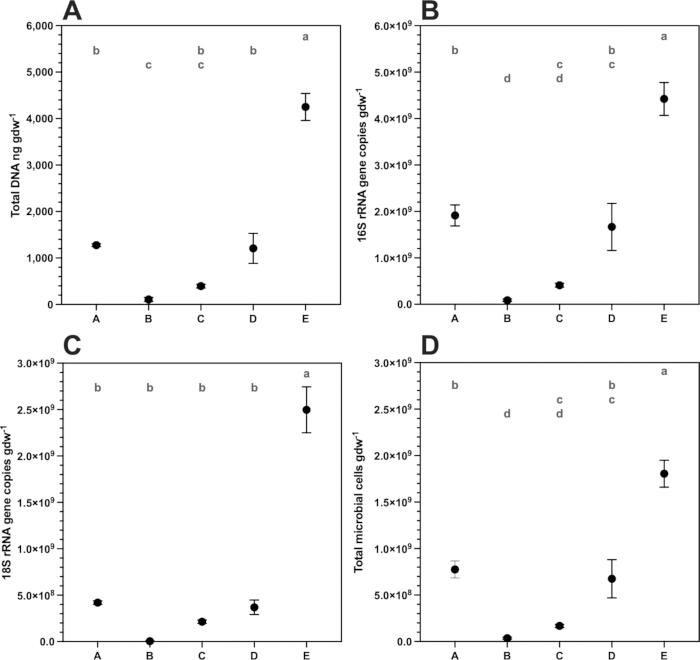
Figure 3: Microbial quantification of soils. (A) The average DNA concentration purified from each of the soil samples. (B) Average total number of 16S rRNA gene copies per gram dry weight of soil using ddPCR. (C) Average total number of 18S rRNA gene copies per gram dry weight of soil using ddPCR. (D) Average total number of microbial cells per gram dry weight across soil samples. All error bars display the standard error of the mean. A one-way ANOVA and subsequent Tukey’s post-hoc test for pairwise comparisons were performed, and the significant differences are shown using compact letter display (significance threshold = 0.05). Samples are ordered from lowest to highest OM%. Soil Origin (OM%) A: Netherlands (3.38), B: Iraq (5.14), C: China (6.41), D: UK (8.19), and E: UK (10.34). Please click here to view a larger version of this figure.
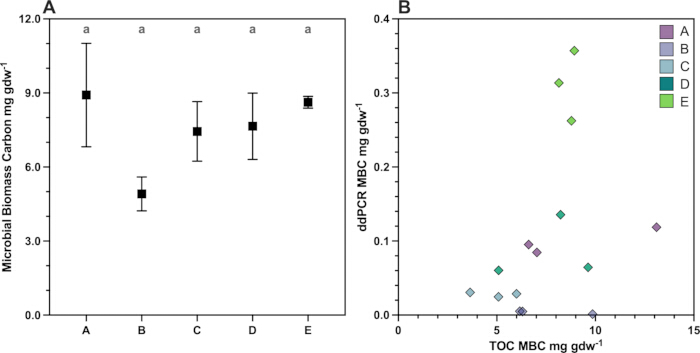
Figure 4: Microbial biomass carbon measured by chloroform fumigation extraction and gene-based cell estimates. (A) MBC extracted by chloroform fumigation- arranged from low to high organic matter content. Error bars display the standard error of the mean. A one-way ANOVA and subsequent Tukey’s post-hoc test for pairwise comparisons were performed, and the significant differences are shown using compact letter display (significance threshold = 0.05). (B) MBC estimated from cell abundance (cell gdw -1) derived from ddPCR gene copy number and converted to biomass carbon, plotted against total organic matter for the same sample. Please click here to view a larger version of this figure.
| Sample | Soil Origin | pH | Moisture content % | Organic Matter% | Texture | Land Use |
| A | Texel, Netherlands | 7.16 | 19.04 | 3.38 | Sandy loam | Horticulture |
| B | Najaf, Iraq | 7.58 | 8.33 | 5.14 | Silty loam | Rice |
| C | Jiangxi, China | 4.11 | 8.45 | 6.41 | Silty loam | Sesame/Rapeseed |
| D | Cambridge, UK | 6.81 | 21.8 | 8.19 | Silty loam | Wheat |
| E | Exeter, UK | 5.44 | 20.27 | 10.34 | Silty loam | Grassland |
Table 1: Physiochemical properties and land-use characteristics of five soil samples (A–E), for microbial biomass determination.
| Target | bp | Forward | Reverse | Reference |
| 16S rRNA | 180 | 5′- ACTCCTACGGGAGGCAGCAG | 5′- ATTACCGCGGCTGCTGG | (Le Geay et al., 2024; Ovreås et al., 1997) |
| 18S rRNA | 351 | 5′-GGRAAACTCACCAGGTCCAG | 5′-GSWCTATCCCCAKCACGA | (Liu et al., 2012) |
Table 2: Primer pairs selected for targeting the 16S and 18S rRNA gene using the ddPCR.
Supplementary Figure 1: A correlation between F:B ratio for all soil samples, determined by the ddPCR method and WGS. Please click here to download this file.
Supplementary Figure 2: Number of cells in different soil samples measured using the ddPCR method targeting: (A) bacteria; and (B) fungi.Please click here to download this file.
Discussion
Soil microbes are the main decomposers in terrestrial ecosystems and play an essential role in nutrient cycling and as carbon storage in soil. Despite the importance of soil microbes, accurately quantifying their absolute abundance using gene copy-based methods is challenging. This is due to many factors, such as the variable number of target genes in different species. This study demonstrates how soil microbial biomass can be quantified using ddPCR by targeting prokaryotes and eukaryotes using the respective 16S and 18S rRNA gene coding regions. The highest F:B ratio in soil E was observed, where this sample also had the highest organic matter percentage. The second-highest F:B ratio was seen in sample C, which correlated with the high acidity of these soils. This was expected for samples C and E, as fungal growth increases with a lower pH31. Whole genome sequencing was performed on the same DNA extracts that were used for ddPCR methods. The F:B ratio between WGS and ddPCR was compared. The F:B ratio calculated from WGS data was lower for all samples analyzed compared to the F:B ratio calculated from ddPCR data. However, the overall trend of the F:B ratio between the samples was visually comparable between each method. This yielded higher F:B ratios on soil samples compared to whole genome sequencing and demonstrated greater F:B ratio variability across different soil types. The lower F:B ratio observed from the WGS data is likely caused by the differences in genome size between fungi and bacteria, and the fungal sequences may be under-represented without enrichment32. Furthermore, despite Soil A having the lowest organic matter content, it didn’t display the lowest number of microbial copies and microbial biomass carbon, highlighting that organic matter content is not always directly correlated with microbial biomass. Notably, the trends observed between originating DNA concentration (Figure 3A) and total microbial cells (Figure 3D) were visually similar, suggesting that DNA concentration is a good proxy for microbial biomass.
ddPCR enables accurate quantification of gene copy numbers within soil samples, and this method can be used to estimate total microbial cells. However, there are limitations that need to be considered. The number of 16S and 18S rRNA gene copies varies widely among microbial taxa23. As a result, using a single correction factor for gene copy number can lead to over- or underestimation of microbial abundance in a sample33. This limitation can be addressed by incorporating prior knowledge of the microbial community18, utilizing whole genome sequencing data, and applying appropriate gene copy number corrections that are representative of the specific soil microbiota. While molecular methods still provide an estimate rather than an exact count, they offer a more accurate prediction of microbial abundance. When combined with community composition data, this approach allows for interpretations that go beyond relative abundance alone19,34.
Microbial biomass carbon (MBC), estimated using chloroform fumigation, showed no significant differences across the samples analyzed, although high degrees of variation in MBC were observed among samples A–D. In contrast, significant differences were detected in total microbial cell counts measured using the ddPCR method, indicating that this molecular approach may provide greater resolution than conventional techniques. However, calculating microbial biomass carbon from microbial cell numbers has its own limitations. Variability in cell size can influence the conversion of cell counts to biomass. Similar to using a single conversion factor for gene copy number, using a single conversion factor for bacterial and fungal carbon content may lead to over- or underestimation of microbial biomass carbon.
Moreover, DNA-based methods may be especially problematic in comparison across soils that display large differences in the degree of dominance between bacteria and fungi. Both DNA yield and GCN can also be affected by the choice of DNA extraction method and primer design35,36, making cross-laboratory comparisons difficult37. In addition, both GCN and DNA yield methods may be vulnerable to overestimation due to so-called “relic DNA”, i.e., DNA in dead organisms or bound to clays14,38. Even though ddPCR methods have shown better precision and repeatability, some disadvantages include it’s complicated processes, high costs, and use of unspecific DNA dye, when using the Evagreen chemistry5. This may create weak false positives, making it difficult to separate positive droplets from negative droplets, and a slight threshold misadjustment could impact the F:B ratio when gene copies are low14. To increase the number of samples that can be processed using this ddPCR method, automation with liquid handling robotics can be used for DNA extractions and reaction setup39. Additionally, the new ddPCR system enables greater multiplexing, generating droplets for 96 samples simultaneously.
It is important to note that all microbial biomass measurements are estimates and involve generalised conversion factors to ascertain the numbers37. Therefore, comparisons between methods should be performed with caution, as it is unknown which are the most accurate. Despite this, chloroform fumigation-extraction methods have been widely used over the last few decades, relying on chloroform vapours to fumigate the soil. This has raised many concerns due to its toxicity to humans and the environment, as well as its effectiveness in lysing soil microbial cells40. In addition, chloroform fumigation may lead to an over-estimation of MBC produced from non-living sources, such as plant residue41. Finally, this method also relies on relatively large amounts of soil in comparison to other molecular methods that require very low quantities of soil (<500 mg).
This study provides evidence that ddPCR-based methods for measuring soil microbial biomass across a range of soils are robust and are not impacted by different soil types and potential inhibitors. The success of this method is impacted by the originating DNA sample, and therefore, ensuring effective DNA purification from the samples is vital. This method shows promise for microbial detection and quantification in various soil types and textures, complementing existing methods for microbial biomass estimation and enabling valuable future applications in monitoring soil health and scalability for regional or global microbiome surveillance.
Disclosures
Authors declare no conflicts of interest.
Acknowledgements
We thank Dr. Nina Lindstrom-Friggens, Dr. Liz Cressey, Dr. Joanna Zaragoza-Castells, Angela Elliott, Dr. Kees Jan van Groenigen, and Prof. Iain Hartley. We would also like to thank the landowners for providing the soils for this study. This research was funded by Shell Research Ltd (CW648947-PT34767). The datasets generated during the current study are available in the NCBI Sequence Read Archive repository PRJNA1305539.
Materials
| Name | Company | Catalog Number | Comments |
|---|---|---|---|
| Bettersizer S3 Plus | Bettersize, China | BT-803 | |
| Centrifuge | Thermoscientific | SL16 | |
| Chloroform | ThermoScientific | L14759.AU | |
| ddPCR 96-Well Plates | Bio-Rad, Watford, UK | 12001925 | |
| ddPCR Droplet Reader Oil | Bio-Rad, Watford, UK | 1863004 | |
| Dessicator | Davisil | ||
| DG8 Cartridge Holder | Bio-Rad, Watford, UK | 1863051 | |
| DG8 Cartridges for QX200/QX100 Droplet Generator | Bio-Rad, Watford, UK | 1864008 | |
| DG8 Gaskets for QX200/QX100 Droplet Generator | Bio-Rad, Watford, UK | Q33265 | |
| DNeasy Power Soil pro kit | Qiagen, Germany | 47017 | |
| double-stranded (dsDNA) Broad range (BR) assay kit | Invitrogen, Germany | Q33230 | |
| FastPrep-24 5G | MP Biomedicals, UK | 116005500 | |
| GridION | Oxford Nanopore Technologies, UK | GRD-MK1CAPX | |
| K2SO4 | Merck, UK | 7778-80-5 | |
| Mag-Bind Magnetic beads | Omega Bio-tek, USA | M1378-01 | |
| MinION flow cell | Oxford Nanopore Technologies, UK | FLO-MIN114 | |
| Muffled furnace | Carbolite | AAF1100 | |
| Native barcoding kit 24 | Oxford Nanopore Technologies, UK | SQK-NBD114.24 | |
| PCR Plate Heat Seal, foil, pierceable | Bio-Rad, Watford, UK | 1814040 | |
| PX1 PCR Plate Sealer | Bio-Rad, Watford, UK | 1814000 | |
| Qubit Fluorometer | Invitrogen, Germany | Q33226 | |
| QX200 Droplet Digital PCR System | Bio-Rad, Watford, UK | 1864001 | |
| QX200 ddPCR EvaGreen Supermix | Bio-Rad, Watford, UK | 186-4033 | |
| QX200 Droplet Generation Oil for EvaGreen | Bio-Rad, Watford, UK | 1864005 | |
| QXDx Droplet Generator | Bio-Rad, Watford, UK | 12001049 | |
| SENSOQUEST LABCYCLER | Geneflow, Germany | 1120280125 |
References
- Jobbágy, E. G., Jackson, R. B. The vertical distribution of soil organic carbon and its relation to climate and vegetation. Ecol Appl. 10 (2), 423-436 (2000).
- Sanderman, J., Hengl, T., Fiske, G. J. Soil carbon debt of 12,000 years of human land use. Proc Natl Acad Sci U S A. 114 (36), 9575-9580 (2017).
- He, Y., Li, J., Siemann, E., Li, B., Xu, Y., et al. Plant invasion increases soil microbial biomass carbon: meta-analysis and empirical tests. Glob Change Biol. 31 (3), e70109(2025).
- de Menezes, A. B., Richardson, A. E., Thrall, P. H. Linking fungal-bacterial co-occurrences to soil ecosystem function. Curr Opin Microbiol. 37, 135-141 (2017).
- Wang, D., et al. ddPCR surpasses classical qPCR technology in quantitating bacteria and fungi in the environment. Mol Ecol Resour. 22 (7), 2587-2598 (2022).
- Djemiel, C., et al. Biogeographical patterns of the soil fungal:bacterial ratio across France. mSphere. 8 (5), e0036523(2023).
- Bailey, V. L., Smith, J. L., Bolton, H. Fungal-to-bacterial ratios in soils investigated for enhanced C sequestration. Soil Biol Biochem. 34 (7), 997-1007 (2002).
- Vance, E. D., Brookes, P. C., Jenkinson, D. S. Microbial biomass measurements in forest soils: the use of the chloroform fumigation-incubation method in strongly acid soils. Soil Biol Biochem. 19 (6), 697-702 (1987).
- Frostegård, Å, Bååth, E., Tunlio, A. Shifts in the structure of soil microbial communities in limed forests as revealed by phospholipid fatty acid analysis. Soil Biol Biochem. 25 (6), 723-730 (1993).
- Cao, Z., Li, D., Han, X. The fungal to bacterial ratio in soil food webs, and its measurement. Acta Ecol Sin. 31 (20), 6050-6058 (2011).
- Frossard, A., Hammes, F., Gessner, M. O. Flow cytometric assessment of bacterial abundance in soils, sediments and sludge. Front Microbiol. 7, 903(2016).
- Joergensen, R. G., et al. A hitchhiker’s guide: Estimates of microbial biomass and microbial gene abundance in soil. Biol Fertil Soils. 60 (4), 457-470 (2024).
- Fierer, N., Wood, S. A., Bueno de Mesquita, C. P. How microbes can, and cannot, be used to assess soil health. Soil Biol Biochem. 153, 108111(2021).
- Laine, M. B., Taipale, S. J., Tiirola, M. Comparison of methods for assessing fungi-to-bacteria ratio of soil. Biol Fertil Soils. 61 (5), 941-954 (2025).
- De Filippis, F., Laiola, M., Blaiotta, G., Ercolini, D. Different amplicon targets for sequencing-based studies of fungal diversity. Appl Environ Microbiol. 83 (17), e00905-e00917 (2017).
- Liu, C. M., et al. FungiQuant: A broad-coverage fungal quantitative real-time PCR assay. BMC Microbiol. 12, 255(2012).
- Lofgren, L. A., et al. Genome-based estimates of fungal rDNA copy number variation across phylogenetic scales and ecological lifestyles. Mol Ecol. 28 (4), 721-730 (2019).
- Angly, F. E., et al. W. CopyRighter: A rapid tool for improving the accuracy of microbial community profiles through lineage-specific gene copy number correction. Microbiome. 2 (1), 11(2014).
- Kembel, S. W., Wu, M., Eisen, J. A., Green, J. L. Incorporating 16S gene copy number information improves estimates of microbial diversity and abundance. PLoS Comput Biol. 8 (10), e1002743(2012).
- Pan, P., Gu, Y., Sun, D. L., Wu, Q. L., Zhou, N. Y. Microbial diversity biased estimation caused by intragenomic heterogeneity and interspecific conservation of 16S rRNA genes. Appl Environ Microbiol. 89 (5), e0210822(2023).
- Chacón-Vargas, K., Torres, J., Giles-Gómez, M., Escalante, A., Gibbons, J. G. Genomic profiling of bacterial and fungal communities and their predictive functionality during pulque fermentation by whole-genome shotgun sequencing. Sci Rep. 10 (1), 15115(2020).
- Bahram, M., et al. Metagenomic assessment of the global diversity and distribution of bacteria and fungi. Environ Microbiol. 23 (1), 316-326 (2021).
- Smith, C. J., Osborn, A. M. Advantages and limitations of quantitative PCR (Q-PCR)-based approaches in microbial ecology: Application of Q-PCR in microbial ecology. FEMS Microbiol Ecol. 67 (1), 6-20 (2009).
- Hindson, B. J., et al. High-throughput droplet digital PCR system for absolute quantitation of DNA copy number. Anal Chem. 83 (22), 8604-8610 (2011).
- Le Geay, M., Mayers, K., Küttim, M., Lauga, B., Jassey, V. E. J. Development of a digital droplet PCR approach for the quantification of soil micro-organisms involved in atmospheric CO2 fixation. Environ Microbiol. 26 (6), e16666(2024).
- Hansen, P. M., Semenova-Nelsen, T. A., Platt, W. J., Sikes, B. A. Recurrent fires do not affect the abundance of soil fungi in a frequently burned pine savanna. Fungal Ecol. 42, 100852(2019).
- Ovreås, L., Forney, L., Daae, F. L., Torsvik, V. Distribution of bacterioplankton in meromictic Lake Saelenvannet, as determined by denaturing gradient gel electrophoresis of PCR-amplified gene fragments coding for 16S rRNA. Appl Environ Microbiol. 63 (9), 3367-3373 (1997).
- Whitman, W. B., Coleman, D. C., Wiebe, W. J. Prokaryotes: The unseen majority. Proc Natl Acad Sci U S A. 95 (12), 6578-6583 (1998).
- Cheng, J. Y. W., Chan, C. K., Lee, C. T., Lau, A. P. S. Carbon content of common airborne fungal species and fungal contribution to aerosol organic carbon in a subtropical city. Atmos Environ. 43 (17), 2781-2787 (2009).
- Wood, D. E., Lu, J., Langmead, B. Improved metagenomic analysis with Kraken 2. Genome Biol. 20 (1), 257(2019).
- Rousk, J., Brookes, P. C., Bååth, E. Contrasting soil pH effects on fungal and bacterial growth suggest functional redundancy in carbon mineralization. Appl Environ Microbiol. 75 (6), 1589-1596 (2009).
- Xie, Z., Canalda-Baltrons, A., d’Enfert, C., Manichanh, C. Shotgun metagenomics reveals interkingdom association between intestinal bacteria and fungi involving competition for nutrients. Microbiome. 11 (1), 275(2023).
- Větrovský, T., Baldrian, P. The variability of the 16S rRNA gene in bacterial genomes and its consequences for bacterial community analyses. PLoS One. 8 (2), e57923(2013).
- Doyle, B., et al. Absolute quantification of prokaryotes in the microbiome by 16S rRNA qPCR or ddPCR. Nat Protoc. 20, 3471-3476 (2025).
- Frostegård, A., et al. Quantification of bias related to the extraction of DNA directly from soils. Appl Environ Microbiol. 65 (12), 5409-5420 (1999).
- Lee, E., Lim, H. J., Son, A. Discrepancies in qPCR-based gene quantification and their dependencies on soil properties, inhibitor presence, and DNA extraction kit types. RSC Adv. 15 (25), 19656-19664 (2025).
- Buell, Z. W., et al. Interrelationships among methods of estimating microbial biomass across multiple soil orders and biomes. Soil Biol Biochem. 208, 109844(2025).
- Carini, P., et al. Relic DNA is abundant in soil and obscures estimates of soil microbial diversity. Nat Microbiol. 2 (3), 16242(2016).
- Child, H. T., et al. Automated environmental metagenomics using Oxford nanopore sequencing. BMC Genomics. 26 (1), 835(2025).
- Paliaga, S., Laudicina, V. A., Muscarella, S. M., Said-Pullicino, D., Badalucco, L. Comparison of different methods for estimating microbial biomass in biochar-amended soils. Soil Biol Biochem. 203, 109733(2025).
- Setia, R., Verma, S. L., Marschner, P. Measuring microbial biomass carbon by direct extraction: comparison with chloroform fumigation-extraction. Eur J Soil Biol. 53, 103-106 (2012).
Reprints and Permissions
