This study uses a multi-perspective fuzzy reasoning model and an improved extreme gradient boosting (XGBoost) algorithm (optimized by an improved grey wolf optimization algorithm) to analyze online learning behavior and classify student comment emotions, providing support for personalized teaching and timely intervention.
A subscription to JoVE is required to view this content. Sign in or start your free trial.
Research Article
Multi-Perspective Fuzzy Reasoning and XGBoost-Based Analysis of Online Learning Behavior
In This Article
Erratum Notice
Important: There has been an erratum issued for this article. View Erratum Notice
Summary
Abstract
The booming development of online education has made online classrooms an important component of the education field. In-depth analysis of students' learning behavior in online teaching can help teachers optimize teaching strategies and provide personalized learning support for students. Therefore, to carry out an in-depth analysis of students' learning behavior, this study collects data from online teaching platforms and preprocesses it. Subsequently, this study constructs a multi-perspective fuzzy reasoning model covering three dimensions: curriculum, individual, and class, to comprehensively consider students' learning performance from different levels. This model processes uncertain information in learning behavior data through fuzzy sets and fuzzy rules, achieving a multidimensional evaluation of learning performance. An improved XGBoost algorithm is designed to classify students' comment emotions. This improved algorithm optimizes the hyperparameters of the XGBoost algorithm by improving the grey wolf optimization algorithm. The algorithm enhances the accuracy of emotion classification and further explores the emotional tendencies and attitude feedback behind their learning behavior. The results showed that from a curriculum perspective, the completion rate of course tasks 3 weeks before the exam was basically above 45%, which was much higher than the completion rate three weeks after the task was released (both lower than 18%). These results indicated that students were more inclined to complete tasks before the deadline and had obvious procrastination. The maximum accuracy of the improved classification algorithm was 98.78%, which was 8.57%, 7.55%, 6.38%, and 6.01% higher than the comparison model, and its average time consumption was 58 ms. The recall rates on negative, positive, and neutral emotions were 98.35%, 97.69%, and 98.02%. The research model can effectively analyze students' online learning behavior and enable early identification of at-risk students, facilitating personalized teaching and precise intervention in online education.
Introduction
The deep integration of the Internet and educational technology has made online education leap from a marginal supplement to a mainstream form. By the end of 2023, the number of registered online learners worldwide had exceeded 1.2 billion, and China had consistently ranked first in the world in both the number of Massive Open Online Courses (MOOCs) and learners1,2. However, while online teaching brings convenience, it also exposes challenges such as the opaque learning process, the separation of teachers and students in time and space, and lagging regulatory feedback. There is a positive correlation between learning behavior data and academic performance. Dynamic tuning based on data can increase course completion rates by over 20% and significantly reduce the risk of dropout3,4,5. Therefore, conducting Learning Behavior Analysis (LBA) is crucial. Regarding this issue, current methods include descriptive statistics, association rule mining, and traditional machine learning classification6. Many scholars have researched this issue.
To conduct LBA, Li Y et al. utilized learning behavior data from online teaching platforms at Harvard University and Massachusetts Institute of Technology to construct a Pulse Neural Network (PNN) for predicting learning outcomes. They analyzed the correlation between learning behavior and outcomes. The online learning behavior prediction model based on PNN achieved an accuracy of 99.80%7. Zeng B designed an efficient model for visualizing online English learning behavior using lagged sequence analysis and combined data mining methods and the minimum spanning tree algorithm. In addition, the study also established an online intelligent learning platform for Group Learning Path (GLP) construction services. The designed method could successfully construct a GLP8. Zhao M et al. designed a double-layer Long Short-Term Memory (LSTM) to reveal potential problems in students' online learning. They used the TensorFlow framework and Python language, and utilized data from online platforms Kaggle, edX, and the Open University of the UK. This network had good performance, with a maximum accuracy of 83.4%9. Li F et al. collected and analyzed learning behavior data from 109 undergraduate students to understand the group behavior characteristics of different online learners. This study introduced principal component analysis to reduce data dimensionality and used agglomerative hierarchical clustering to classify learners into various categories. Among them, 15 groups were clustered, and the proposed method had good clustering accuracy10.
In summary, current research on LBA is quite diverse and employs a wide range of methods. However, these studies and methods also have certain shortcomings. For example, there is insufficient mining of emotional information in student review texts, and descriptive statistics cannot reveal the complex interaction mechanisms behind behaviors. Machine learning classification is often based on single-perspective features, which separates multi-dimensional information of courses, individuals, and classes. To better perform LBA, this study designs a Multi-Perspective Fuzzy Reasoning (MPFR) model and constructs an emotion classification model built on Improved Grey Wolf Optimization (IGWO) and eXtreme Gradient Boosting (XGBoost) algorithms.
In existing LBA research, although LSTM can capture the temporal correlation of learning behaviors, its ability to handle fuzzy and uncertain learning behavior data is weak. Convolutional Neural Network (CNN) has certain advantages in text feature extraction, but is better at capturing local features, and is difficult to integrate multi-dimensional global information of courses, individuals, and classes. Compared with deep learning methods such as CNN and LSTM, the MPFR model can capture uncertain information in learning behavior through fuzzy reasoning. For example, students' "moderate participation" and "basic mastery" of fuzzy states make up for the limitations of CNN's local feature extraction. IGWO-XGBoost balances accuracy and efficiency in sentiment classification, compensating for the time-consuming LSTM sentiment classification and weak CNN semantic fuzzy processing. This study aims to provide three-dimensional information support for online teaching intervention by combining the results of behavior and emotion analysis. The innovation of the research lies in the construction of an MPFR model that covers three dimensions: curriculum, individual, and class. This comprehensive consideration from multiple perspectives can comprehensively and stereoscopically reflect students' learning performance, avoiding important information that may be overlooked from a single perspective. This method has good platform scalability and can be adapted to mainstream online learning platforms such as Chaoxing and MOOC, that is, through a unified data preprocessing interface without the need for additional platform development functions. At the same time, this method has been encapsulated as a simple analysis tool, and educators only need to upload the basic data exported from the platform to automatically generate LBA reports without complex technical operations.
Access restricted. Please log in or start a trial to view this content.
Protocol
Design of the LBA method considering MPFR and emotional perspectives
A multi-perspective evaluation system is constructed for analyzing Students' Online Learning Behavior (SOLB), and an MPFR model is designed. To further analyze students' subjective feelings in learning, this study adopts the XGBoost algorithm and designs the IGWO algorithm for hyperparameter optimization to improve classification accuracy.
Construction of the MPFR model for LBA
To analyze SOLB, this study mainly starts from two perspectives to form a complete analysis plan. Firstly, in terms of learning performance, this study considers three perspectives: curriculum, individual, and class, to form the MPFR model. Secondly, in terms of sentiment analysis of student comments, this study designs an improved XGBoost algorithm. Through the analysis of learning performance and student feedback emotions, this study can better analyze SOLB. In terms of specific technical details of learning performance analysis, this study first uses data from an online learning platform and preprocesses it. Secondly, this study selects core learning performance evaluation indicators from different perspectives to construct a comprehensive evaluation system. Subsequently, a corresponding MPFR model is constructed to evaluate learning behavior.
This study selects data from the Superstar platform (source from: https://www.chaoxing.com/). It contains information from multiple dimensions, such as classroom activities and grade evaluation, which can provide a good foundation for subsequent LBA. After obtaining the data, it needs to be preprocessed, mainly including irrelevant field deletion, data filtering, and data integrity checks. For example, in teacher data, irrelevant information such as the number and the department to which the course belongs needs to be removed. Subsequently, this study constructs the feature engineering of LBA based on the learning behavior data of the Superstar platform. The student LBA index provides a feature engineering foundation for the subsequent MPFR model, and the content of this index is shown in Figure 1.
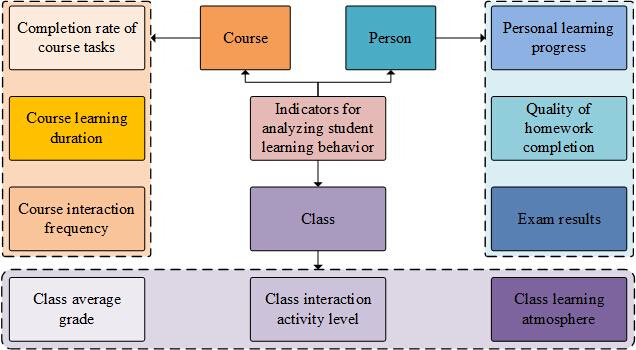
Figure 1: Indicators for student LBA. The figure clarifies the three core dimensions (curriculum, individual, class) of student LBA and the specific evaluation indicators under each dimension, providing feature support for the MPFR model. Please click here to view a larger version of this figure.
In Figure 1, the student LBA indicators mainly revolve around three perspectives: course, individual, and class, with a clear focus on each dimension, providing precise feature support for the construction of MPFR models. Among them, in terms of course dimension indicators, this study selects course task completion rate, course learning duration, and course interaction frequency. The core concern of this dimension is the overall completion quality of course tasks and the timeliness of learning participation. For example, the completion rate of course tasks is used to track the difference in completion rates before and after the deadline; the duration of course study is used to distinguish different learning intensity intervals; The frequency of course interaction is used to filter effective interactive behaviors. On a personal level, personal learning progress, homework completion quality, and exam scores are selected as evaluation indicators. This dimension focuses on the degree of matching between personal learning progress and knowledge mastery results. Examples include comparing personal learning progress with course plans, assessing the accuracy and efficiency of completed assignments, and classifying knowledge mastery levels based on test scores. In addition, in terms of class dimension, the selected indicators include class average score, class interaction activity, and class learning atmosphere. This dimension mainly focuses on the impact of the overall learning environment on individual behavior. For example, the average grade is used to locate the relative level of individual performance in the group; the activity of class interaction is used to reflect the degree of collective participation; the learning atmosphere is used to analyze the driving effect of the group environment on learning behavior. To analyze students' learning behavior, a fuzzy reasoning model is constructed, and learning behavior characteristics are obtained from different perspectives. Fuzzy reasoning is a method of reasoning using fuzzy logic, which processes imprecise or uncertain information through fuzzy sets and fuzzy rules, and has the advantages of strong flexibility and easy understanding11,12. Fuzzy reasoning, as the core computing mechanism of MPFR models, is applied after feature engineering. The main process of fuzzy reasoning is shown in Figure 2.
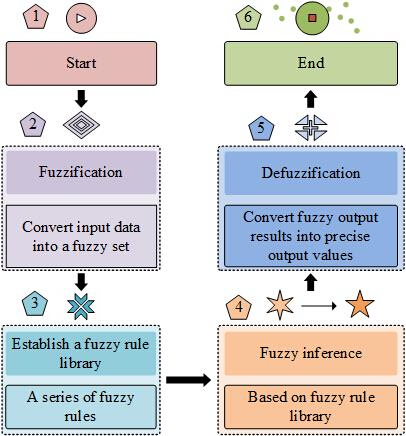
Figure 2: The main flowchart of fuzzy reasoning. The figure shows the core process of fuzzy reasoning, including four key steps: fuzzification, construction of fuzzy rule base, fuzzy reasoning, and deblurring, and clarifies the logic of the MPFR model in handling uncertain learning behavior data. Please click here to view a larger version of this figure.
Fuzzy reasoning mainly involves fuzzification, establishing a Fuzzy Rule Library (FRL), fuzzy reasoning, and deblurring. Among them, fuzzification requires converting precise input data into fuzzy sets and involves defining membership functions. The FRL contains a series of fuzzy rules and is mainly used to describe the relationship between input and output. In the construction of the fuzzy rule base, the study invites three associate professors of educational technology with teaching experience of ≥ 8 years to jointly develop 28 rules, and determines the final rules through three rounds of iteration using the "Delphi method". For example, Rule 1: IF the completion rate of the course task is less than 30% and the individual learning progress is 2 weeks behind schedule → THEN high-risk state. Fuzzy reasoning is the process of inferring fuzzy input data built on an FRL and obtaining fuzzy output results. Finally, deblurring will convert the fuzzy output result into an accurate output value. The study selects a triangular membership function, which is a widely utilized function in fuzzy logic systems, and has advantages such as strong flexibility and high computational efficiency. The expression of function μA(x) is shown in equation (1).
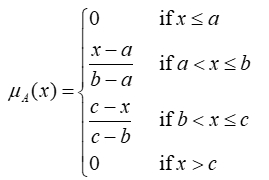 (1)
(1)
In equation (1), x is the specific input value. a, b, and c are the three vertices of a triangle. In deblurring, this paper uses the centroid method to convert the output results. The centroid method is a commonly used deblurring technique in fuzzy logic, which has advantages such as strong intuitiveness, simple calculation, and stability13. The expression of the centroid method is shown in equation (2)14.
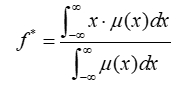 (2)
(2)
In equation (2), f* is the output value after deblurring, which is the centroid of the fuzzy set. μ(x) is the membership function. 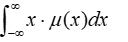 is the weighted sum of all points in a fuzzy set.
 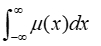 is the integral of the membership function over all possible values of x. The rationality of using manually defined rules and membership functions in the MPFR model is reflected in three aspects. Firstly, expert qualification guarantee: the rule makers are three associate professors of educational technology, and have been certified by the "Online Learning Behavior Analyst" of the "Online Education Research Center of the Ministry of Education" to ensure that the rules comply with the laws of education and teaching. Secondly, efficiency advantage: The inference time of manual rules is much lower than that of data-driven methods, making it more suitable for the "real-time inference" needs of online education platforms and not requiring a large amount of annotated data, reducing data collection costs15. Thirdly, adapting to the core requirement of "interpretability" in online education scenarios, manually defined rules and triangular membership functions (Equation 1) can directly correspond to intuitive cognition in teaching scenarios. Educators do not need a complex technical background to understand the reasoning behind a student being deemed at risk. Data-driven methods such as neuro-fuzzy systems can automatically optimize rules. However, most of the generated rules are complex mathematical expressions, which are difficult for educators to interpret, which reduces the acceptability of the model in actual teaching intervention.
Design of an improved student comment sentiment analysis model for XGBoost
The designed MPFR model can analyze SOLB from three aspects: course, individual, and class. However, external behavioral data analysis has limitations in expressing students' subjective feelings. Therefore, to further analyze students' subjective feelings about learning, additional data from MOOC learning platforms containing student comment information are collected and preprocessed. Subsequently, the XGBoost is utilized to construct the sentiment classification model. The IGWO is designed to optimize its parameters to improve the accuracy of the classification model. The improvement of XGBoost is reflected in its parameter optimization through the IGWO algorithm. Data preprocessing is a crucial first step before model construction and analysis. The process of data preprocessing is shown in Figure 3.
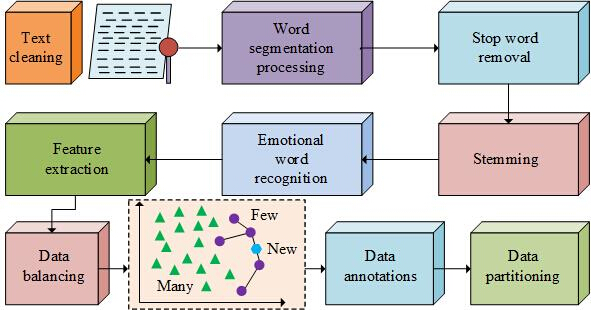
Figure 3: The process of data preprocessing. The nine-step data preprocessing process includes text cleaning, word segmentation, stop-word removal, stem extraction, and sentiment word recognition, providing high-quality data for subsequent behavior analysis and sentiment classification. Please click here to view a larger version of this figure.
The data preprocessing steps are as follows: The first step is to perform text cleaning to remove irrelevant fields in the Chaoxing platform data and filter out invalid samples. At the same time, non-text fields and short reviews are removed from the review data on the MOOC platform. The second step is to perform segmentation processing. Among them, Chinese comments use Jieba's "precise mode" for word segmentation processing, while English comments use the word segmentation function of the NLTK library for processing. The third step is to remove common stop words such as ''de'', ''yes'', ''in'', etc. Among them, the Chinese stop words use the Harbin Institute of Technology stop word list (https://github.com/goto456/stopwords/blob/master/hit_stopwords.txt). Stop words are deleted by word matching. English stop words use the universal stop word list built into the NLTK library, which is also deleted through word-by-word matching. The fourth step is to use the NLTK library's stemmer to extract stems from the text and restore verbs in the English data to their stem form. The fifth step is to identify the positive and negative emotional words in the comments based on the CNKI emotional dictionary to provide a pre-annotation basis for subsequent emotional classification. The sixth step is to perform feature extraction. Among them, the structured data in the Chaoxing platform are standardized, while the classification indicators are encoded separately. At the same time, these comment data of the MOOC platform use a pre-trained language model (Bidirectional Encoder Representation from Transformers, BERT) method to extract text features. The core advantage of the BERT model in text feature extraction is that it can dynamically generate context-aware word vectors via a deep bidirectional Transformer architecture, effectively addressing the ambiguity that traditional static word embedding models cannot handle. The seventh step is to address the issue of imbalanced sentiment categories in comment data. The Synthetic Minority Over-sampling Technique (SMOTE) is employed to process it. Five nearest neighbor samples are selected for interpolation to generate synthetic minority class samples, with a fixed random seed of 42 to ensure reproducibility of the experiment. The eighth step is to annotate and partition the data. The ninth step is to fill in missing values in the super star data and remove outliers. When performing data balancing processing, SMOTE creates new composite samples by interpolating between minority class samples, thereby increasing the number of minority class samples and making the class distribution of the data set more balanced16,17. The expression of SMOTE is shown in equation (3).
Bmn = dm + rand(0,1) x (dmn - dm) (3)
In equation (3), Bmn is an artificially constructed minority class sample, dm is the i-th minority class sample, and dmn is the n-th sample among the k-nearest neighbors of dm . rand(0,1) is a random number between 0 and 1. XGBoost improves the predictive performance by iteratively adding prediction trees. It has advantages such as high accuracy, strong flexibility, and ease of use18,19. The steps of iteratively constructing a tree model using XGBoost mainly include: initializing the model, iteratively constructing the tree, objective function, and the regularization term. The predicted output  in the t -th iteration is shown in equation (4).
 (4)
(4)
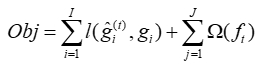
In equation (4),  is the model prediction value after the t - 1 th iteration, ft(h) is the prediction function of the tree model added in the t-th iteration, and h is the input feature vector. The objective function for minimizing XGBoost is shown in equation (5).
 (5)
(5)
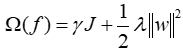
In equation (5), i is the sample number. I and J are the total number of samples and trees, and j is the number of trees.  is the loss function, and gi is the true label of the i -th sample. is the predicted value of the model for the i -th sample after the t -th iteration. Ω(ft) is the regularization term, and (ft) is the prediction function of the j -th tree. The general expression Ω(f) for regularization is shown in equation (6).
 (6)
(6)
In equation (6), γ means the penalty coefficient for the quantity of leaf nodes, λ is the L2 regularization coefficient for the weight of leaf nodes, and w is the weight of leaf nodes. However, the choice of XGBoost hyperparameters has a direct and significant effect on the performance. Common hyperparameters of XGBoost include learning rate, maximum depth of the tree, and regularization parameters. Due to the potentially large hyperparameter space, manually adjusting these parameters is not only time-consuming but also difficult to find the optimal parameter combination. Therefore, this study designs IGWO to optimize the hyperparameters of XGBoost. GWO searches for optimal solutions by simulating the social hierarchy and hunting strategies of gray wolves, with advantages such as fewer parameters and strong adaptability20,21. In GWO, the initial position of the population is generated as shown in equation (7).
 (7)
(7)
In equation (7), Puv is the position of the u-th individual in the v-th dimension.  and
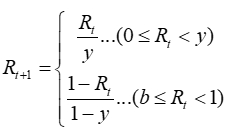
and  are the upper and lower bounds of the v-th search space. rand() is a random number between [0,1]. However, the GWO algorithm may encounter problems such as slow convergence speed and getting stuck in local optima in the middle and later stages. This also means that at this point, GWO may not be able to effectively explore the entire solution space, making it difficult to find the global optimal solution. To address this issue, this study improves GWO from two aspects, namely introducing the Tent Chaotic Map (TCM) and Nonlinear Convergence Factor (NCF). TCM is a simple chaotic mapping that ensures potential optimal solution regions are not missed during the search process and avoids repeated searches of the same region22. Therefore, through TCM, a more uniform and random initial population can be generated, and the algorithm's ability to overcome local optima can be enhanced. The calculation of TCM is shown in equation (8).
 (8)
(8)
In equation (8), y is the control parameter. Rt and Rt+1 are the system state variables at the t-th and t+1-th iterations. The formula for NCF z is shown in equation (9).
![Exponential decay equation; formula: z=zmax[1+exp(-t/tmax)]^(-1); mathematical expression.](/files/ftp_upload/69515/69515eq115.jpg "figure-protocol-19") (9)
(9)
In equation (9), zmax is the maximum convergence factor and tmax is the maximum number of iterations. This non-linear decreasing method allows GWO to maintain a large step size for global search in the early stage. In the middle stage of the search, convergence speed accelerates, while in the later stage, local search is performed with smaller steps, effectively balancing global and local search capabilities and enhancing optimization performance. The IGWO algorithm is used specifically for the hyperparameter optimization stage of the XGBoost sentiment classifier, and its main process is shown in Figure 4.
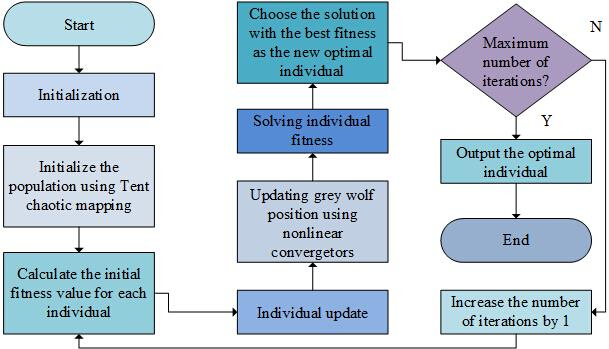
Figure 4: The main process of IGWO. The figure outlines the execution process of IGWO, including population initialization based on tent chaotic mapping, position update of nonlinear convergence factors, and optimal individual screening, and clarifies the logic for optimizing XGBoost hyperparameters. Please click here to view a larger version of this figure.
In Figure 4, the IGWO process includes: initializing the algorithm; using TCM to initialize the population; calculating the initial fitness value of each individual; using NCF to update the gray wolf positions; selecting the solution with the best fitness as the new optimal individual; and outputting the optimal individual. The optimal combination of XGBoost hyperparameters can be output through IGWO. The overall process of sentiment classification integrates data preprocessing, IGWO optimization, and the final XGBoost model. The classification model process based on IGWO-XGBoost is shown in Figure 5.
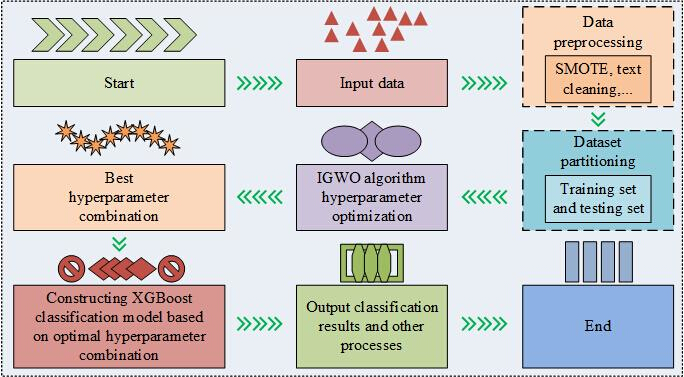
Figure 5: The classification model process based on IGWO-XGBoost. The figure shows the complete process of the IGWO-XGBoost sentiment classification model, from data input and preprocessing to dataset partitioning, IGWO hyperparameter optimization, XGBoost model construction, and classification result output, clearly presenting the model's operation chain. Please click here to view a larger version of this figure.
The model based on IGWO-XGBoost includes processes such as input data, data preprocessing, dataset partitioning, IGWO algorithm hyperparameter optimization, optimal hyperparameter combination, construction of XGBoost based on optimal hyperparameter combination, and output of classification results. Through this classification model, emotions in student comments can be classified, thereby gaining a more intuitive understanding of students' subjective feelings about learning. The specific software versions, random seeds, hardware specifications, environmental specifications, and dataset sources used in the study are shown in Table 1.
| Set type | Specific model and content |
| Basic software | Python 3.9.7 |
| Core library | XGBoost 1.7.5、Scikit-learn 1.2.2、Jieba 0.42.1、NLTK 3.8.1、Pandas 1.5.3、NumPy 1.24.3、Matplotlib 3.7.1、Imbalanced-learn 0.10.1 |
| Random seed | Set the global random seed to 42 |
| Hardware/environment specifications | 1. Operating System: Windows 10 Professional Edition (64 bit, version number 22H2) |
| 2. Processor: Intel Core i5-12600KF (with a main frequency of 3.7GHz and a dynamic acceleration frequency of 4.9GHz) | |
| 3. Memory: 64GB DDR4 (frequency 3200MHz, supports up to 128GB of memory) | |
| 4. Storage: 1TB SSD (Samsung 980 Pro, read speed 7450MB/s) | |
| 5. Graphics card: NVIDIA GeForce RTX 3060 (12GB video memory) | |
| Dataset sources and access details | 1. Superstar platform dataset: |
| -Source Uniform Resource Locator (URL): https://www.chaoxing.com/ | |
| -Acquisition method: apply through the chaoxing education big data open platform (application path: platform official website → developer center → data interface → learning behavior dataset) | |
| 2. MOOC platform comment dataset: | |
| -Source URL: https://www.icourse163.org/.cn | |
| -Acquisition method: Apply through the "data research support" channel of the MOOC platform | |
| Custom scripts or models | 1. Data preprocessing script |
| 2. MPFR model script | |
| 3. IGWO-XGBoost model script |
Table 1: Specific software versions, random seeds, hardware specifications, environmental specifications, and dataset sources used in the research. Provide a detailed list of the required software and hardware environment, random seed settings, dataset sources, and XGBoost hyperparameter search range for the study to ensure the reproducibility and standardization of the experiment.
Table 1 shows that the study adopts XGBoost 1.7.5 as the core framework of the sentiment classification model and introduces Scikit learn 1.2.2 for data preprocessing, feature extraction, and model evaluation. In addition, the study uniformly sets the random seed to 42 to ensure the reproducibility of data partitioning, SMOTE oversampling, IGWO hyperparameter optimization, and IGWO-XGBoost model training results. In addition, the IGWO algorithm sets the search space for XGBoost hyperparameters. The search range for the learning rate is [0.001, 0.3] on the logarithmic scale, and the maximum depth of the tree is searched in the integer set {3, 4,..., 15}. The optimization range of the L2 regularization term is [0.1, 5.0], and the sampling ratio of each tree feature subset is optimized within the range of [0.6, 1.0]. The tuning range for the minimum weight of leaf nodes is [1, 10].
The dataset and the related data preprocessing and analysis code were generated and analyzed by the team themselves. The core scripts for data preprocessing are shown in Table 2.
| import pandas as pd, jieba, re, numpy as np |
| from nltk.tokenize import word_tokenize; from nltk.stem import PorterStemmer |
| def clean(text, l): |
| return re.sub(r"[^\u4e00-\u9fa5]" if l=="zh" else r"[^a-zA-Z]", " ", text).strip() |
| def process(text, l): |
| t = jieba.lcut(text) if l=="zh" else word_tokenize(text) |
| return " ".join([PorterStemmer().stem(w) if l=="en" else w for w in t if w not in open("hit_stopwords.txt").read().split()]) |
| def main(c,m,l): |
| cx=pd.read_csv(c).query("course learning duration>=1 & exam results.notna()"); mc=pd.read_csv(m).query("comment text.str.len()>=5") |
| mc["t"]=mc["comment text"].apply(clean,args=("zh",)).apply(process,args=("zh",)) |
| np.savez("out.npz",**{k:v for k,v in locals().items()}) |
Table 2: Core script for data preprocessing. Present the core script information for data preprocessing, clarify the preprocessing steps corresponding to the script, and provide technical references for the replication of research methods.
Access restricted. Please log in or start a trial to view this content.
Results
LBA results considering multi-perspective and sentiment classification
To verify performance, the experimental environment is set up and the experimental dataset is described. In addition, this study selects the comparative algorithm IGWO-XGBoost and analyzes and verifies it using indicators such as accuracy, time consumption, and recall rate. In the results analysis, the study divides it into two clear sections: the results of LBA via MPFR and the performance validation of se...
Access restricted. Please log in or start a trial to view this content.
Discussion
For the analysis of SOLB, this study designed MPFR and IGWO-XGBoost models and used data from online teaching platforms. In the experiment, there was a high consistency between the rating of the inference model and the actual score, indicating the effectiveness of the inference model. About 25% of students had a study time of 1-10 h in the course. The proportion of students with study hours between 11-20, 21-30, 31-40 h, and over 41 h was 30%, 20%, 15%, and 10%. This indicated that the majority of students maintained mod...
Access restricted. Please log in or start a trial to view this content.
Disclosures
The authors have no relevant financial or non-financial interests to disclose.
Acknowledgements
This study was supported by the Excellent Youth Project of the Scientific Research Program of Hunan Provincial Department of Education (Project Name: Research on the Training Strategy of High-Quality Skilled Talents in Equipment Manufacturing Majors of Higher Vocational Education Driven by New-Quality Productivity; Grant No. 24B0985) and the 2025 Mechanical Industry Vocational Education Industry-Education Collaborative Innovation Project from the Mechanical Industry Education Development Center (Project Name: Research on the Talent Training Mode of Innovation and Entrepreneurship Education for Equipment Manufacturing Majors in Higher Vocational Colleges Based on Industry-Education Integration; Project No. JXHYZX2026035).
Access restricted. Please log in or start a trial to view this content.
Materials
| Name | Company | Catalog Number | Comments |
|---|---|---|---|
| BERT pre trained language model | Google research | https://github.com/google-research/bert | |
| CNKI emotion dictionary | CNKI | https://www.cnki.net/ | |
| Chaoxing platform learns behavioral data | Chaoxing INFORMATION TECHNOLOGY DEVELOPMENT Co., Ltd | https://www.chaoxing.com/ | |
| Computer Memory | Universal hardware supplier (no specific model) | ||
| Harbin institute of technology's list of discontinued terms | Harbin Institute of Technology | https://github.com/goto456/stopwords/blob/master/hit_s | |
| Intel Core i5-12600KF | Intel Corporation | BX8071512600KF | |
| Jieba word segmentation tool (precision mode) | Third party open source community | https://github.com/fxsjy/jieba. | |
| MOOC platform student review data | Love Course Network | https://www.icourse163.org/ | |
| NLTK library | NLTK development team | https://www.nltk.org/ | |
| Python programming language | Python Software Foundation | https://www.python.org/ | |
| Scikit-learn 1.2.2 | Scikit learn team | https://scikit-learn.org/stable/ | |
| Smart Tree platform learns behavioral data | Smart Tree Network | https://www.zhihuishu.com/ | |
| SMOTE technology | Imbalanced Learn Development Team | Integrated into the Imbalanced Learn library, https://imbalanced-learn.org/stable/ | |
| Windows 10 operating system | Microsoft corporation | https://www.microsoft.com/zh-cn/windows/windows-10 | |
| XGBoost 1.7.5 | XGBoost development team | https://xgboost.readthedocs.io/ |
References
- Cebi, A., Araujo, R. D., Brusilovsky, P. Do individual characteristics affect online learning behaviors? An analysis of learners sequential patterns. J Res Technol Educ. 55 (4), 663-683 (2023).
- Wang, Y. Affective state analysis during online learning based on learning behavior data. Tech Knowl Learn. 28 (3), 1063-1078 (2023).
- Wang, K., Zheng, K., Wang, Y. Construction and empirical research of a subjective-and-objective-analysis model of the online learning behavior. Soft Comput. 29 (6), 2971-2982 (2025).
- Yang, J. Accurate prediction and analysis of college students' performance from online learning behavior data. IEIE Trans Smart Process Comput. 12 (5), 404-411 (2023).
- Du, K., et al. Image-Based Intelligent Classroom Monitoring and Learning Behavior Analysis via Joint Object Detection and Semantic Segmentation. Traitement Signal. 42 (4), 2323-2332 (2025).
- Alqahtani, S. Leveraging techniques of epistemic network analysis to discover behaviors of student learning reflections in online learning environments. Eng Technol Appl Sci Res. 14 (3), 14191-14199 (2024).
- Li, Y., Wang, X., Chen, F., Zhao, B., Fu, Q. Online learning behavior analysis and prediction based on spiking neural networks. J Social Comput. 5 (2), 180-193 (2024).
- Zeng, B. Visual interactive mobile analysis of online English learning behavior based on lagged sequence analysis approach. Int J Interact Mob Technol. 18 (10), 34-47 (2024).
- Zhao, M., Zhang, Z. Prediction of online learning behavior in universities based on long short-term memory networks. J Comput Methods Sci Eng. 25 (1), 502-513 (2025).
- Li, F., et al. SPOC online video learning clustering analysis: Identifying learners' group behavior characteristics. Comput Appl Eng Educ. 31 (4), 1059-1077 (2023).
- Atenyi, J. M., Wang, C. J. Fractional fuzzy inference system design and implementation for temperature control. Iran J Fuzzy Syst. 22 (2), 171-186 (2025).
- Alves, K., Ballini, R., Eduardo, P. Financial series forecasting: A new fuzzy inference system for crisp values and interval-valued predictions. Comput Econ. 65 (6), 3673-3721 (2025).
- TuuSzabo, B., Koczy, L. T. A highly accurate Mamdani fuzzy inference system for tennis match predictions. Fuzzy Optim Decis Making. 24 (1), 99-127 (2025).
- Chen, Y., Li, C. Study on sensible beginning divided-search enhanced Karnik-Mendel algorithms for centroid type-reduction of general type-2 fuzzy logic systems. AIMS Math. 9 (5), 11851-11876 (2024).
- Fumanal-Idocin, J., Andreu-Perez, J., Cordon, O., Hagras, H., Bustince, H. ARTxAI: Explainable Artificial Intelligence Curates Deep Representation Learning for Artistic Images Using Fuzzy Techniques. IEEE Trans. Fuzzy Syst. 32 (4), 1915-1926 (2024).
- Duan, L., Paknejad, J., Kim, H. Employee attrition prediction with convolutional neural network and synthetic minority over-sampling technique. J Bus Analytics. 8 (1), 24-35 (2025).
- Luo, H., Zeng, X., Chen, Y. Research on text classification of coal mine safety hazards based on SMOTE+ENN. China Mining Mag. 34 (1), 116-125 (2025).
- Binbusayyis, A., Mohemmed, S. Stability prediction in smart grid using PSO optimized XGBoost algorithm with dynamic inertia weight updation. CMES - Comput Model Eng Sci. 142 (1), 909-931 (2025).
- Mosa, M. A. Optimizing text classification accuracy: a hybrid strategy incorporating enhanced NSGA-II and XGBoost techniques for feature selection. Prog Artif Intell. 14 (2), 275-299 (2025).
- Luo, S. An interior design method based on the coupling of I-GWO and self-updating neural network under the background of green interaction. Int J Sustain Dev. 28 (1), 43-57 (2025).
- Prabhakar, K., Jain, S. K., Padhy, P. K. Virtual inertia control of isolated microgrids using GWO-optimized modified IMC controller. Trans Inst Meas Control. 47 (4), 733-745 (2025).
- Lai, Y., Kang, L., Cao, W. A multi-objective particle swarm optimization using logistics-tent chaotic map with GOBL and non-inertial Lévy flight. J Comput (Taiwan). 36 (1), 59-74 (2025).
- Hasibur, R., Uddin, M. A., Ria, Z. F., Rahman, R. M. Optimizing BERT for Bengali Emotion Classification: Evaluating Knowledge Distillation, Pruning, and Quantization. Comput. Model. Eng. Sci. 142 (2), 1637-1666 (2025).
- Liang, G., Jiang, C., Ping, Q., Jiang, X. Academic performance prediction associated with synchronous online interactive learning behaviors based on the machine learning approach Interact. Learn. Environ. 32 (6), 3092-3107 (2024).
- Mei, L. Model Construction of Higher Education Quality Assurance System Based on Fuzzy Neural Network. Informatica. 10 (10), 153-164 (2024).
Access restricted. Please log in or start a trial to view this content.
Reprints and Permissions
Erratum
Formal Correction: Erratum: Multi-Perspective Fuzzy Reasoning and XGBoost-Based Analysis of Online Learning Behavior
Posted by JoVE Editors on 5/25/2026. Citeable Link.
This corrects the article 10.3791/69515