This protocol describes the use of physiological indicators to measure variations in cognitive load across different task difficulty levels in human-AI collaborative tasks. The findings suggest that people adapt their decision-making processes according to task difficulty, thereby reflecting different levels of cognitive load.
A subscription to JoVE is required to view this content. Sign in or start your free trial.
Method Article
Estimate the Cognitive Load Using Electrocardiographic Measure: A Human-AI Collaborative Task
In This Article
Summary
Abstract
In workplace settings, individuals' cognitive load is closely tied to both performance and safety. As collaboration between humans and artificial intelligence (AI) becomes a growing trend, the ability to capture cognitive load dynamics in a real-time and objective manner during collaborative processes has become increasingly critical. Traditionally, cognitive load has been assessed through questionnaires; however, such retrospective methods are limited in their capacity to accurately capture the moment-to-moment fluctuations in cognitive load throughout task execution. In contrast, physiological signals allow for continuous monitoring of an individual's real-time state, thereby providing a more objective measure of cognitive load. Task difficulty may influence participants' expectations, which subsequently shape their behaviors and ultimately affect cognitive load. This study implements a generalizable human-AI collaborative task that incorporates multiple levels of difficulty. The average accuracy of the AI system was disclosed to participants prior to the start of the task. In each trial, participants were given the option either to complete the task themselves or to delegate it to the AI. The aim of this protocol is to use electrocardiographic (ECG) data as physiological indicators to examine how individuals' cognitive load changes when they have the authority to allocate tasks and collaborate with AI under different difficulty levels. This study further explores the internal state dynamics revealed by physiological data during human-AI collaboration. The findings provide a scientific basis for improving collaboration models, enhancing efficiency, and leveraging the complementary strengths of humans and AI to achieve better resource integration in complex tasks.
Introduction
Cognitive load refers to the total amount of mental activity imposed on an individual's cognitive system within a given period of task performance1. Elevated cognitive load can impair human performance and is a major contributor to workplace accidents2. High cognitive load states affect cardiac activity by activating the sympathetic nervous system and inhibiting the parasympathetic nervous system, thereby increasing heart rate (HR) and decreasing heart rate variability (HRV)3. Expectancy beliefs refer to the extent to which individuals believe they can successfully complete a specific task or activity4. Task difficulty influences individuals' expectancy beliefs, which in turn regulate their behavioral engagement and allocation of cognitive resources, ultimately manifesting as different levels of cognitive load.
Electrocardiography (ECG) provides a high-temporal-resolution record of the heart's electrical activity. HR and HRV indices derived from ECG signals capture different aspects of cardiac rhythm and serve as psychophysiological indicators of an individual's physical and mental stress5. HR reflects the overall frequency of cardiac contractions and can be used to assess the basic state of the cardiovascular system. HRV represents the temporal variation between successive heartbeats and serves as an indicator of the autonomic nervous system (ANS) regulation, reflecting the dynamic balance between sympathetic and parasympathetic activity6,7,8. The sympathetic nervous system is activated under stress, threat, or high-intensity activity, often leading to increased HR and decreased HRV. Conversely, the parasympathetic nervous system is activated during relaxation, sleep, or low-energy-demand states, typically resulting in decreased HR and increased HRV.
Current physiological methods for measuring cognitive load include ECG activity, electroencephalographic (EEG) activity, respiration, blood pressure, and ocular indices9. Compared with traditional retrospective questionnaires, physiological measurements provide a better means of capturing participants' real-time states, thereby avoiding recall bias and the temporal delay effects inherent in self-report approaches. Portable ECG devices enable continuous and unobtrusive assessment of participants' state while they are engaged in ongoing tasks10. Compared with other physiological measurement techniques, portable ECG represents a low-cost, non-invasive method that allows participants to perform tasks in a more natural and flexible manner within their environment11. Average HR tends to increase as cognitive task difficulty rises12, and HRV has been shown to be highly responsive to both mental and physical demands13. Considering that the present task is expected to impose substantial mental effort and a modest level of physical load, and given the practical needs of task delegation scenarios in human-AI collaboration, HR and HRV are appropriate indices for measuring cognitive load.
HR and HRV have been widely applied to the study of cognitive load across multiple domains, including aviation14, driving15, and economic decision-making16, providing powerful tools for the continuous and objective assessment of human states. With the growing integration of AI into the workplace, understanding changes in cognitive load during human-AI collaboration has become increasingly important. One study investigating AI-assisted decision-making found that under conditions of high cognitive load, humans exhibited an irrational reliance on AI-generated suggestions17. In collaborative settings, the role of AI may extend beyond providing advisory input, enabling humans and AI to jointly complete tasks. The present study focuses on a novel collaboration mode in which humans have task-allocation authority and may choose, for each task, whether to complete it themselves or delegate it to the AI. However, in this specific context where humans have task-allocation authority, it remains unclear how task difficulty influences decision-making behavior and, consequently, reflects different levels of cognitive load. Therefore, this study aims to employ portable ECG devices to measure HR and HRV with precision, thereby objectively quantifying the dynamic changes in cognitive load under this collaborative paradigm.
The human-AI collaborative task selected for this experiment is a general task adapted from the paradigm proposed by Fügener et al.18. The advantage of using such a generalizable task is that it does not require participants to undergo specialized training and can be readily transferred to more domain-specific tasks. In the study described here, the experimental task involves image classification, in which participants are asked to assign a target image to one of several image category groups. A classification is considered correct if the selected category group matches the true category of the target image. The target images were drawn from the ImageNet database, where categories have already been validated. For each category group option, ten example images were provided to participants to reduce the likelihood that they might be unaware of certain categories19. We employed GoogLeNet Inception v3 as the AI model20, which had been trained on 1,000 potential image categories and achieved an average classification accuracy of 0.76.
We conducted a preliminary experiment to determine the difficulty level of the target images. In this preliminary experiment, participants were required to classify all images on their own. The sample size of 217 participants in the present study was determined with reference to the human-only condition reported by Fügener et al.18. In a collaborative task, it is generally desirable to assign each task to the party best suited to perform it. To operationalize task difficulty, we compared the accuracy for each image with the AI's average accuracy. Images with human accuracy lower than the AI's average accuracy were defined as those more suitable for AI completion -- that is, images that are relatively difficult for humans. In the formal experiment, we selected 32 images in total, including 16 easy images and 16 difficult images.
An a priori power analysis was conducted using G*Power 3.1 for a Wilcoxon signed-rank test21. We assumed a medium effect size, a two-tailed α level of 0.05, and a desired power of 0.90. The analysis indicated that a minimum of 47 participants was required. We recruited 60 students from the campus who had not previously participated in similar experimental tasks. The inclusion criteria were as follows: all participants were right-handed, had not taken any medication recently, had abstained from caffeine and alcohol for 24 h prior to the experiment, had not engaged in vigorous physical exercise on the day before the experiment, had maintained adequate sleep the night before the session, and reported no cardiovascular or respiratory diseases. The participants' mean age was 22.77 ± 1.25 years. The experimental setup is shown in Figure 1.
Before the experiment began, participants were informed that they would perform an image-classification task together with an AI. They were told the AI's average accuracy and instructed that, for each target image, they could either classify it themselves or delegate the classification to the AI. If participants chose to complete the task themselves, they responded by pressing one of the five keys (A, B, C, D, or E) on the keyboard to select an answer from the five image options. Pressing the designated key (P) indicated that the task was delegated to the AI, although participants could not see the AI's chosen answer. A marker was written at both the onset and the offset of each stimulus for subsequent analysis. Before the formal experiment began, participants completed 4 practice trials, followed by a 120 s resting period. They then proceeded to the 32-trial formal experiment. A 10 s inter trial interval was provided between each trial. The experimental procedure is illustrated in Figure 2.
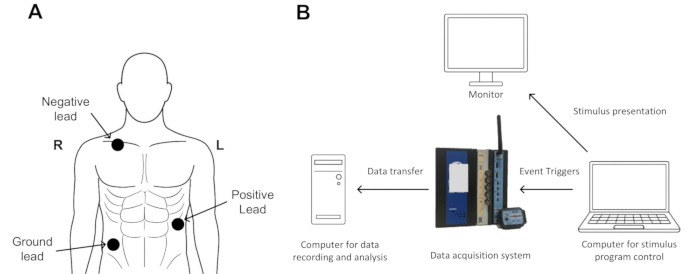
Figure 1: Experimental setup. The figure shows the equipment used in the experiment and the placement of ECG measurement electrodes. (A) Schematic of ECG electrode placement; (B) Experimental setup. Please click here to view a larger version of this figure.
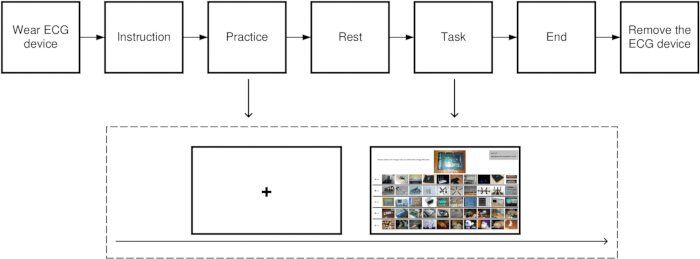
Figure 2: Experimental procedure. The practice session consisted of 4 trials, and the formal experiment included 32 trials. The experimental program was developed using E-Prime (see Table of Materials). Abbreviation: ECG = Electrocardiogram. Please click here to view a larger version of this figure.
Access restricted. Please log in or start a trial to view this content.
Protocol
This study was conducted in accordance with the principles of the Declaration of Helsinki and was approved by the Institutional Review Board of Jiangsu University of Science and Technology. Informed consent was obtained from all participants, who agreed to the use and publication of their data. No temperature-sensitive or hazardous procedures are included in this protocol.
1. Preparation
- Introduce the experimental procedure to participants, and obtain written informed consent after they are fully informed of the study.
- Prepare the ECG data acquisition system and all required materials, including the transmitter, receiver, stretchy Velcro straps, electrode lead set, power cable, M/F Ribbon Cable, ethernet cable, alcohol wipes, and medical tape (see Table of Materials).
- Prepare an adequate number of pre-gelled disposable ECG electrodes.
- Connect the data acquisition system to the ECG data receiver module. Then plug the system into a stable power supply.
- Use the M/F Ribbon Cable to establish a connection between the data acquisition system and the computer used for stimulus presentation.
- Use an Ethernet cable to connect the data acquisition computer to the data acquisition hardware system.
2. Instrument setup
- Clean the participant's skin using alcohol wipes at the following sites: below the left rib, below the right clavicle, and on the right abdomen. Attach a disposable ECG electrode patch at each site.
- Connect the lead wires.
- Attach the lead-wire connector securely to the ECG transmitter.
- Connect the metal clip of the red lead wire (positive lead) to the ECG electrode placed below the left rib; connect the metal clip of the white lead wire (negative lead) to the ECG electrode placed below the right clavicle; and connect the metal clip of the black lead wire (ground lead) to the ECG electrode placed on the right abdomen.
NOTE: Ensure that each clip is fully seated and does not rotate or loosen after attachment. If a lead wire is longer than needed, segment and secure it to the skin with medical tape to minimize artifacts caused by wire movement.
- Secure the ECG transmitter to the participant's body using stretchy hook-and-loop fastener straps. Adjust the strap tension to keep the transmitter stable while ensuring participant comfort.
NOTE: Avoid placing straps directly over the ECG electrode patches to prevent signal distortion or electrode displacement.
3. Data acquisition
- Turn on the ECG transmitter switch and the power of the ECG data acquisition system, and establish a wireless connection between the ECG transmitter and the ECG receiver of the data acquisition system.
NOTE: A correct connection is indicated by green lights on both the ECG transmitter and the ECG receiver. - Launch the ECG data acquisition software (see Table of Materials), create a new graph file, select the ECG receiver module from the device list, and choose the appropriate ECG recording channel.
NOTE: Adjust the channel selection panel on the ECG receiver to ensure that the hardware channel matches the selected software channel. - Click Start in the data acquisition software interface to begin ECG data collection. Verify that the ECG waveform appears stable on the screen.
- Instruct the participant to begin the experimental task.
NOTE: Remind participants to rest their backs comfortably against the chair and maintain a stable posture throughout the tasks. - After the task is completed, click Stop in the data acquisition software to end the recording session.
- Detach the lead-wire clips from the electrode patches. Loosen the stretchy hook-and-loop fastener straps and remove the ECG transmitter from the participant's body.
- Instruct and assist the participant in gently removing the disposable electrode patches by hand.
4. Data processing
- Open the recorded ECG data file in the data analysis software (see Table of Materials).
- Select the ECG channel and apply digital filtering.
- In the top menu bar, navigate to Transform > Digital Filters > Comb Band Stop.
- In the dialog box, select Fixed at under Base Frequency. Enter 50 Hz and click OK to apply the filter.
NOTE: The frequency entered should correspond to the power line frequency of the country where the data are collected. - Click Transform in the top menu. Select Digital Filters > FIR > Band Pass. Under Frequency cutoff, select Fixed at and enter 1 Hz. Under High Frequency cutoff, choose Fixed at and enter 35 Hz.
- Create Focus Areas according to the experimental design.
5. Data analysis
- Generate and export HR data. From the menu bar, select Analysis > Hemodynamics > ECG Interval Extraction. In the Analyze panel, choose Focus Areas Only, and in the Display results as panel, select Excel Spreadsheet Only. Click OK to confirm.
NOTE: R-peak detection was performed using the built-in QRS detection algorithm in data analysis software (AcqKnowledge 5). - Generate HRV data and export both time-domain and frequency-domain results.
- Open Analysis, select HRV and RSA > Multi-epoch HRV - Statistical. In the ECG Channel field, select the preprocessed ECG channel. Under Extract HRV statistics for, select Focus Areas. In Output results to, select Spreadsheet. Finally, click OK to generate and export the HRV time-domain results.
- Open Analysis again, select HRV and RSA > Multi-epoch HRV and RSA - Spectral. In the ECG Channel field, select the preprocessed ECG channel. Under Extract HRV and RSA for, select Focus Areas. In Output type, select Excel Spreadsheet Only. Finally, click OK to generate and export the HRV frequency-domain results.
Access restricted. Please log in or start a trial to view this content.
Results
In the physiological measurements, we focused on HR and HRV indices in both the time and frequency domains. For the time domain, we selected Root Mean Square of Successive Differences (RMSSD), which is considered a robust measure22,23,24. For the frequency domain, although the Low Frequency/High Frequency ratio (LF/HF) is often interpreted as reflecting the balance between sympathetic and parasympathetic activity, this interpret...
Access restricted. Please log in or start a trial to view this content.
Discussion
In this study, the quality of ECG signal acquisition was critical for subsequent analyses. During the experimental procedure, correct electrode placement and proper connection with the leads were essential prerequisites for accurate signal recording. All electrodes were placed at the designated positions and ensured good skin contact to minimize impedance. In addition, to reduce the influence of external factors on physiological signals, participants were instructed to abstain from caffeine before the experiment and to a...
Access restricted. Please log in or start a trial to view this content.
Disclosures
The authors have nothing to disclose.
Acknowledgements
This study was supported by the Postgraduate Research & Practice Innovation Program of Jiangsu Province (KYCX25_4311), National Natural Science Foundation of China (72374088, 72471105, 72472094, 72001096), 2024 Key Project of Higher Education Science Research Planning of China Association of Higher Education (24XX0205, Mechanisms of Human-AI Collaboration Strategies in Enhancing Learning Outcomes), 2024 Key Project of Education Science Planning in Jiangsu Province (B-b/2024/01/162, Model Construction and Empirical Research on Multimodal Learning from the Perspective of Educational Neuroscience) and the Humanities and Social Science Fund of Ministry of Education of China (24YJCZH445).
Access restricted. Please log in or start a trial to view this content.
Materials
| Name | Company | Catalog Number | Comments |
|---|---|---|---|
| Alcohol wipes | - | - | This is used to clean and disinfect the skin. |
| Acqknowledge 5.0 | BIOPAC | This is software for signal data acquisition and data analysis. | |
| Desktop computer | Dell | OptiPlex | This desktop is used to run the software for ECG acquisition and analysis. |
| ECG data acquisition device | BIOPAC | MP160 | This device is used to record ECG data. |
| ECG electrodes | Shenfeng | S series | This is an accessory used to collect ECG signals. |
| Electrode lead set | BIOPAC | BN-EL45-LEAD3 | This is used for data logging along with the transmitter. |
| Ethernet cable | BIOPAC | - | This is used to connect the MP160 system and the data acquisition and analysis software. |
| Experimental software | PSYCHOLOGY SOFTWARE TOOLS | E-prime3.0 Build 3.0.3.31 | This is the software used to make the experimental program. |
| Laptop | Dell | E5470 | This laptop is used to run the experimental program and present the stimuli. |
| M/F Ribbon Cable | BIOPAC | CBL110C | This is used to transmit specific signals. |
| Medical tape | - | - | This is used to secure long wires. |
| Power cable | BIOPAC | - | This is used to power the device. |
| Receiver | BIOPAC | BN-RSPEC-R | This is a ECG receiver. |
| Stretchy Velcro straps | BIOPAC | BN-STRAP-137 | This is used to help fix the ECG transmitter. |
| Transmitter | BIOPAC | BN-RSPEC-T | This is a wireless ECG transmitter. |
References
- Sweller, J. Cognitive load during problem solving: Effects on learning. Cogn Sci. 12 (2), 257-285 (1988).
- Matthews, G., Reinerman-Jones, L. E., Barber, D. J., Abich, J. The psychometrics of mental workload: Multiple measures are sensitive but divergent. Hum Factors. 57 (1), 125-143 (2015).
- Delliaux, S., Delaforge, A., Deharo, J. C., Chaumet, G. Mental workload alters heart rate variability, lowering non-linear dynamics. Front Physiol. 10, (2019).
- Eccles, J. S., Wigfield, A. Motivational beliefs, values, and goals. Annu Rev Psychol. 53, 109-132 (2002).
- Carissoli, C., Negri, L., Bassi, M., Storm, F. A., Delle Fave, A. Mental workload and human-robot interaction in collaborative tasks: A scoping review. Int J Hum-Comput Interact. 40 (20), 6458-6477 (2024).
- Rajendra Acharya, U., Paul Joseph, K., Kannathal, N., Lim, C. M., Suri, J. S. Heart rate variability: A review. Med Biol Eng Comput. 44 (12), 1031-1051 (2006).
- Shaffer, F., Ginsberg, J. P. An overview of heart rate variability metrics and norms. Front Public Health. 5, 258(2017).
- Complexity modulation in functional brain-heart interplay series driven by emotional stimuli: an early study using fuzzy entropy. Catrambone, V., et al. Annu Int Conf IEEE Eng Med Biol Soc, , 2023-2026 (2022).
- Charles, R. L., Nixon, J. Measuring mental workload using physiological measures:A systematic review. Appl Ergon. 74, 221-232 (2019).
- Jorna, P. Spectral-analysis of heart-rate and psychological state:A review of its validity as a workload index. Biol Psychol. 34 (2-3), 237-257 (1992).
- Cinaz, B., Arnrich, B., La Marca, R., Tröster, G. Monitoring of mental workload levels during an everyday life office-work scenario. Pers Ubiquit Comput. 17 (2), 229-239 (2013).
- Alshanskaia, E. I., Zhozhikashvili, N. A., Polikanova, I. S., Martynova, O. V. Heart rate response to cognitive load as a marker of depression and increased anxiety. Front Psychiatry. 15, 1355846(2024).
- Eesee, A. K., Varga, V., Eigner, G., Ruppert, T. Impact of work instruction difficulty on cognitive load and operational efficiency. Sci Rep. 15 (1), 11028(2025).
- Wang, L., Gao, S., Tan, W., Zhang, J. Pilots' mental workload variation when taking a risk in a flight scenario: A study based on flight simulator experiments. Int J Occup Saf Ergon. 29 (1), 366-375 (2023).
- Radhakrishnan, V., et al. Physiological indicators of driver workload during car-following scenarios and takeovers in highly automated driving. Transp Res Part F Traffic Psychol Behav. 87, 149-163 (2022).
- Korosec-Serfaty, M., Riedl, R., Senecal, S., Leger, P. -M. Attentional and behavioral disengagement as coping responses to technostress and financial stress: An experiment based on psychophysiological, perceptual, and behavioral data. Front Neurosci. 16, 883431(2022).
- Zhang, Z. T., et al. Measuring the effect of mental workload and explanations on appropriate AI reliance using EEG. Behav Inf Technol. , (2024).
- Fügener, A., Grahl, J., Gupta, A., Ketter, W. Cognitive challenges in human-artificial intelligence collaboration: Investigating the path toward productive delegation. Inf Syst Res. 33 (2), 678-696 (2022).
- Russakovsky, O., et al. Imagenet large scale visual recognition challenge. Int J Comput Vis. 115 (3), 211-252 (2015).
- Rethinking the inception architecture for computer vision. Szegedy, C., Vanhoucke, V., Ioffe, S., Shlens, J., Wojna, Z. 2016 IEEE Conference on Computer Vision and Pattern Recognition (CVPR), Las Vegas, NV, USA, , 2818-2826 (2016).
- Faul, F., Erdfelder, E., Buchner, A., Lang, A. -G. Statistical power analyses using G*Power 3.1:Tests for correlation and regression analyses. Behav Res Methods. 41 (4), 1149-1160 (2009).
- Melo, H. M., Hoeller, A. A., Walz, R., Takase, E. Resting cardiac vagal tone is associated with long-term frustration level of mental workload: Ultra-short term recording reliability. Appl Psychophysiol Biofeedback. 45 (1), 1-9 (2020).
- Munoz, M. L., et al. Validity of (ultra-)short recordings for heart rate variability measurements. PLoS One. 10 (9), e0138921(2015).
- Laborde, S., Mosley, E., Thayer, J. F. Heart rate variability and cardiac vagal tone in psychophysiological research - recommendations for experiment planning, data analysis, and data reporting. Front Psychol. 8, 213(2017).
- Billman, G. E. The LF/HF ratio does not accurately measure cardiac sympatho-vagal balance. Front Physiol. 4, 26(2013).
- Lai, H. -M. Understanding what determines university students' behavioral engagement in a group-based flipped learning context. Comput Educ. 173, 104290(2021).
- Grassmann, M., Vlemincx, E., Von Leupoldt, A., Van Den Bergh, O. Individual differences in cardiorespiratory measures of mental workload: An investigation of negative affectivity and cognitive avoidant coping in pilot candidates. Appl Ergon. 59, 274-282 (2017).
- Han, L., Du, Z. G. Unraveling the complex interplay between curved tunnels and drivers' physiological responses: An HRV perspective. Transp Res Part F Traffic Psychol Behav. 108, 39-53 (2025).
- Goldstein, D. S., Bentho, O., Park, M. -Y., Sharabi, Y. Low-frequency power of heart rate variability is not a measure of cardiac sympathetic tone but may be a measure of modulation of cardiac autonomic outflows by baroreflexes. Exp Physiol. 96 (12), 1255-1261 (2011).
- Zimmermann-Viehoff, F., et al. Short-term effects of espresso coffee on heart rate variability and blood pressure in habitual and non-habitual coffee consumers: A randomized crossover study. Nutr Neurosci. 19 (4), 169-175 (2016).
- Saxena, M. P. K., Ganuthula, V. R. R. Relationship between feedback frequency and task performance: Evidence on the mediating role of heart rate. Front Psychol. 16, 1438865(2025).
- Longo, L., Wickens, C. D., Hancock, G., Hancock, P. A. Corrigendum: Human mental workload: A survey and a novel inclusive definition. Front Psychol. 13, 883321(2022).
- Arutyunova, K. R., et al. Heart rate dynamics for cognitive load estimation in a driving simulation task. Sci Rep. 14 (1), 31656(2024).
- Wittels, H. L., et al. Examining the influence of cognitive load and environmental conditions on autonomic nervous system response in military aircrew: A hypoxia-normoxia study. Biology (Basel). 13 (5), 343(2024).
- Pütz, S., Mertens, A., Chuang, L. L., Nitsch, V. Physiological predictors of operator performance: The role of mental effort and its link to task performance. Hum Factors. 67 (6), 595-615 (2025).
- Cheng, S., et al. Acute combined effects of concurrent physical activities on autonomic nervous activation during cognitive tasks. Front Physiol. 15, 1340061(2024).
- Bansal, A., Joshi, R. Portable out-of-hospital electrocardiography: A review of current technologies. J Arrhythmia. 34 (2), 129-138 (2018).
- Sridhar, A. R., et al. State of the art of mobile health technologies use in clinical arrhythmia care. Commun Med (Lond). 4 (1), 218(2024).
- Gupta, K., et al. CaEVR: Biosignals-driven context-aware empathy in virtual reality. IEEE Trans Vis Comput Graph. 30 (5), 2671-2681 (2024).
- Binsch, O., et al. The effect of virtual reality simulation on police officers' performance and recovery from a real-life surveillance task. Multimed Tools Appl. 82 (11), 17471-17492 (2023).
- Brunzini, A., Grandi, F., Peruzzini, M., Pellicciari, M. An integrated methodology for the assessment of stress and mental workload applied on virtual training. Int J Comput Integr Manuf. 37 (9), 1088-1106 (2024).
- Cardone, D., et al. Classification of drivers' mental workload levels: Comparison of machine learning methods based on ECG and infrared thermal signals. Sensors (Basel). 22 (19), 7300(2022).
Access restricted. Please log in or start a trial to view this content.
Reprints and Permissions
