There is a critical need to monitor how ticks and their wildlife hosts respond to urbanization. This protocol outlines the steps for developing a standardized Tick and Wildlife Urban Surveillance System that will enable adaptive management in response to emerging tick-borne hazards in urban environments.
Method Article
Cities As Interfaces of Zoonotic Hazard Emergence: Development of the New York City Tick and Wildlife Urban Surveillance System
* These authors contributed equally
In This Article
Summary
Abstract
Tick-borne hazards in urban landscapes are increasing, yet critical gaps remain in understanding human tick-borne disease risk across urbanization gradients. With the loss of natural habitat globally, urban greenspaces can provide a critical habitat for wildlife with varying consequences for tick-borne disease emergence. The New York City metropolitan area has the highest human population density and geographic footprint of any city in the United States, while containing a vast network of greenspaces. These urban greenspaces vary in surrounding land cover and connectivity, providing important refugia and habitat for hundreds of urban wildlife species, which have been historically understudied. To the best of the authors' knowledge, there are no urban tick surveillance systems in place to monitor how ticks and their wildlife hosts respond to and emerge in urban environments. To address this gap, a long-term urban tick and wildlife surveillance system was developed across an urbanization gradient from New York City through Long Island, NY. Here, we describe the process of working with a diverse group of partners to design, implement, and maintain a paired wildlife camera trapping and tick surveillance system. The process began by the formation of an advisory committee of tick-borne disease experts and wildlife management partners who provided insights and feedback to collaboratively work through the following steps: 1) initial urbanization gradient visualization and delineation, 2) potential greenspace selection, 3) site permissions, 4) wildlife camera and tick collection site selection, 5) wildlife camera placement, 6) tick collections, 7) tick identification, 8) wildlife camera photo identification, and 9) transect maintenance and reporting outcomes. As New York City and other cities across the globe continue to grow, collaborative projects such as the Tick and Wildlife Urban Surveillance System can generate knowledge that will help people respond to emerging zoonotic hazards in urban environments.
Introduction
The majority of the world's human population lives in urban areas, which are steadily growing in both population and geographic footprint1. While urban expansion is one of the leading threats to global biodiversity1,2,3, urban areas are also increasingly managed to provide habitat for wildlife via urban greening, as natural habitats are altered and fragmented4,5,6,7. The combination of dense human populations and wildlife in cities can lead to both positive (e.g., feeling connected to nature)8 and detrimental (e.g., zoonotic disease transmission)9 human-wildlife interactions. Historically, wildlife in urban systems has been understudied10, creating a critical gap for understanding wildlife persistence, zoonotic disease risk11, and human-wildlife coexistence12 in a changing world.
The Northeastern United States (U.S.) is intensely urbanized13 and a hotspot for blacklegged ticks (Ixodes scapularis) and tick-borne disease emergence14, with spatial differences in risk across the region15. Tick-borne diseases, such as Lyme disease, are the most reported vector-borne disease in the U.S., with nearly 500,000 cases a year14. In New York state, blacklegged ticks transmit several pathogens of public health concern, including Borrelia burgdorferi (Lyme disease agent), Anaplasma phagocytophilum (Anaplasmosis agent), Babesia microti (Babesiosis agent), and Powassan virus (agent of Powassan virus disease)16. In addition to the blacklegged tick, the longhorned tick (Haemaphysalis longicornis) has rapidly become established in the Northeast after its recent introduction17,18, and other native tick vectors such as the lone star tick (Amblyomma americanum), which can cause alpha-gal syndrome19, are increasing in population and expanding their range northward20,21, presenting new public health challenges.
Though urban tick-borne hazards are increasing15,22, most tick research has focused on rural and suburban areas22,23,24, creating critical gaps in understanding tick-borne pathogen ecology across urbanization gradients and in urban greenspaces15,25. Active surveillance of ticks, wildlife hosts, and host predators is necessary to inform evidence-based local management practices26.
New York City (NYC) has the largest human population of any city in the U.S.13. In 2020, an estimated >8.4 million people lived in NYC's five boroughs13, and >20.1 million people in the wider metropolitan area13. Though NYC has a higher average housing density (approximately 4700 housing units per km2) than any other city in the U.S.13, the city also contains over 29,000 acres (14% of land cover) of parklands stewarded by the NYC Department of Parks and Recreation27, which provides important habitat and refugia for hundreds of wildlife species28,29. The city is located along the Atlantic Flyway, a migration path for millions of birds30,31, and has recently been recolonized by several meso-mammal species, notably including the eastern coyote (Canis latrans x Canis lycaon)32, striped skunk (Mephitis mephitis)33, and white-tailed deer (Odocoileus virginianus)34.
As NYC invests in regreening35, the frequency of human-wildlife interactions is likely to increase36. While increases in urban biodiversity can be a sign of a healthy ecosystem37 and can restore a sense of nature to urban lives38, interactions with urban wildlife can also result in the transmission of zoonotic pathogens11,39. Urban-adapted mammals such as the common raccoon (Procyon lotor) are species of interest in this regard since they can be more tolerant of urbanization than other larger mammals40,41 and may mediate transmission of zoonotic pathogens in urban areas42. White-tailed deer are an additional species of interest, as their presence in urban greenspaces has been found to increase tick abundance and drive Lyme disease risk25,43.
Within the city limits of NYC, there is a robust vector surveillance program run by the Department of Health; however, ticks are not surveyed as extensively across the city's most urban greenspaces44,45,46. Adjacent county-level tick surveillance efforts vary in intensity47,48, making cross-municipal boundary comparisons difficult. There have been multiple studies of urban tick-borne hazards17,18,43,46,49 and wildlife33,34,50,51 within city limits, providing valuable insight on how ticks, tick-borne pathogens, and wildlife may respond to and utilize urban environments. However, the effects of urbanization on tick-borne hazards and wildlife communities extend beyond a city's core across urbanization gradients15,52,53,54. To the best of the authors' knowledge, there are no urban tick surveillance systems in place to monitor how ticks and their wildlife hosts emerge in environments across urbanization gradients.To help New Yorkers respond to emerging tick-borne hazards and coexist with wildlife, a diverse group of NYC partners worked to develop a Tick and Wildlife Urban Surveillance System (TWUSS) across an urbanization gradient from NYC through Long Island, NY.
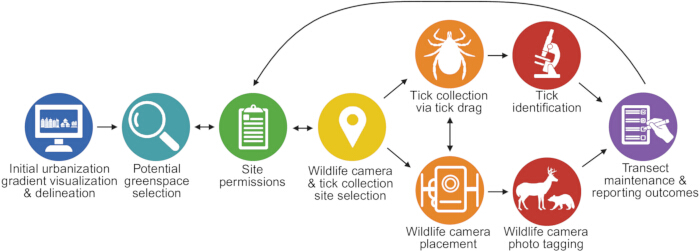
Figure 1. Steps for designing, implementing, and maintaining the Tick and Wildlife Urban Surveillance System. Feedback arrows are shown between potential greenspace selection, site permission, and selection of tick collection and wildlife camera sites. Figure created with BioRender. Please click here to view a larger version of this figure.
Prior to establishing the TWUSS, an advisory committee was formed comprising key wildlife management partners and tick-borne hazard ecology experts who provided insights and feedback on the transect design (Figure 1). Monthly meetings were held to establish project goals, agreeing that the primary scientific goal was to include sites spanning a gradient of urbanization, habitat connectivity, and patch size. The inclusion of multiple advisors incorporated deep local knowledge of the area. For example, feedback between partners helped plan for the possibility of the network capturing the dynamics of coyote expansion and spread on Long Island32. Partner feedback also facilitated inclusion of sites where managers were known to be willing to provide access, community groups could help with wildlife cameras and/or photo tagging, and team members had personal ties that enabled site access.
Wildlife camera traps (also called trail or game cameras; hereafter termed wildlife cameras) have been widely adopted as a non-invasive and relatively low-cost method for collecting data on wildlife, transforming how wildlife studies are routinely performed55,56. Wildlife cameras enable the collection of large amounts of imagery data that would not be possible through traditional field observation methods57. The Urban Wildlife Information Network (UWIN) developed a wildlife camera trapping transect design, which is shared among member partner cities globally to monitor local wildlife distributions across urban gradients58. The UWIN transect design was adapted, and wildlife cameras were paired with tick collections in the creation of the TWUSS (Figure 1). "Tick drags" were used for tick sampling as a standard method for estimating tick densities59. The nymphal life stage of ticks was targeted for sampling, as nymphal ticks are the predominant vector of tick-borne pathogens to humans. Tick sampling was therefore conducted from the end of May through the end of July, in alignment with peak nymphal I. scapularis tick activity in the Northeast US60.
For a city partner to join the UWIN network, the main requirement is to establish at least one transect that can accommodate 25-30 wildlife camera station sites58; there is no minimum length requirement, nor does the transect need to follow a straight line. For the UWIN network requirements, wildlife camera stations can be established in any area that wildlife use, including backyards58. However, the TWUSS focuses on public or semi-public greenspaces, including city parks, cemeteries, forest preserves, golf courses, or large gardens for wildlife camera placements to capture the distribution of more sensitive target species, such as white-tailed deer and skunks6. The NYC transect is 55 km in length and 4 km wide, broken into ten 5 km-long segments. Four wildlife camera stations were established in each segment in 2022 for a total of 40 wildlife sampling locations spanning Brooklyn through Nassau County, NY. In 2023, an additional segment was added in Staten Island, NY. For tick collections, golf courses were excluded due to their use of insecticides and active tick management, which may interfere with the data61, resulting in 29 of the wildlife camera sites also becoming sites for tick collections.
The TWUSS differs from other tick surveillance systems in the urbanization gradient transect design and the pairing of standardized tick and wildlife data collection methods26,62,63. Many governmental and non-governmental institutions are engaged in tick surveillance64. However, most tick surveillance efforts have a limited objective of detecting tick presence and rely on passive, unstandardized surveillance methods62,63,65. Passive surveillance methods (i.e., tick reports on community science platforms) are advantageous over active surveillance methods in their low cost and relative effort to maintain62,66 but do not allow for a deep understanding of spatial and temporal trends63. In 2020, the Centers for Disease Control and Prevention (CDC) published a comprehensive guide to active tick surveillance that includes detailed directions for conducting tick drags, yet contains only general guidance on site selection59, a critical step for evaluating tick hazard67. Additionally, current tick surveillance methods rarely include paired wildlife monitoring, despite tick ecology being tightly linked to their wildlife hosts68,69. The Urban Wildlife Institute has made great efforts to standardize wildlife monitoring across urbanization gradients through the establishment of the UWIN58, and there is potential for expanding such networks to center One Health goals70. By combining standardized methods of tick collection and wildlife monitoring across an urbanization gradient, the TWUSS allows for meaningful comparisons of tick and wildlife host population dynamics where active surveillance efforts have been limited22.
The TWUSS design is most suitable in urban areas where wildlife, ticks, and the pathogens they transmit are present, range expanding, or emerging64,70. A key limitation to note includes the dependence of partner permissions and the large effort required to maintain the transect. Here, we present the process for establishing a transdisciplinary collaboration to design, implement, and maintain a paired wildlife camera trapping and tick surveillance system.
Protocol
Permissions were acquired from the appropriate governing bodies for site access, placing wildlife cameras, and conducting tick collections at each site.
1. Initial transect gradient visualization and delineation
NOTE: While there are many ways to quantify urbanization71, structural components of impervious surface and housing density paired with forest cover are the most common metrics used in studies of urbanization and wildlife and/or ticks25,72,73.
- Use ArcGIS pro or any other preferred GIS software to visualize metrics of urbanization for the study region. Use percent impervious surface and housing density to categorize urbanization and percent tree canopy cover to visualize greenness and wildlife habitat quality74.
- Obtain the percent impervious surface raster file from the most current published National Landcover Database (NLCD)75. For housing density, use the U.S. Census data13 or Silvis Housing density dataset76. Obtain the percent tree canopy cover from the NLCD75.
- Store all datasets in a project folder on a local or server drive. Add each data layer to the project using the Add Data button on the Map tab. Select each data layer from the project folder and add it one at a time, repeating this process for all data layers.
- For the impervious surface raster, set the symbology to urban intensity 'bins' (categories) based on standardized categories77: high urban intensity (>80% impervious surfaces), medium urban intensity (50%-79% impervious surfaces), low urban intensity (20%-49% impervious surfaces), and open space (>20%). To apply this symbology, right-click the raster layer in the Contents pane, select Symbology, change Primary symbology to Classify, and define the classes according to the specified urban intensity categories.
- For the housing density shapefile layer, set symbology for standardized urban intensity categories of housing density as78: urban (>1,000 houses per km2), suburban (147.06-1,000 houses per km2), and exurban (6.18-147.05 houses per km2). To apply this symbology, right-click the layer in the Contents pane, select Symbology, change Primary symbology to Unique Values, and assign classes corresponding to the specified housing density categories.
- For the tree canopy cover layer, keep symbology as a continuous range of 0-100%.
- Identify where an urbanization gradient exists in the region for preliminary placement of a 4 km wide transect that includes each category of urbanization, as defined in step 1.1.3 and 1.1.4. (Figure 2).
NOTE: If there is no clear linear urbanization gradient for transect placement, the transect can be broken up into 5 km-long segments to form a nonlinear transect that still captures the different levels of urbanization and contains a minimum of four sites per segment. - Position the transect to satisfy the following conditions while still adequately capturing the gradient:
- Capture greenspaces of interest and make sure wildlife camera stations can be placed at least 1 km apart to be considered spatially independent for common urban meso-mammals and birds79,80 (Figure 2).
- Position the transect to cover greenspaces that are of interest to collaborators or high-quality spaces (>38% tree canopy cover81) that will maintain within-fragment heterogeneity in the green cover (i.e., a large, forested park in the most urban segments).
- Select the Measure button on the Map tab to help determine the transect position and distance.
NOTE: Ensure that there are more than the minimum four locations per segment to select from while determining the exact transect line, as some potential spaces may be or may become unusable for several reasons (e.g., no wildlife camera placement permission or unsuitable habitat upon ground truthing).
2. Potential greenspace selection: Identify potential greenspaces for wildlife camera placement and tick collections within the study area
- Identify every greenspace within the transect boundary by downloading the Protected Areas Database of the United States (PAD-US) shapefile and adding it to the map following step 1.1.2.82.
- Calculate the size (area) and percent of tree canopy cover within each greenspace from the tree canopy cover data layer.
- In the Analysis tab, select the Tools button to open the Geoprocessing pane.
- To calculate the size of each greenspace, use the Calculate Geometry Attributes tool. Select the greenspace layer as the Input Features, then create a new Field for size and select Area as the Property. Select the desired Area Unit and Coordinate System and hit Run for the tool to complete the action.
- To calculate the percent of tree canopy cover within each greenspace, use the Zonal Statistics tool. Select the greenspace layer as the Input Raster or Feature Zone Data, then select the name or unique ID of each greenspace as the Zone Field and the tree canopy cover layer as the Input Value Raster. Next, select Mean as the Statistics Type and hit Run for the tool to complete the action.
- For wildlife camera placement sites:
- Select city parks, golf courses, cemeteries, and natural preserves/areas for wildlife camera sites, as they often account for most greenspaces in metropolitan areas and are commonly used as wildlife camera sites for UWIN-related studies6.
- Set symbology for the percent tree canopy cover layer following step 1.1.3., classifying areas within each segment of the transect as densely forested (>38% tree canopy cover) or lightly forested habitat (<38% tree canopy cover)81 to account for variation in habitat quality across the wildlife camera locations in the transect83. Within each transect segment, identify two greenspaces with densely forested areas and two with lightly forested areas as potential wildlife camera placement sites (Figure 3).
- For tick collections, filter public-use parks, nature preserves, and gardens to include only greenspaces with a patch size of ≥5 hectares and ≥20% total tree canopy cover, ensuring that tick sampling methods can incorporate at least 800 m of forested trail habitat25,59,84.
NOTE: Avoid selecting golf courses for tick collection sites due to insecticide use61.
3. Site permission
- Identify contacts for each selected greenspace using internet search engines or partner networks to obtain site access and permission to place wildlife cameras and conduct tick collections.
- Create and distribute a one-page overview of the project to the identified contacts via email or phone. Deliverables outlined in this one-page overview could include access to photos through a Wildlife Insights project page85, annual wildlife camera reports, and resulting information about local tick populations. For parks and public natural areas used in the transect, acquire permits through the appropriate parks/municipal departments. Obtain written permission (i.e., email confirmation) for all privately owned spaces used in the transect without an official permitting process.
4. Wildlife camera and tick collection site selection
- For wildlife camera site selection, generate a random point inside each greenspace boundary to determine potential wildlife camera locations.
- Open the Geoprocessing pane and select the Create Random Points tool. Choose the greenspace layer as the Constraining Feature Class and select Run.
- For greenspaces large enough to include two wildlife camera placement stations, simultaneously generate two randomized points with a minimum separation of 1 km by selecting Minimum Allowed Distance as 1 km.
- Generate new random points if they do not fall within either lightly or densely forested habitat (Figure 3). These randomly generated points may be subject to minor changes during site visits, and there will likely be feedback on the placement of wildlife cameras depending on what landowners deem acceptable.
- For tick collection sites, select locations to drag ticks within a 500 m radius of the wildlife camera along three different transect types: 1) trail edge, 2) interior forest, and 3) forest-lawn edge25 (Figure 4). Ensure that eight 100 m complete transects can be dragged.
- Use satellite imagery or available trail maps for each greenspace to identify two potential 100 m transects of each transect type.
- Select an additional two transects in any habitat type to complete 800 m, ensuring that each drag is ≥10 m apart from each other.
- If no forest-lawn edge is present, select an additional 200 m as interior and trail transects.
- Calculate percent tree canopy cover, percent impervious surface, and housing density within a 2 km radius around each wildlife camera placement site across the transect.
- Add the coordinates of each camera trap placement to the ArcGIS project map using the Add Data button. In the Geoprocessing pane of ArcGIS pro, select the Pairwise Buffer tool. Select the camera trap points layer as the Input Features and set the Distance to 2 km. Click Run to create the buffer.
- Use the Zonal Statistics tool as described in step 2.2.3. to calculate the percent tree canopy cover, percent impervious surface, and housing density within the 2 km buffer around each camera trap.
- Verify that all levels of urbanization are represented and that the urbanization gradient is adequately captured by the placement of wildlife cameras and tick collection sites within each transect segment (Figure 5).
NOTE: Steps 5 and 6 involve necessary fieldwork, which can expose field team members to hazards and risks86. Field safety is integral to success. Follow established safety guidelines for planning safe and effective fieldwork86.
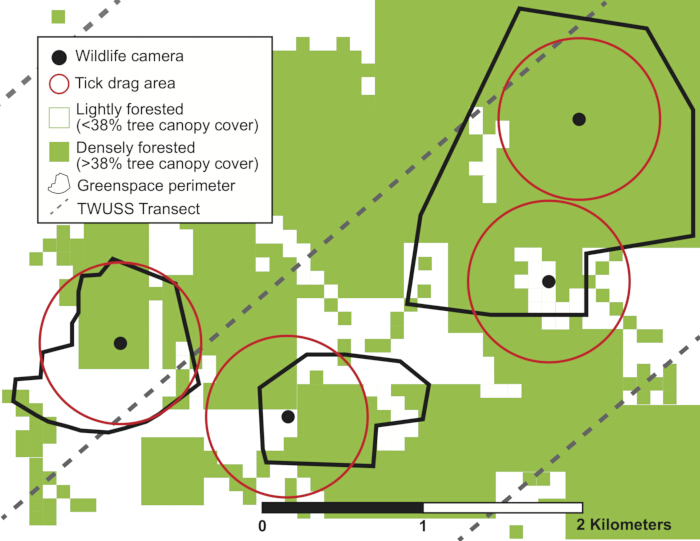
Figure 3. Example of a 5 km segment of the TWUSS transect. The figure shows the TWUSS transect (gray dashed line) with four wildlife camera sites (black circles) placed within greenspaces (black outlines) and the tick drag sampling area (red circles) around the wildlife cameras. The base layer depicts the reclassified tree cover layer as densely (green) or lightly (white) forested to represent local habitat quality. Please click here to view a larger version of this figure.
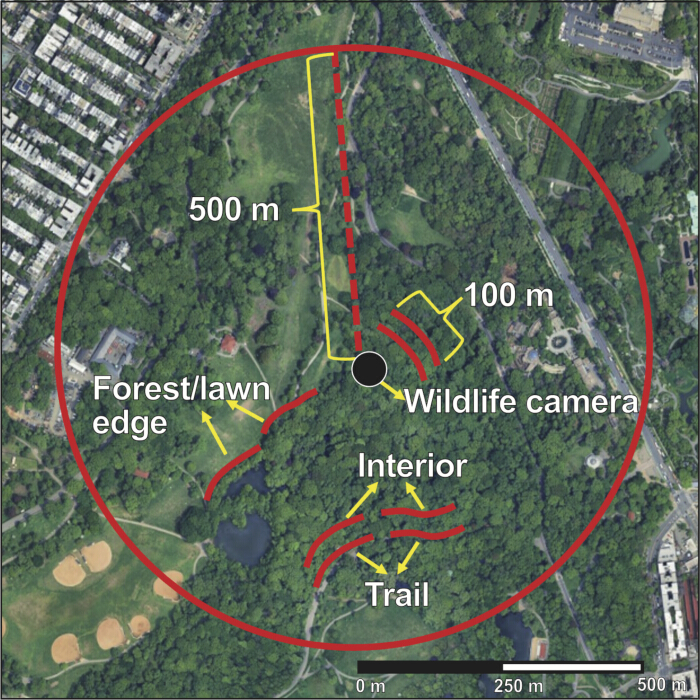
Figure 4. Example setup of a tick collection field site showing a paired wildlife camera and tick drag transects. The central black point represents the wildlife camera placement within a densely forested part of the greenspace; the red dashed line indicates a 500 m radius around the camera within which tick drags are conducted; the 100 m solid red lines represent each transect type, labeled as "Forest/lawn edge," "Interior," and "Trail." Google Earth satellite imagery is used as the basemap. Please click here to view a larger version of this figure.
5. Wildlife camera deployment
- Complete the following preparatory steps several weeks before a wildlife camera deployment:
- Take inventory of equipment and have enough wildlife cameras, memory cards, locks, and lock boxes on hand for each deployment.
- Prepare enough fresh batteries for each wildlife camera to have a complete change. Most wildlife camera models require 6-8 AA batteries.
- For each subsequent wildlife camera deployment, double-check that all data from the previous season has been downloaded from the memory cards and saved.
- Create a label with a brief project description and relevant contact information (e.g., a permanent project email address). Print the label and securely attach it to the top of each wildlife camera lock box using clear packing tape (See Supplementary File 1).
- Label each wildlife camera with a unique Camera ID number and label an SD card with the same ID, ideally linked to the site name.
- Set the date and time for each wildlife camera trap.
- Adjust the wildlife camera parameter settings as follows: multi-shot (3 photos), camera delay (30 s), time period for units to operate (24 h), image quality/ picture size (minimum 16 MP).
NOTE: See reference87 for additional details on recommended wildlife camera settings.
- During site visits, select suitable trees for wildlife camera placement within 50 m of the randomly generated point for that space.
- Place the wildlife camera at knee height (~50 cm) in a location not visible from trails and angle it away from human traffic (e.g., trails, walkways) to minimize human detections. Do not place cameras facing directly east or west to prevent sun glare.
- Remove large grass blades, leaves, or other objects that could interfere with the camera sensors (80 ft detection distance) during windy conditions. This also reduces false camera triggers.
- Check that the wildlife camera is aligned parallel to the ground.
- Deploy wildlife cameras for a duration of ≥28 days at each location during the months of January, April, July, and October to capture seasonal variation in wildlife habitat usage and occupancy58.
6. Tick collections via tick drag
NOTE: Sample each site 2-3 times between the end of May and the end of July to obtain replicates around the time of peak blacklegged tick nymphal questing period in the Northeast US (adjust time frame for other regions and/or tick species and life stages of interest), with a dragging distance total of 800 m during each site visit. The full 800 m need not be consecutive25,59.
- Complete the following steps at the beginning of the field season before beginning tick collections:
- Prepare all materials required for tick dragging.
- While wearing disposable laboratory gloves (i.e., latex or nitrile gloves), fill 2-3 1.5 mL vials per planned transect with a minimum volume of 500 µL of 85% EtOH or RNA/DNA Shield.
NOTE: Use 85% EtOH for preservation of ticks and bacterial pathogens, and use RNA/DNA Shield if RNA preservation is of interest (i.e., tick-borne viruses)88. Ensure proper storage of EtOH following institutional laboratory safety guidelines. - Print enough datasheets for each planned transect (see Supplementary File 2).
- Place all tick collection materials (forceps, permanent markers, prepared vials, clear plastic tape for abundant larva collection, writing utensil for keeping notes) into a fanny pack for use in the field. Prepare one fanny pack per field data collector.
- While wearing disposable laboratory gloves (i.e., latex or nitrile gloves), fill 2-3 1.5 mL vials per planned transect with a minimum volume of 500 µL of 85% EtOH or RNA/DNA Shield.
- Estimate each field data collector's step length by having the data collector walk a 10 m transect three times and calculating the average step length.
- Take the following precautions for personal safety during tick collection:
- Prepare light-colored long-sleeved clothing for use in the field (i.e., white coveralls) to enhance visibility of spotting ticks on personnel.
- At least 24 h prior to field tick collections, treat clothing and shoes with insecticide products containing 0.5% permethrin59 and allow to air dry. Follow product manufacturer guidelines for reapplication as needed.
NOTE: Avoid using insecticides on skin, as this may risk transfer of insecticides to the tick drag cloth and decrease tick activity89. - Prior to arriving at the field site, tuck pants into socks59.
- Throughout the tick collection protocol, check clothing and skin for ticks and remove any attached ticks immediately using forceps59.
- Prepare all materials required for tick dragging.
- Complete the following steps to conduct each tick drag:
- Allow for 30 min-1 h per 100 m transect, though the exact time required will depend on tick density89.
NOTE: Avoid sampling ticks when vegetation is wet, as this will dampen the drag cloth and impede tick attachment89. - Record the following on the datasheet: 1) the time of day, 2) weather conditions (temperature, wind, and relative humidity) using a weather meter, and 3) latitude/longitude coordinates at the start of the transect using a phone or other GPS device with a minimum 10 m accuracy.
- Spread the 1 m × 1 m white corduroy or flannel drag cloth across the ground, ensuring that the cloth is fully unfolded and that as much of its surface area as possible contacts the forest floor or lawn59.
- Slowly walk 10 m while dragging the cloth behind, then stop and inspect the cloth for ticks.89
- Carefully examine the cloth for ticks. Position the cloth in adequate light, systematically scan the cloth from left to right and top to bottom, and observe for movement.
NOTE: Drags should be conducted in 100 m transects and drag cloths checked at 10 m intervals to prevent ticks from crawling or falling off the cloth59. - Collect all ticks present with forceps and place them in the 1.5 mL preservation vials containing 85% EtOH or RNA/DNA Shield. Use a different vial for each 100 m transect, labeled with a unique transect number.
- If abundant larvae are present on the cloth, collect them using clear packing tape89.
- Record the number of ticks collected every 10 m interval along the 100 m transect on the datasheet, identifying species and life stage when possible.
- Record the major vegetation type (e.g., predominantly leaf litter, unmaintained herbaceous, or maintained grass) per 10 m segment (See Supplementary File 2).
- At the end of every 100 m transect, double-check each side of the cloth for ticks and record the end time and GPS coordinates before continuing to the next transect.
- Allow for 30 min-1 h per 100 m transect, though the exact time required will depend on tick density89.
7. Tick identification
- Use a dissecting microscope to identify the species and life stage of all collected ticks, following taxonomical keys for common ticks in the study90,91,92,93.
- Separate species and life stages of interest (e.g., I. scapularis nymphs) into new vials filled with 85% EtOH or RNA/DNA Shield and labeled with the associated transect number.
- Create a spreadsheet to enter tick identification information for each tick vial collected and processed.
- Link the tick identification spreadsheet with the field datasheet by transect ID.
8. Wildlife camera photo tagging and analysis
- Upload photos from each wildlife camera and seasonal deployment into a local or online database for photo tagging (e.g., Wildlife Insights or Zooniverse). Using a platform that automatically removes images of people can help avoid any privacy concerns.
- Ensure that the metadata for uploaded photos includes information about the site and collection period.
- Tag all photos by identifying the species of the animals using an online database built for wildlife camera trapping research (e.g., Wildlife Insights) or using any other software that retains photo metadata.
9. Transect maintenance and reporting outcomes
- Establish long-term transect management goals, participants, and leadership.
- Create and maintain a database (such as a shared drive folder) with documents containing pertinent site information, including wildlife camera placement coordinates, tick drag coordinates, site access information, land manager contacts, and processed data access information.
- Maintain a master spreadsheet connecting site information (i.e., urbanization metrics), number of ticks per species per life stage collected, and a list of unique wildlife species recorded at each site per season per project year.
- Create end-of-year reports tailored to each land manager and/or local participant, including wildlife camera and tick data summaries to keep participants engaged in the project.
Results
The transect line was situated to capture an urbanization gradient spanning three counties from New York City through Long Island, NY (Figure 2).
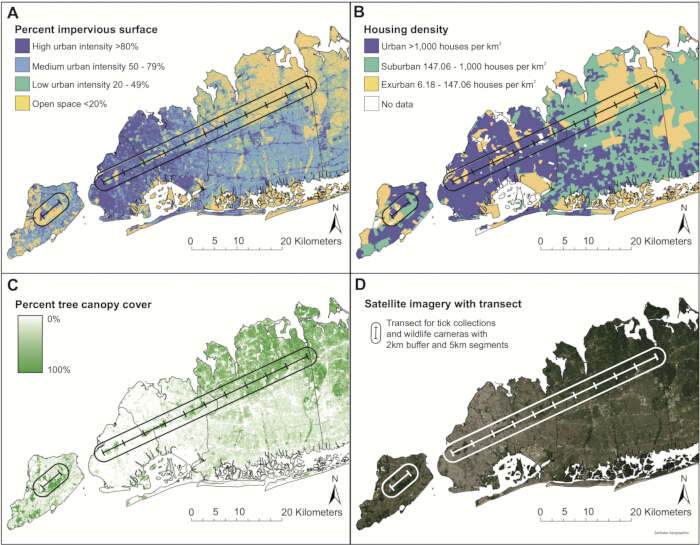
Figure 2. Maps of the transect over the urbanization gradient. (A) Urbanization intensity represented by NLCD percent impervious surface. (B) Housing density based on census block units. (C) Percent tree canopy cover derived from NLCD data. (D) Satellite imagery showing the transect used for tick collections and wildlife camera deployment. Please click here to view a larger version of this figure.
All wildlife camera and tick collection sites for the NYC transect (n = 44 and n = 38, respectively) were placed in public parks (n = 21, n = 23), golf courses (n = 6, n = 0), cemeteries (n = 5, n = 3), nature preserves (n = 9, n = 9), and public gardens (n = 3, n = 3) (Table 1).
| Greenspace type | Number of camera trap sites | Number of tick collection sites |
| Public park | 21 | 23 |
| Nature preserve | 9 | 9 |
| Public garden | 3 | 3 |
| Cemetery | 5 | 3 |
| Golf Course | 6 | 0 |
| Total sites | 44 | 38 |
Table 1: Summary of the number of wildlife camera and tick collection sites by greenspace type.
The calculation of percent tree canopy cover, percent impervious surface, and housing density within a 2 km radius of each wildlife camera placement site showed that the wildlife camera placement within each transect segment effectively captured the mean and spread (four sites) in urban metrics along the urbanization gradient from NYC through Long Island, NY (Figure 5). Since two densely forested sites and two lightly forested sites were selected in each transect segment, variation in percent tree canopy cover within 100 m of each wildlife camera showed that local habitat quality around each wildlife camera did not differ greatly (low R2) across the urbanization gradient (Figure 5D).
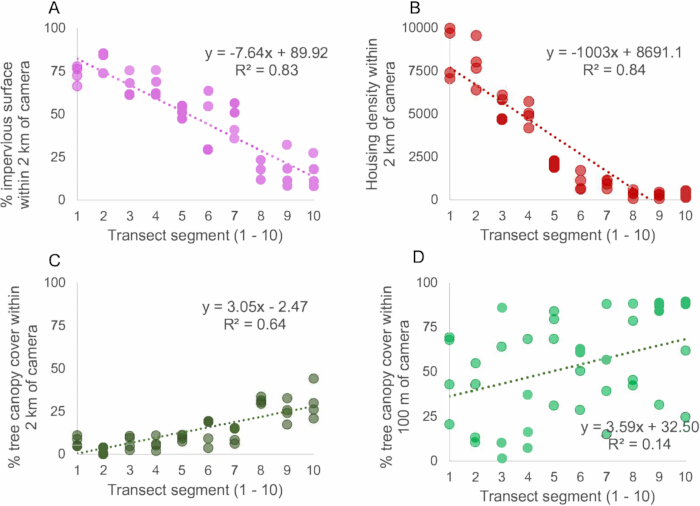
Figure 5. Environmental characteristics around wildlife cameras across the transect. Four wildlife cameras are placed within each 5 km transect segment (1-10) from West to East, and the (A) percent impervious surface cover, (B) housing density, and (C) tree canopy cover are shown within a 2 km radius of each wildlife camera trap. (D) The tree canopy cover within a 100 m radius of the wildlife camera placement represents the diversity of the microhabitat quality within the greenspaces chosen. Please click here to view a larger version of this figure.
Since the initiation of the TWUSS system in spring 2022 through summer 2023, field data collection resulted in 4,928 wildlife camera trapping days and collection of 3,421 nymphal blacklegged ticks, 575 nymphal lone star ticks, and 329 nymphal longhorned ticks across all sites (Table 2).
| Nymphal tick species | Total number collected |
| Amblyomma americanum (Lone star) | 575 |
| Haemaphysalis longicornis (Long horned) | 329 |
| Ixodes scapularis (Blacklegged) | 3421 |
| All nymphal ticks | 4325 |
Table 2: Summary of nymphal tick collections by species across all 38 sites and two sampling years (2022-2023).
From the wildlife camera photos, 34 unique species were identified across all cameras (see Supplementary File 3 for full species list), including 16 mammalian species and 16 bird species (Figure 6). Wildlife cameras were configured to target meso-mammalian activity, and the following seven meso-mammal species were observed: Eastern coyote (Canis latrans var.), red fox (Vulpes vulpes), raccoon (Procyon lotor), Virginia opossum (Didelphis virginiana), striped skunk (Mephitis mephitis), white-tailed deer (Odocoileus virginianus), and groundhog (Marmota monax).
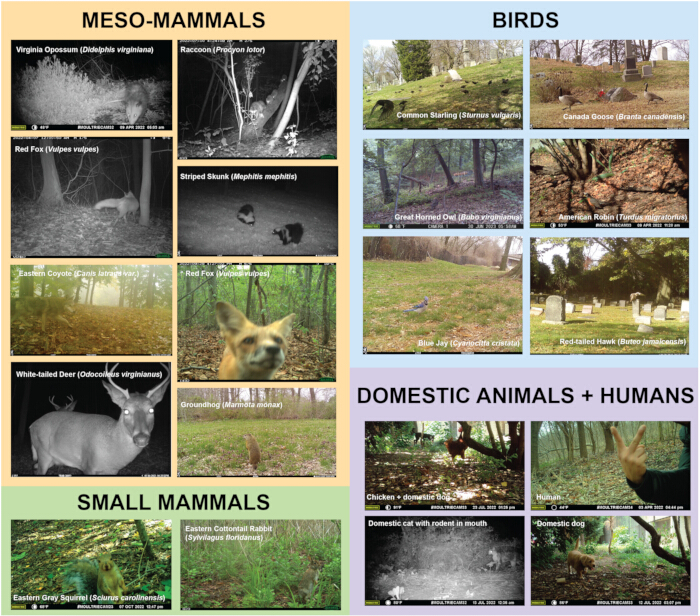
Figure 6. A collection of representative images captured across the transect, including meso-mammals, small mammals, birds, domestic animals, and humans. Please click here to view a larger version of this figure.
Through implementation of the TWUSS protocol, the first coupled urban tick-hazard and wildlife monitoring transect has been established across an urbanization gradient. A previously published study derived from this surveillance system linked the urbanization metrics across the gradient, keystone tick host (white-tailed deer) data from the wildlife cameras, and tick collection data to identify cascading effects of urbanization on wildlife host occupancy and tick hazard intensity25. This study found that increased greenspace connectivity, increased tree canopy cover, and decreased impervious surface hierarchically increased the probability of white-tailed deer occupancy, which significantly predicted the abundance of nymphal I. scapularis ticks within each greenspace (Figure 7, Table 3)25.
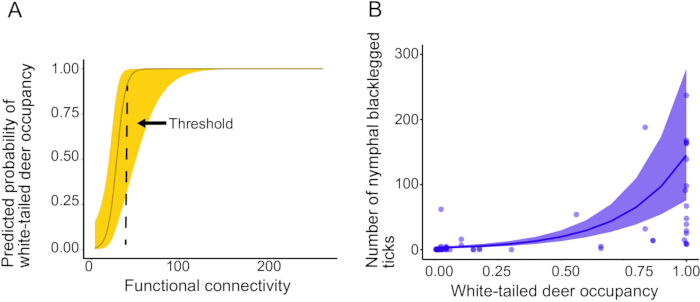
Figure 7. Representative model plot results from the paired wildlife camera and tick collection transect design. (A) Functional connectivity as the strongest predictor of white-tailed deer occupancy probability. (B) Number of nymphal blacklegged ticks as a significant function of white-tailed deer occupancy. For plot A, the occupancy model was generated using photos of white-tailed deer from wildlife cameras set in 2022-2023. For plot B, points indicate field-collected numbers of ticks in 2022-2023 per 1600 m2 of sampling, and the regression line and standard error represent the negative binomial model prediction. The y-axis is limited to <300 ticks for visualization. Figure adapted and reproduced with permission from Lilly et al. 202525 Please click here to view a larger version of this figure.
| Model type | Response variable | Model component | Estimate | SE | z | P( >|z|) | ||||
| Single-season occupancy model | Deer occupancy | (Intercept) | 3.04 | 1.79 | 1.7 | 0.09 | ||||
| Functional connectivity | 11.09 | 4.08 | 2.72 | < 0.01 | ||||||
| Single-season occupancy model | Deer occupancy | (Intercept) | −1.53 | 1.04 | −1.48 | 0.14 | ||||
| Percent tree Canopy Cover | 6.15 | 2.27 | 2.7 | < 0.01 | ||||||
| Single-season occupancy model | Deer occupancy | (Intercept) | −1.26 | 0.91 | −1.39 | 0.16 | ||||
| Percent impervious surface | −5.85 | 2.24 | −2.62 | < 0.01 | ||||||
| Negative binomial generalized linear mixed effect model. Site and year were included as random effects. | Nymphal blacklegged tick abundance | (Intercept) | −9.04 | 0.81 | −11.17 | < 0.001 | ||||
| Deer occupancy | 4.43 | 0.57 | 7.79 | < 0.001 | ||||||
| Within greenspace percent tree canopy cover | 0.03 | 0.01 | 2.33 | 0.02 | ||||||
Table 3: Representative model output results from the paired wildlife camera and tick collection transect design. Occupancy model results showing top predictors of deer occupancy; negative binomial generalized linear mixed effects model results showing nymphal blacklegged tick abundance as a function of both deer occupancy and percent tree canopy cover within the greenspace. Table adapted and reproduced with permission from Lilly et al. 202525
Supplementary File 1. Example wildlife camera lock box label. Please click here to download this File.
Supplementary File 2. Example tick collection datasheet. Please click here to download this File.
Supplementary File 3. List of 34 unique species captured by the NYC Wildlife Transect wildlife cameras and identified visually by researchers. Please click here to download this File.
Discussion
Through the initiation of TWUSS, this protocol demonstrates how to design a paired tick and wildlife monitoring transect that captures an urbanization gradient. Representative results from this system have allowed for the identification of landscape scale and wildlife host drivers of tick hazard in urban areas25. Key tick host data from the paired wildlife camera design has also been used to identify areas within New York City that may be newly at an elevated risk25. This highlights the importance of continued monitoring of ticks and wildlife across cities as urbanization increases globally, emphasizing the need for standard surveillance design and methodologies70. Replication of the TWUSS across cities where tick-borne hazards are emerging would allow for a large-scale comparison of urban landscape metrics driving the distribution of ticks and wildlife hosts25,70.
The TWUSS transect spans across a variety of greenspace types, management practices, and land stewardship jurisdictions, with 20 different land management groups requiring wildlife camera placement and tick collection permissions. Thus, the TWUSS relies on the participation of diverse collaborators, and evidence suggests that local participant engagement can improve the long-term success of tick surveillance systems94,95 and wildlife and biodiversity conservation efforts, including in urban contexts96,97,98,99. Collaboration with the municipal parks and health departments has contributed to increased signage within greenspaces where blacklegged ticks were collected and targeted vector surveillance by the municipal health department where tick-borne hazards were newly identified.
With the extensive amount of data collected comes the large task of data processing, tick identification, and the identification of wildlife species photographed. Maintaining an organized shared project database (step 9.2) containing all project information and data has been key to the success of the TWUSS since project management responsibilities have changed hands over the course of its establishment. Additionally, tick classification and photographic data can be an effective way for junior researchers and volunteers to engage with the project and increase interest in both the wildlife species and tick hazards inhabiting their local greenspaces. Through the TWUSS, educational opportunities for students have been integrated into the project through participation in transect data processing. In the two years since the initiation of TWUSS, over 30 junior researchers (undergraduate and master's level students) have contributed to image classification and tick identification, and for many of them, this was their first research experience. In addition to creating opportunities for university students, several community engagement efforts have been conducted with the New York Academy of Sciences and the Girl Scouts. Through these outreach activities, active researchers involved in the transect are paired with community organizations to facilitate hands-on learning and excitement about local ticks and urban wildlife. Through these projects, youth volunteers have learned how to place wildlife cameras, collect data, and summarize observations.
In the future, there is a potential for additional NYC transects. As the TWUSS continues to grow, the sheer volume of image data collected through each wildlife camera can limit research progress due to the slow process of image classification100. Recent advances in technology, including the incorporation of machine learning algorithms to process wildlife camera data, can help reduce this time lag101. The TWUSS utilizes an online platform (step 8.1) that employs machine learning models for initial image classification and has streamlined management, analysis, and sharing of wildlife camera trap data from the TWUSS.
In addition to these positive outcomes, the TWUSS has dealt with challenges of urban fieldwork, such as vandalism or theft of wildlife cameras. In the first two years of data collection (April 2022-January 2024), four wildlife cameras were stolen, and three were damaged (i.e., fully or partly smashed), leading to a wildlife camera replacement rate of 2% per deployment, which is consistent with other urban wildlife studies58. Tailoring the wildlife camera lock box label (step 5.1.4) and carefully ensuring that wildlife cameras were placed (step 5.2.1) away from heavy human activity and trails were key steps for reducing theft and vandalism. Additional troubleshooting may be required in the future by moving the wildlife camera to a new placement tree or retiring a site if theft and vandalism become unmanageable.
Wildlife cameras such as those employed in the TWUSS are often optimized to capture medium and large mammals55, leaving a gap in surveillance of the small mammal and avian community. Small mammals are the dominant reservoir hosts for many tick-borne pathogens23 and therefore adding targeted live-trapping at a subset of sites across the urbanization gradient would allow for more comprehensive surveillance of the tick host and pathogen community. Similarly, while numerous bird species were detected in the captured images, wildlife cameras are unable to accurately monitor bird diversity, some of which are reservoir hosts for ticks102. Thus, it is also suggested to add avian point counts, mist netting, or passive audio surveillance.
In conclusion, the experience of designing and implementing the TWUSS highlights some of the challenges, opportunities, and best practices for developing a paired tick and wildlife urban ecology research project with a diverse group of city-wide participants. Each wildlife camera placed and tick collected in the TWUSS transect is the result of a relationship built and maintained between researchers and local parks department personnel, township leaders, nature preserve land managers, golf course groundskeepers, cemetery staff, and many other individuals with varying investment and interest in tick-borne hazards and urban wildlife. Building successful collaborative research relationships and participant engagement takes time and effort, which must be incorporated in the research design and implementation of urban ecology projects within cities96,103,104,105. As cities across the globe expand, collaborative projects like the TWUSS can help people respond to emerging zoonotic hazards while coexisting with wildlife in urban environments.
Disclosures
The authors do not have any conflicts of interest to declare.
Acknowledgements
This work was supported by the National Science Foundation Graduate Research Fellowship (grant #10328000) and by the National Science Foundation's Coupled Natural Human Systems 2/Dynamics of Integrated Socio-Environmental Systems (CNH2/DISES) program (Award #1924061). Funding was also provided by the Centers for Disease Control and Prevention in support of the Northeast Regional Center for Excellence in Vector-Borne Diseases: Teaching & Evaluation Center (NEVBD-TEC) (Award #NU50CK000633). Its contents are solely the responsibility of the authors and do not necessarily represent the official views of the Centers for Disease Control and Prevention, the Department of Health and Human Services, or the National Science Foundation.
We would also like to acknowledge the support provided by the Urban Wildlife Information Network, with special thanks to Dr. Seth Magle, Dr. Mason Fidino, and Kimberly Rivera in setting up our wildlife camera trapping transect. We thank the Eco-Epidemiology lab members and Columbia and Barnard College students who have assisted with advice, setup, fieldwork, tick identification, and/or photo tagging, including Dr. Meredith VanAcker, Dr. Nichar Gregory, Sung-Joo Lee, Alexis Angulo, Hanna Chen, Molly Durawa, Rebecca Garcia, Aidyn Levin, Jake Miller, Safa Muhammad, Devorah Gordin, and Adara Anisman. We additionally thank City of New York Parks & Recreation, Nassau County, Town of North Hempstead, North Shore Land Alliance, New York State DEC, New York State Parks, the Green-Wood Cemetery, the Evergreens Cemetery, Maple Grove Cemetery, Old Westbury Gardens, SUNY Old Westbury, and the ecologically inclined golf course managers for access to conduct research in their greenspaces. This research was conducted on Native lands of the Lenape, Matinecock, Merrick, Nissaquogue, and Massapequas.
Materials
| Name | Company | Catalog Number | Comments |
|---|---|---|---|
| 1x1 m white corduroy or flannel drag cloth | Ecoloogy Supplies | 0015T | Can purchase pre-made or construct following directions outlined by the CDC 2020 or Salomon et al. 2020. |
| 32+ GB SD memory card | SanDisk | SDSDXXO-032G-GN4IN | For photo storage |
| Batteries (most cameras require AA) | Duracell | MN1500B20 | For powering cameras |
| Camera adjustable locking cable | Moultrie (Python brand) | MCA-21667 | For securing cameras |
| Camera security box | Browning | BTC-SB-SM | For securing cameras |
| Camera trap mounting strap | Moultrie | MCA-12667 | For placing cameras |
| Clear plastic packing tape | NA | NA | For labeling widlife camera lock boxes and for collection of large amount of larva. Any brand works. |
| Dissecting microscope | AmScope | SM-1BSX-64S | For identifying ticks |
| DNA/RNA Sheild | Zymo research | R1100-250 | For tick storage |
| Eppendorf Safe-Lock Tubes 1.5 mL - Microtube | Fisher scientific | 05-402-94 | 1.5 ml vials for tick storage |
| Ethanol 200 proof | Thermo scientific | T038181000 | For tick storage |
| Fanny pack | NA | NA | For holding / organizing tick collection materials while in the field. Any brand works. |
| Fine tipped permanent markers | Staedtler | 55580-PK10 | For labeling tick tubes |
| Forceps | Fisher scientific | 12-000-121 | For collecting ticks off the cloth and identifying under a microscope |
| GIS Software | NA | NA | ArcGIS, QGIS, or R could be used depending on user preference |
| Kestrel 3000 Weather Meter | Kestrel Meters | 830 | For measuring climate / weather conditions |
| Motion-triggered camera trap (Browning strike force pro recommended) | Browning | BTC-5PX-1080 | For photographing wildlife |
| Writing utensil (pen or pencil) | NA | NA | For filling out datasheets. Any brand works. |
References
- Seto, K. C., Güneralp, B., Hutyra, L. R. Global forecasts of urban expansion to 2030 and direct impacts on biodiversity and carbon pools. Proc Natl Acad Sci. 109 (40), 16083-16088 (2012).
- Rastandeh, A., Jarchow, M. Urbanization and biodiversity loss in the post-COVID-19 era: complex challenges and possible solutions. Cities Health. 5 (sup1), S37-S40 (2021).
- Venter, O., Sanderson, E. W., Magrach, A., Allan, J. R., Beher, J., et al. Sixteen years of change in the global terrestrial human footprint and implications for biodiversity conservation. Nat Commun. 7 (1), 12558 (2016).
- Egerer, M., Buchholz, S. Reframing urban "wildlife" to promote inclusive conservation science and practice. Biodivers Conserv. 30 (7), 2255-2266 (2021).
- Lerman, S. B., Narango, D. L., Andrade, R., Warren, P. S., Grade, A. M., et al. Wildlife in the city: human drivers and human consequences. Urban Ecol Its Nat Chall. , 37-66 (2020).
- Gallo, T., Fidino, M., Lehrer, E. W., Magle, S. B. Mammal diversity and metacommunity dynamics in urban green spaces: implications for urban wildlife conservation. Ecol Appl. 27 (8), 2330-2341 (2017).
- Ives, C. D., Lentini, P. E., Threlfall, C. G., Ikin, K., Shanahan, D. F., et al. Cities are hotspots for threatened species. Glob Ecol Biogeogr. 25 (1), 117-126 (2016).
- Soulsbury, C. D., White, P. C. L. Human-wildlife interactions in urban areas: a review of conflicts, benefits and opportunities. Wildl Res. 42 (7), 541-553 (2015).
- Ellwanger, J. H., Byrne, L. B., Chies, J. A. B. Examining the paradox of urban disease ecology by linking the perspectives of Urban One Health and Ecology with Cities. Urban Ecosyst. 25 (6), 1735-1744 (2022).
- Magle, S. B., Hunt, V. M., Vernon, M., Crooks, K. R. Urban wildlife research: Past, present, and future. Biol Conserv. 155, 23-32 (2012).
- Combs, M. A., Kache, P. A., VanAcker, M. C., Gregory, N., Plimpton, L. D., et al. Socio-ecological drivers of multiple zoonotic hazards in highly urbanized cities. Glob Change Biol. 28 (5), 1705-1724 (2022).
- König, H. J., Kiffner, C., Kramer-Schadt, S., Fürst, C., Keuling, O., et al. Human-wildlife coexistence in a changing world. Conserv Biol. 34 (4), 786-794 (2020).
- . 2020 Population Distribution in the United States and Puerto Rico Available from: https://www.census.gov/library/visualizations/2021/geo/population-distribution-2020.html (2021)
- Kugeler, K. J., Schwartz, A. M., Delorey, M. J., Mead, P. S., Hinckley, A. F. Estimating the Frequency of Lyme Disease Diagnoses, United States, 2010-2018. Emerg Infect Dis. 27 (2), 616-619 (2021).
- Diuk-Wasser, M. A., VanAcker, M. C., Fernandez, M. P., Reisen, W. Impact of Land Use Changes and Habitat Fragmentation on the Eco-epidemiology of Tick-Borne Diseases. J Med Entomol. 58 (4), 1546-1564 (2021).
- Piedmonte, N. P., Shaw, S. B., Prusinski, M. A., Fierke, M. K. Landscape Features Associated With Blacklegged Tick (Acari: Ixodidae) Density and Tick-Borne Pathogen Prevalence at Multiple Spatial Scales in Central New York State. J Med Entomol. 55 (6), 1496-1508 (2018).
- Tufts, D. M., Goodman, L. B., Benedict, M. C., Davis, A. D., VanAcker, M. C., et al. Association of the invasive Haemaphysalis longicornis tick with vertebrate hosts, other native tick vectors, and tick-borne pathogens in New York City, USA. Int J Parasitol. 51 (2), 149-157 (2021).
- Rochlin, I., Benach, J. L., Furie, M. B., Thanassi, D. G., Kim, H. K. Rapid invasion and expansion of the Asian longhorned tick (Haemaphysalis longicornis) into a new area on Long Island, New York, USA. Ticks Tick-Borne Dis. 14 (2), 102088 (2023).
- Young, I., Prematunge, C., Pussegoda, K., Corrin, T., Waddell, L. Tick exposures and alpha-gal syndrome: A systematic review of the evidence. Ticks Tick-Borne Dis. 12 (3), 101674 (2021).
- Childs, J. E., Paddock, C. D. THE ASCENDANCY OFAMBLYOMMA AMERICANUMAS A VECTOR OF PATHOGENS AFFECTING HUMANS IN THE UNITED STATES*. Annu Rev Entomol. 48, 307-337 (2003).
- Raghavan, R. K., Peterson, A. T., Cobos, M. E., Ganta, R., Foley, D. Current and Future Distribution of the Lone Star Tick, Amblyomma americanum (L.) (Acari: Ixodidae) in North America. PLOS ONE. 14 (1), e0209082 (2019).
- Diuk-Wasser, M. A., Fernandez, P., Vanwambeke, S. O. Tick-Borne Diseases in Urban and Periurban Areas: A Blind Spot in Research and Public Health. Annu Rev Entomol. , (2025).
- Kilpatrick, A. M., Dobson, A. D. M., Levi, T., Salkeld, D. J., Swei, A., et al. Lyme disease ecology in a changing world: consensus, uncertainty and critical gaps for improving control. Philos Trans R Soc Lond B Biol Sci. 372 (1722), 20160117 (2017).
- Yuan, Q., Llanos-Soto, S. G., Gangloff-Kaufmann, J. L., Lampman, J. M., Frye, M. J., et al. Active surveillance of pathogens from ticks collected in New York State suburban parks and schoolyards. Zoonoses Public Health. 67 (6), 684-696 (2020).
- Lilly, M. V., Davis, M., Kross, S. M., Konowal, C. R., Gullery, R., et al. Functional connectivity for white-tailed deer drives the distribution of tick-borne pathogens in a highly urbanized setting. Landsc Ecol. 40 (5), 87 (2025).
- Tan, Q., Zhang, C., Xia, J., Wang, R., Zhou, L., et al. Information-guided adaptive learning approach for active surveillance of infectious diseases. Infect Dis Model. 10 (1), 257-267 (2024).
- . A Stronger, More Resilient New York Available from: https://www.nyc.gov/site/sirr/report/report.page (2013)
- Seewagen, C. L., Slayton, E. J. Mass Changes Of Migratory Landbirds During Stopovers In A New York City Park. Wilson J Ornithol. 120 (2), 296-303 (2008).
- Stark, J. R., Aiello-Lammens, M., Grigione, M. M. The effects of urbanization on carnivores in the New York metropolitan area. Urban Ecosyst. 23 (2), 215-225 (2020).
- Seewagen, C. L., Slayton, E. J., Guglielmo, C. G. Passerine migrant stopover duration and spatial behaviour at an urban stopover site. Acta Oecologica. 36 (5), 484-492 (2010).
- Rivel, D., Rosenheim, K. . Birdwatching in New York City and on Long Island. , 338 (2016).
- Nagy, C., Weckel, M., Monzón, J., Duncan, N., Rosenthal, M. R. Initial colonization of Long Island, New York by the eastern coyote, Canis latrans (Carnivora, Canidae), including first record of breeding. Check List. 13 (6), 901-907 (2017).
- Bradfield, A. A., Nagy, C. M., Weckel, M., Lahti, D. C., Habig, B. Predictors of Mammalian Diversity in the New York Metropolitan Area. Front Ecol Evol. 10, (2022).
- VanAcker, M. C., DeNicola, V. L., DeNicola, A. J., Aucoin, S. G., Simon, R., et al. Resource selection by New York City deer reveals the effective interface between wildlife, zoonotic hazards and humans. Ecol Lett. 26 (12), 2029-2042 (2023).
- Elmqvist, T., Fragkias, M., Goodness, J., Güneralp, B., Marcotullio, P. J., et al. . Urbanization, Biodiversity and Ecosystem Services: Challenges and Opportunities. , (2013).
- Aronson, M. F., Lepczyk, C. A., Evans, K. L., Goddard, M. A., Lerman, S. B., et al. Biodiversity in the city: key challenges for urban green space management. Front Ecol Environ. 15 (4), 189-196 (2017).
- Harrison, P. A., Berry, P. M., Simpson, G., Haslett, J. R., Blicharska, M., et al. Linkages between biodiversity attributes and ecosystem services: A systematic review. Ecosyst Serv. 9, 191-203 (2014).
- Vuorisalo, T., Lahtinen, R., Laaksonen, H. Urban biodiversity in local newspapers: a historical perspective. Biodivers Conserv. 10 (10), 1739-1756 (2001).
- Sokolow, S. H., Nova, N., Pepin, K. M., Peel, A. J., Pulliam, J. R. C., et al. Ecological interventions to prevent and manage zoonotic pathogen spillover. Philos Trans R Soc B Biol Sci. 374 (1782), 20180342 (2019).
- Lesmeister, D. B., Nielsen, C. K., Schauber, E. M., Hellgren, E. C. Spatial and temporal structure of a mesocarnivore guild in midwestern north America. Wildl Monogr. 191 (1), 1-61 (2015).
- Santini, L., González-Suárez, M., Russo, D., Gonzalez-Voyer, A., von Hardenberg, A., et al. One strategy does not fit all: determinants of urban adaptation in mammals. Ecol Lett. 22 (2), 365-376 (2019).
- Pither, R., O'Brien, P., Brennan, A., Hirsh-Pearson, K., Bowman, J. Predicting areas important for ecological connectivity throughout Canada. PLOS ONE. 18 (2), e0281980 (2023).
- VanAcker, M. C., Little, E. A. H., Molaei, G., Bajwa, W. I., Diuk-Wasser, M. A. Enhancement of Risk for Lyme Disease by Landscape Connectivity, New York, New York, USA. Emerg Infect Dis. 25 (6), 1136-1143 (2019).
- The City of New York Department of Health and Mental Hygiene. . 2025 Comprehensive Mosquito Surveillance and Control Plan. , (2025).
- Bajwa, W., Kennedy, A., Vincent, Z., Heck, G., Riaj, S., et al. Five human pathogens detected by tick surveillance in New York City parks, 2014-2015. J Med Entomol. , tjae014 (2024).
- Bajwa, W., Kennedy, A., Vincent, Z., Heck, G., Riaj, S., et al. Earliest records of the Asian longhorned tick (Acari: Ixodidae) in Staten Island, New York, and subsequent population establishment, with a review of its potential medical and veterinary importance in the United States. J Med Entomol. , tjae019 (2024).
- . Tick Surveillance Program Available from: https://www.suffolkcountyny.gov/Departments/Health-Services/Public-Health/Preventive-Services/Arthropod-borne-Diseases/Tick-Surveillance-Program (2025)
- . Tick Information Available from: https://www.nassauswcd.org/Tick-Information (2025)
- Bastard, J., Gregory, N., Fernandez, P., Mincone, M., Card, O., et al. Cascading effects of mammal host community composition on tick vector occurrence at the urban human-wildlife interface. Ecosphere. 15 (8), e4957 (2024).
- Munshi-South, J., Nagy, C. Urban park characteristics, genetic variation, and historical demography of white-footed mouse (Peromyscus leucopus) populations in New York City. PeerJ. 2, e310 (2014).
- Henger, C. S., Herrera, G. A., Nagy, C. M., Weckel, M. E., Gormezano, L. J., et al. Genetic diversity and relatedness of a recently established population of eastern coyotes (Canis latrans) in New York City. Urban Ecosyst. 23 (2), 319-330 (2020).
- McKinney, M. L. Urbanization, Biodiversity, and Conservation: The impacts of urbanization on native species are poorly studied, but educating a highly urbanized human population about these impacts can greatly improve species conservation in all ecosystems. BioScience. 52 (10), 883-890 (2002).
- Bradley, C. A., Altizer, S. Urbanization and the ecology of wildlife diseases. Trends Ecol Evol. 22 (2), 95-102 (2007).
- Gallo, T., Fidino, M., Gerber, B., Ahlers, A. A., Angstmann, J. L., et al. Mammals adjust diel activity across gradients of urbanization. eLife. 11, e74756 (2022).
- Burton, A. C., Neilson, E., Moreira, D., Ladle, A., Steenweg, R., et al. REVIEW: Wildlife camera trapping: a review and recommendations for linking surveys to ecological processes. J Appl Ecol. 52 (3), 675-685 (2015).
- Vélez, J., McShea, W., Shamon, H., Castiblanco-Camacho, P. J., Tabak, M. A., et al. An evaluation of platforms for processing camera-trap data using artificial intelligence. Methods Ecol Evol. 14 (2), 459-477 (2023).
- Schneider, S., Taylor, G. W., Linquist, S., Kremer, S. C. Past, present and future approaches using computer vision for animal re-identification from camera trap data. Methods Ecol Evol. 10 (4), 461-470 (2019).
- Magle, S. B., Fidino, M., Lehrer, E. W., Gallo, T., Mulligan, M. P., et al. Advancing urban wildlife research through a multi-city collaboration. Front Ecol Environ. 17 (4), 232-239 (2019).
- Diuk-Wasser, M. A., Hoen, A. G., Cislo, P., Brinkerhoff, R., Hamer, S. A., et al. Human Risk of Infection with Borrelia burgdorferi, the Lyme Disease Agent, in Eastern United States. Am J Trop Med Hyg. 86 (2), 320-327 (2012).
- Bekken, M. A. H., Soldat, D. J., Koch, P. L., Schimenti, C. S., Rossi, F. S., et al. Analyzing golf course pesticide risk across the US and Europe-The importance of regulatory environment. Sci Total Environ. 874, 162498 (2023).
- Clow, K. M., Leighton, P. A., Pearl, D. L., Jardine, C. M. A framework for adaptive surveillance of emerging tick-borne zoonoses. One Health. 7, 100083 (2019).
- Eisen, R. J., Paddock, C. D. Tick and Tickborne Pathogen Surveillance as a Public Health Tool in the United States. J Med Entomol. 58 (4), 1490-1502 (2020).
- Petersen, L. R., Beard, C. B., Visser, S. N. Combatting the Increasing Threat of Vector-Borne Disease in the United States with a National Vector-Borne Disease Prevention and Control System. Am J Trop Med Hyg. 100 (2), 242-245 (2019).
- Mader, E. M., Ganser, C., Geiger, A., Harrington, L. C., Foley, J., et al. A Survey of Tick Surveillance and Control Practices in the United States. J Med Entomol. 58 (4), 1503-1512 (2021).
- Kopsco, H. L., Xu, G., Luo, C. Y., Rich, S. M., Mather, T. N. Crowdsourced Photographs as an Effective Method for Large-Scale Passive Tick Surveillance. J Med Entomol. 57 (6), 1955-1963 (2020).
- Švec, P., Hönig, V., Zubriková, D., Wittmann, M., Pfister, K., et al. The use of multi-criteria evaluation for the selection of study plots for monitoring of I. ricinus. ticks - Example from Central Europe. Ticks Tick-Borne Dis. 10 (4), 905-910 (2019).
- Wisely, S. M., Glass, G. E. Advancing the Science of Tick and Tick-Borne Disease Surveillance in the United States. Insects. 10 (10), 361 (2019).
- Thompson, A. T., White, S. A., Doub, E. E., Sharma, P., Frierson, K., et al. The wild life of ticks: Using passive surveillance to determine the distribution and wildlife host range of ticks and the exotic Haemaphysalis longicornis, 2010-2021. Parasit Vectors. 15 (1), 331 (2022).
- Murray, M. H., Surasinghe, T., Gelmi-Candusso, T., Sander, H. A., Lilly, M., et al. Multicity research networks are needed to address global One Health challenges. BioScience. , biaf106 (2025).
- Seress, G., Lipovits, &. #. 1. 9. 3. ;., Bókony, V., Czúni, L. Quantifying the urban gradient: A practical method for broad measurements. Landsc Urban Plan. 131, 42-50 (2014).
- Moll, R. J., Cepek, J. D., Lorch, P. D., Dennis, P. M., Tans, E., et al. What does urbanization actually mean? A framework for urban metrics in wildlife research. J Appl Ecol. 56 (5), 1289-1300 (2019).
- Gandy, S. L., Hall, J. L., Plahe, G., Watkinson, K., Johnson, D., et al. The dependence of urban tick and Lyme disease hazards on the hinterlands. Nat Cities. 2 (10), 948-957 (2025).
- Magle, S. B., Lehrer, E. W., Fidino, M. Urban mesopredator distribution: examining the relative effects of landscape and socioeconomic factors. Anim Conserv. 19 (2), 163-175 (2016).
- Dewitz, J. . National Land Cover Database (NLCD) 2021 Products. , (2023).
- Hammer, R. B., Stewart, S. I., Winkler, R. L., Radeloff, V. C., Voss, P. R. Characterizing dynamic spatial and temporal residential density patterns from 1940-1990 across the North Central United States. Landsc Urban Plan. 69 (2), 183-199 (2004).
- Homer, C., Dewitz, J., Jin, S., Xian, G., Costello, C., et al. Conterminous United States land cover change patterns 2001-2016 from the 2016 National Land Cover Database. ISPRS J Photogramm Remote Sens. 162, 184-199 (2020).
- Theobald, D. M. Landscape Patterns of Exurban Growth in the USA from 1980 to 2020. Ecol Soc. 10, 1 (2005).
- Stanley, D., Gehrt, P. D., Seth, P. D., Riley, P. D., Brian, L., et al. . Urban Carnivores. , (2010).
- Sauer, J. R., Link, W. A., Fallon, J. E., Pardieck, K. L., Ziolkowski, D. J. The North American Breeding Bird Survey 1966-2011: Summary Analysis and Species Accounts. North Am Fauna. 1 (79), 1-32 (2013).
- Endreny, T., Sica, F., Nowak, D. Tree Cover Is Unevenly Distributed Across Cities Globally, With Lowest Levels Near Highway Pollution Sources. Front Sustain Cities. 10, 2 (2020).
- . Protected Areas Database of the United States (PAD-US) Available from: https://www.census.gov/library/visualizations/2021/geo/population-distribution-2020.html (2024)
- Parsons, A. W., Forrester, T., Baker-Whatton, M. C., McShea, W. J., Rota, C. T., Schmid, B., Baldwin, I. T., Schmid, B., Kéry, M., Kühn, I. Mammal communities are larger and more diverse in moderately developed areas. eLife. 7, e38012 (2018).
- Diuk-Wasser, M. A., Gatewood, A. G., Cortinas, M. R., Yaremych-Hamer, S., Tsao, J., et al. Spatiotemporal Patterns of Host-Seeking Ixodes scapularis Nymphs (Acari: Ixodidae) in the United States. J Med Entomol. 43 (2), 166-176 (2006).
- Lilly, M. V., Konowal, C. R. Wildlife Insights: New York City UWIN Camera-trappingTransect. Wildlife Insights. , (2025).
- Daniels, L. D., Lavallee, S. Better Safe than Sorry: Planning for Safe and Successful Fieldwork. Bull Ecol Soc Am. 95 (3), 264-273 (2014).
- Palencia, P., Vicente, J., Soriguer, R. C., Acevedo, P. Towards a best-practices guide for camera trapping: assessing differences among camera trap models and settings under field conditions. J Zool. 316 (3), 197-208 (2022).
- Xu, G., Siegel, E., Fernandez, N., Bechtold, E., Daly, T., et al. Active Surveillance of Powassan Virus in Massachusetts Ixodes scapularis Ticks, Comparing Detection Using a New Triplex Real-Time PCR Assay with a Luminex Vector-Borne Panel. Viruses. 16 (2), 250 (2024).
- Salomon, J., Hamer, S. A., Swei, A., Machtinger, E. . A Beginner's Guide to Collecting Questing Hard Ticks (Acari: Ixodidae): A Standardized Tick Dragging Protocol. 20 (6), 11 (2020).
- Pratt, S. D., Littig, K. S. . Ticks of public health importance and their control. , 42 (2025).
- Durden, L. A., Keirans, J. E. Key to the Nymphs of the Genus Ixodes of the United States. Nymphs of the Genus Ixodes. (Acari: Ixodidae) of the United States: Taxonomy, Identification Key, Distribution, Hosts, and Medical/Veterinary Importance. , (2005).
- Keirans, J. E., Litwak, T. R. Pictorial Key to the Adults of Hard Ticks, Family Ixodidae (Ixodida: Ixodoidea), East of the Mississippi River. J Med Entomol. 26 (5), 435-448 (1989).
- Dubie, T. R., Grantham, R., Coburn, L., Noden, B. H. Pictorial Key for Identification of Immature Stages of Common Ixodid Ticks Found in Pastures in Oklahoma. Southwest Entomol. 42 (1), 1-14 (2017).
- Kopsco, H. L., Mather, T. N. Tick-Borne Disease Prevention Behaviors Among Participants in a Tick Surveillance System Compared with a Sample Of Master Gardeners. J Community Health. 47 (2), 246-256 (2022).
- Sakamoto, J. M. Progress, challenges, and the role of public engagement to improve tick-borne disease literacy. Curr Opin Insect Sci. 28, 81-89 (2018).
- Sterling, E. J., Betley, E., Sigouin, A., Gomez, A., Toomey, A., et al. Assessing the evidence for stakeholder engagement in biodiversity conservation. Biol Conserv. 209 (159), 171 (2017).
- Brooks, J., Waylen, K. A., Mulder, M. B. Assessing community-based conservation projects: A systematic review and multilevel analysis of attitudinal, behavioral, ecological, and economic outcomes. Environ Evid. 2 (1), 2 (2013).
- Apfelbeck, B., Snep, R. P. H., Hauck, T. E., Ferguson, J., Holy, M., et al. Designing wildlife-inclusive cities that support human-animal co-existence. Landsc Urban Plan. 200, 103817 (2020).
- Magle, S. Lessons learned about steering a large urban wildlife research network from theory to practice. Urban Ecosyst. 26 (6), 1685-1691 (2023).
- Harris, G., Thompson, R., Childs, J. L., Sanderson, J. G. Automatic Storage and Analysis of Camera Trap Data. Bull Ecol Soc Am. 91 (3), 352-360 (2010).
- Leorna, S., Brinkman, T. Human vs. machine: Detecting wildlife in camera trap images. Ecol Inform. 72, 101876 (2022).
- Ginsberg, H. S., Buckley, P. A., Balmforth, M. G., Zhioua, E., Mitra, S., Buckley, F. G. Reservoir Competence of Native North American Birds for the Lyme Disease Spirochete, Borrelia burgdorferi. J Med Entomol. 42 (3), 5 (2005).
- Pickett, S. T. A., Cadenasso, M. L., Rademacher, A. M. Coproduction of place and knowledge for ecology with the city. Urban Ecosyst. 25 (3), 765-771 (2022).
- Toomey, A., Smith, J., Becker, C., Palta, M. Towards a pedagogy of social-ecological collaborations: engaging students and urban nonprofits for an ecology with cities. Urban Ecosyst. 26 (2), 425-432 (2023).
- Mach, K. J., Lemos, M. C., Meadow, A. M., Wyborn, C., et al. Actionable knowledge and the art of engagement. Curr Opin Environ Sustain. 42, 30-37 (2020).
Reprints and Permissions
