This study evaluated a novel NGS-based BCR/TCR clonality assay (OriMIRACLE LTM) for MRD detection in lymphoid malignancies, including multiple myeloma (MM). Using cell lines and clinical smears, it showed a >90% detection rate and 81.36% concordance with flow cytometry. The assay offers high sensitivity, predicts relapse, and supports treatment decisions.
Research Article
Next-Generation Sequencing Clonality Assays: Clinical Validation for Minimal Residual Disease Monitoring in Multiple Myeloma
* These authors contributed equally
In This Article
Summary
Abstract
Minimal residual disease (MRD) detection is crucial for managing lymphoid malignancies. This study introduces OriMIRACLE LTM, a novel next-generation sequencing (NGS)-based B-cell receptor (BCR) and T-cell receptor (TCR) clonality assay for MRD detection. We validated the assay using cell lines and clinical samples, including residual smears, from patients with Multiple Myeloma (MM). The BCR/TCR clonality assay demonstrated an over 90% positive detection rate in lymphoid malignancies. Validation studies in MM patients demonstrated an 81.36% (48/59) concordance rate between multicolor flow cytometry (MFC) and clinical response assessment in tumor cell detection. Notably, 61.11% (11/18) of MM patients positive for MRD by both NGS and MFC experienced disease progression or relapse. Patients with MRD detected solely by NGS exhibited lower clinical complete response rates, and some initially responsive MM patients relapsed after treatment cessation. These findings indicate that this NGS-based assay offers highly sensitive and specific MRD detection in lymphoid malignancies, even in MM patient-derived residual smear samples. It demonstrates advantages over MFC and proves valuable for MRD tracking. In conclusion, current evidence supports NGS as a complementary tool to MFC, particularly in MFC⁻/NGS⁺ patients, as NGS offers deeper risk stratification. However, the optimal intervention threshold remains to be determined by prospective studies.
Introduction
Multiple myeloma (MM) is a hematologic malignancy characterized by the proliferation of aberrant clonal plasma cells in the bone marrow1. In China, 2022 saw approximately 22,450 new MM diagnoses and 17,360 related deaths2. Despite significant advancements in MM treatment over the past decade, which have substantially prolonged median patient survival. However, the majority of patients ultimately experience relapse3,4. This dramatic increase underscores the critical need for precise remission monitoring, early relapse prediction, and timely therapeutic interventions.
Clinical evidence has firmly established the prognostic significance of minimal residual disease (MRD) status in hematologic malignancies5,6,7. Recognizing its importance, the International Myeloma Working Group (IMWG) incorporated MRD assessment into its response evaluation criteria in 20168. Current methods for bone marrow MRD assessment include allele-specific oligonucleotide polymerase chain reaction (ASO-PCR), digital PCR (dPCR), multiparametric flow cytometry (MFC), and next-generation sequencing (NGS) assays8. While ASO-PCR offers sensitive detection, it is time-consuming and challenging to standardize due to the requirement for patient-specific primers9,10. Similarly, dPCR is constrained by its allele-specific design10,11. MFC has been instrumental in MRD detection12, providing rapid cellular-level information, but it faces challenges with standardization and reproducibility.
NGS presents a reproducible, highly sensitive approach that eliminates the need for patient-specific primers. It enables reliable identification and quantification of unique immunoglobulin rearrangements in hematologic malignancies13. The Food and Drug Administration (FDA) has approved Adaptive Biotechnologies' ClonoSEQ for MRD testing in patients with acute lymphoblastic leukemia (ALL), MM, and chronic lymphocytic leukemia (CLL)14,15,16. Numerous international clinical guidelines now include NGS as a recommended method for MRD monitoring. The Chinese Guidelines for the Diagnosis and Treatment of MM (Revised 2020) also endorse MRD evaluation in MM patients using methods such as next-generation flow cytometry (NGF) and NGS17.
To our knowledge, NGS technology is not the preferred method for MRD detection in lymphoid malignancies in clinical practice due to cost and time constraints. When MFC results are negative, an additional bone marrow aspiration is often necessary to detect MRD. This additional procedure can impose significant physical and psychological burdens on patients, potentially limiting its widespread clinical application.
In this study, we have developed, characterized, and validated the performance of an NGS-based B or T cell receptor (BCR/TCR) clonality assay (OriMIRACLE LTM). The primary objectives of this study were to validate the sensitivity and specificity of this assay for tracking MRD in lymphoid malignancies, even when using residual smear samples. This method can directly utilize residual bone marrow smears left over from routine diagnosis, thereby overcoming the inherent limitations of smear samples. Even when DNA in the smears is fragmented due to fixation, staining, and long-term storage, present in extremely low quantities, or partially degraded, reliable immune repertoire profiles can be obtained through optimized nucleic acid extraction and multiplex PCR amplification. It enables high-sensitivity clonal tracking with a sensitivity of 10⁻5 to 10⁻6, surpassing the lower detection limit of conventional flow cytometry-based MRD. This work highlights the potential of NGS-based BCR/TCR clonality assessment in enhancing MRD tracking and informing treatment decisions for patients with MM, potentially addressing the current limitations in clinical practice.
Protocol
This study was conducted in accordance with the principles of the Declaration of Helsinki and approved by the Ethics Committee of the First Affiliated Hospital of Gannan Medical University (Ethics approval number: 22SC-2023011201). Written informed consent was obtained from all participants prior to their inclusion in the study.
Sample selection
Clinical samples were obtained from 40 patients diagnosed with various hematological malignancies, including ALL, MM, CLL, and lymphoma. Additionally, paired chronic- and blast-phase samples from patients with chronic myeloid leukemia were collected. Samples were obtained from the First Affiliated Hospital of Gannan Medical University, Jiangxi, China, between December 2016 and August 2022. These specimens were derived from bone marrow aspirates (BMA) or peripheral blood. Four lymphoid malignancy cell lines were also utilized: B-ALL lines REH and NALM6, T-ALL line Jurkat, and lymphoma line H9, all procured from the American Type Culture Collection (ATCC; Manassas, VA).
For the analytical validation study, a subset of paired clinical residual bone marrow smears collected before and after treatment from 30 newly diagnosed or relapsed MM patients was included. MFC assays were performed on BMA samples at corresponding time points using 4-color flow cytometry.
Samples were stained with six different 4-color antibody combinations (dilutions as per the manufacturer's instructions): CD38/CD56/CD45/CD19, CD38/CD138/CD45/CD34, CD38/CD117/CD45/CD33, CD38/CD22/CD45/CD20, CD38/CD9/CD45/HLA-DR, and K/L/CD45/CD38. Staining was performed for 30 min at 4 °C in the dark, followed by two washes with PBS (centrifugation at 500 × g for 5 min at 4 °C). In immunohematology laboratories, MFC-MRD positivity in bone marrow is currently defined using a threshold of 10-4 (1 cell in 10,000). Flow cytometry acquisition quality was verified by visualizing forward/side scatter and confirming at least 10,000 CD45+ events per tube.
Clonality detection and MRD tracking by the NGS-based clonality assay
gDNA was extracted from 200 µL of BMA, peripheral blood, or entire residual smear (resuspended in 200 µL of PBS) using the corresponding kit according to the manufacturer's instructions. Minimum gDNA concentration of 20 ng/µL and total yield ≥ 1 µg were required. A260/A280 ratio 1.8–2.0 was verified. This assay amplifies gDNA using locus-specific multiplex PCR with primers, followed by the addition of a reaction-specificity index barcode to the amplified receptor sequence for sample identification. The barcoded, amplified DNA is then pooled to prepare sequencing libraries, which undergo NGS using the Illumina platform. Final library size 350–450 bp and concentration ≥ 5 nM were verified on the Bioanalyzer. Sequencing data are processed using customized bioinformatics pipelines and rigorous quality control measures. Reads are assigned to rearranged BCRs or TCRs for each sample and aggregated into clonal receptor sequences. These sequences are then assessed for their disease-related potential and suitability for subsequent tracking. To be considered suitable, a sequence must constitute at least 10% of all BCR sequences at the given locus and demonstrate sufficient uniqueness. When evaluating a sequence for MRD tracking, its uniqueness is determined by comparing it to a comprehensive B or T cell repertoire database, such as the ImMunoGeneTics (IMGT) database (http://www.imgt.org). The frequency of the sequence within this database is used to assess its distinctiveness. Once appropriate disease-related sequences are identified, they are compared to subsequent samples to monitor MRD. Samples are classified as MRD-positive (+) if sequence matches are found, or MRD-negative (-) if no matches are detected. The concentration of each monitored sequence is quantified, enabling the calculation of consensus malignant cell and total nucleated cell counts at the sample level. The ratio between these figures provides an estimate of the tumor cell frequency within a sample, offering valuable insights into disease progression or remission. A clonal sequence was considered valid for tracking if at least 50 supporting reads were detected and the sequence comprised ≥10% of the total BCR/TCR repertoire at diagnosis.
All human-derived samples were handled as biohazardous in a Class II biosafety cabinet (BSC) with personal protective equipment (PPE). Contaminated consumables were autoclaved (121 °C, 20 min) before disposal; liquid waste was treated with 10% bleach.
Precision and sensitivity studies
The limit of detection (LOD) was determined using clinical samples and cell lines against a background of peripheral blood gDNA from healthy donors. To establish the linearity of detection, cell line gDNA was spiked into normal gDNA to create a range of clonal frequencies spanning several orders of magnitude. Specifically, malignant cells were spiked starting from 10 cells, followed by 10-fold serial dilutions: 10, 100, 1,000, and 10,000 cells. The LOD was calculated as the expected number of malignant input cells at which the fitted probit curve reached a 95% detection probability. The consistency between observed and expected frequencies was analyzed using linear regression. These parameters provide a robust foundation for sample-level MRD estimation in subsequent evaluation studies. This refined version maintains the academic tone while improving clarity and conciseness. It also ensures proper use of scientific terminology and adheres to the conventions of scholarly writing in the field of life sciences and medicine.
Statistical analysis
Two-sided p < 0.05 was considered statistically significant. Linearity was assessed and calculated using Pearson's correlation coefficient (r) in GraphPad Prism. The statistical analysis was performed with R language (version 3.6.1). The calculation of progression-free survival (PFS) begins at the time the patient achieves complete response (CR), partial response (PR), or very good partial response (VGPR), and continues until the occurrence of progressive disease (PD) or death from any cause. The Kaplan-Meier curve was used to analyze survival, and the log-rank test was used to compare the difference in survival between subgroups. The Cox analysis was conducted using both univariate and multivariate analyses.
Results
The processing, linearity, and precision of clonality detection
The BCR/TCR clonality assays were based on two rounds of multiplex PCR followed by NGS (Figure 1). The BCR clonality assays could identify IGH (VH-DH-JH or DH-JH), IGK (Vκ-Jκ, Vκ-Kde, and intronRSS-Kde), and IGL (Vλ-Jλ) rearrangements, as well as BCL1-IGH and BCL2-IGH translocations using separate reactions or a single adjusted mixed reaction. TCR clonality assays could detect TCRB (Vβ-Dβ-Jβ) and TCRG (Vγ –Jγ) rearrangements. The BCR clonality of B-cell lymphoid malignancies showed a detected rate of 93.94%, and the TCR clonality of T-cell lymphoid malignancies showed a detected rate of 90.91% (Table 1).
Linearity was demonstrated across a wide range of sample inputs (0.2 µg, 2 µg, and 20 µg) based on the results of cell line tests, spanning several orders of magnitude. To establish linearity, malignant cells were spiked into normal gDNA using 10‑fold serial dilutions (10, 100, 1,000, and 10,000 cells). The linearity was observed with estimated slopes from 0.93–1.06 across clonal frequencies from 1 to 10-6 (Figure 2A). The LOD was estimated to be between 1 and 2 malignant cells in both BCR and TCR clonality assays (Figure 2B). Furthermore, the BCR/TCR clonality assays were able to detect clonality in lymphoma using tissue samples (BMA) and matched peripheral blood (Supplementary Table 1).
Patients and samples used for validating MRD detection
Validation of MRD detection included a total of 29 patients with MM, with one patient excluded due to sample damage. The study population consisted of 65.52% (19/29) males and 34.48% (10/29) females, with a median age of 65 years (range 33–82) (Table 2). Among the cohort, 31.03% (9/29) of patients were classified as high-risk, 24.14% (7/29) as standard risk, and 37.93% (11/29) as low-risk according to the IMWG criteria18. The revised multiple myeloma international staging system (R-ISS) stages I, II, and III represented 10.34% (3/29), 48.28% (14/29), and 20.69% (6/29) of patients, respectively19.
Comparison of NGS and MFC assays
A direct pairwise comparison was conducted to evaluate the quantitative accuracy of the OriMIRACLE LTM and MFC assays. The results showed similar quantitative accuracy across the tested range, particularly at MRD frequencies above 10−4, with a Pearson R value of 0.73 (Figure 3). Tumor cells were detected by both MFC and NGS assays in 59 samples from 29 MM patients, and the consistency reached 81.36% (48/59). This consistency reflects the presence of detectable tumor cells across different time points, rather than true concordance between methods. Among the samples, 62.07% (18/29) tested MRD+ by both NGS and MFC assays, one patient tested MRD− by both methods, and 11 patients tested MRD+ by NGS but MRD− by MFC. Among the patients with inconsistent detection results, three had a detection frequency below 10-4, while eight had a detection frequency within the range of 10-2–10-4 (Figure 3). DNA extraction from residual bone marrow smear samples is performed to obtain as much DNA as possible. For clonality detection before treatment, an average of 91.95 ng (up to 100.0 ng) of DNA input was tested. An average of 1623.39 ng (ranging from 50.1–17400.0 ng) of DNA was extracted for subsequent MRD testing (Supplementary Table 2). It revealed that NGS can detect MRD even when the residual sample is insufficient, whereas MFC failed to detect MRD in some cases.
Clinical validity of MRD detection by NGS assay for lead interval
Clonal sequences were detected at baseline in all MM patients, followed by the assessment of MRD (Figure 4). Eighteen patients were confirmed to be MRD+ through NGS and MFC detection. Among the patients with MRD+ by both MFC and NGS, 61.11% (11/18) subsequently experienced PD or relapse. 38.89% (7/18) of patients achieved stable disease (SD) or PR during the study. Among patients confirmed MRD+ by NGS but MRD− by MFC, 36.36% (4/11) were unable to achieve clinical CR at the most recent clinical evaluation (Supplementary Table 2). In addition, among all patients whose clinical response was CR, 37.50% (3/8) of patients experienced relapse after treatment discontinuation. We also explored primary clinical features and MFC results in relation to the outcome of PFS (Supplementary Figure 1). Univariate and multivariate analyses of PFS revealed that they were not significantly related. In this study, there was no significant difference observed in PFS when analyzing only the MRD results obtained from MFC.
DATA AVAILABILITY
Due to patient privacy restrictions and institutional policies, the raw data are not publicly available. A summary of the collected data is provided in Supplementary File 1.
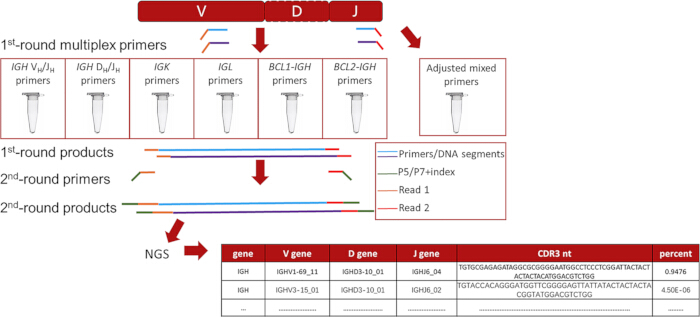
Figure 1: The BCR/TCR clonality assay involved multiplex PCR followed by NGS. The first-round PCR amplified the CDR3 region of rearranged immune receptor genes using locus-specific primers and sample-specific indices, and NGS adapters were added during the second-round PCR. Please click here to view a larger version of this figure.
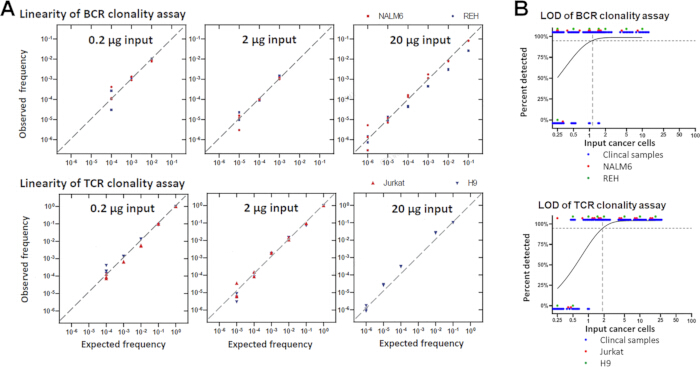
Figure 2: Linearity of clonality detection was assessed by spiking cell line gDNA into normal gDNA across a range of clonal frequencies. (A) Linearity of BCR and TCR clonality assays. (B) Limit of detection (LOD) estimated using clinical samples and cell lines spiked into healthy donor peripheral blood gDNA. Please click here to view a larger version of this figure.
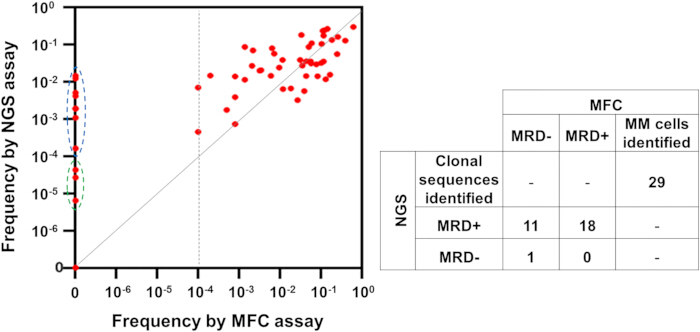
Figure 3: Pairwise comparison of MRD frequency measurements between MFC and the NGS MRD assay. Please click here to view a larger version of this figure.
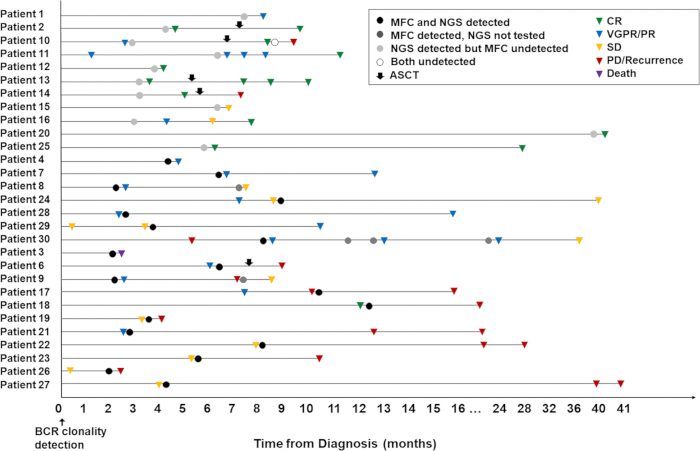
Figure 4: The MRD dynamics of MM patients and the different clinical statuses of patients. Please click here to view a larger version of this figure.
| Sample types | No. | Disease type | Dominant clonotype | |
| Cell lines | REH | 1 | B-ALL | IGH, IGK |
| NALM6 | 2 | B-ALL | IGH, IGK | |
| Jurkat | 3 | T-ALL | TCRB, TCRG | |
| H9 | 4 | Lymphoma | TCRB, TCRG | |
| Clinical B-cell lymphoid malignancies | 5 | B-ALL | IGH | |
| 6 | B-ALL | IGL | ||
| 7 | B-ALL | IGH | ||
| 8 | B-ALL | Not detected | ||
| 9 | CLL | IGH, IGK | ||
| 10 | CLL | IGH, IGK | ||
| 11 | CP-CML | IGH | ||
| 12 | BP-CML | IGH | ||
| 13 | MM | IGK | ||
| 14 | MM | IGH, IGK | ||
| 15 | MM | IGK | ||
| 16 | MM | IGH | ||
| 17 | MM | IGH | ||
| 18 | MM | IGK | ||
| 19 | MM | IGH | ||
| 20 | MM | IGH, IGK | ||
| 21 | MM | IGH, IGK | ||
| 22 | MM | IGH | ||
| 23 | Lymphoma | IGH, IGK | ||
| 24 | Lymphoma | IGH, IGK, IGL | ||
| 25 | Lymphoma | IGH, IGK, IGL | ||
| 26 | Lymphoma | IGH, IGK, IGL | ||
| 27 | Lymphoma | IGH | ||
| 28 | Lymphoma | IGH | ||
| 29 | Lymphoma | IGH, IGK, IGL | ||
| 30 | Lymphoma | IGH, IGK | ||
| 31 | Lymphoma | IGH, IGK | ||
| 32 | Lymphoma | IGH, IGK, IGL | ||
| 33 | Lymphoma | IGK | ||
| 34 | Lymphoma | IGH | ||
| 35 | Lymphoma | Not detected | ||
| Clinical T-cell lymphoid malignancies | 36 | Lymphoma | TCGR | |
| 37 | Lymphoma | TCRB, TCRG | ||
| 38 | Lymphoma | TCRB, TCRG | ||
| 39 | Lymphoma | TCRB, TCRG | ||
| 40 | Lymphoma | TCRB, TCRG | ||
| 41 | Lymphoma | TCRB, TCRG | ||
| 42 | Lymphoma | TCRB, TCRG | ||
| 43 | Lymphoma | TCRB, TCRG | ||
| 44 | Lymphoma | Not detected | ||
Table 1: Clonality detection using the BCR/TCR clonality assays in 4 cell lines and 40 clinical samples. B-ALL: B-cell acute lymphocytic leukemia; T-ALL: T-cell acute lymphocytic leukemia; CP-CML: Chronic phase chronic myeloid leukemia; BP-CML: Blast phase chronic myeloid leukemia; CLL: Chronic lymphocytic leukemia; MM: Multiple myeloma.
| Characteristic | Total (N = 29) |
| Median age, years (range) | 65 (33-82) |
| Gender, n (%) | |
| Male | 19 (65.52) |
| Female | 10 (34.48) |
| Heavy chain type, n (%) | |
| IgG | 14 (48.28) |
| IgA | 7 (24.14) |
| IgE | 1 (3.45) |
| Light chain type, n (%) | |
| k | 19 (65.52) |
| λ | 8 (27.59) |
| Cytogenetic abnormality, n (%) | |
| del17p | 2 (6.90) |
| del13q14 | 9 (31.03) |
| 1q21 gain/amp | 12 (41.38) |
| t (4;14) | 2 (6.90) |
| No abnormalities | 9 (31.03) |
| ISS stage, n (%) | |
| I | 4 (13.79) |
| II | 13 (44.83) |
| III | 12 (41.38) |
| R-ISS stage, n (%) | |
| I | 3 (10.34) |
| II | 14 (48.28) |
| III | 6 (20.69) |
| Missing | 6 (20.69) |
| IMWG, n (%) | |
| High-risk | 9 (31.03) |
| Standard risk | 7 (24.14) |
| Low-risk | 11 (37.93) |
| Missing | 2 (6.90) |
Table 2: Baseline characteristics of the 29 MM patients enrolled in this study. k: kappa; λ: Lambda; DS: Durie-Salmon; ISS: International staging system; R-ISS: revised International staging system; IMWG: International Myeloma Working Group
Supplementary Figure 1: Survival analysis based on clinical characteristics and MFC results. (A) Univariate and multivariate analyses of PFS. (B) Kaplan-Meier curve with MFC result. (C) Kaplan-Meier curve with NGS result. Please click here to download this file.
Supplementary Table 1: Clonality detection of lymphoma using the BCR/TCR clonality assays in tissue samples and matched peripheral blood. NHL: non-Hodgkin's lymphoma; HGBL: high-grade B-cell lymphoma; FL: follicular lymphoma; DLBCL: diffuse large B cell lymphoma; ITLPD-GI: indolent T-lymphoproliferative disorders of the gastrointestinal tract. Please click here to download this file.
Supplementary Table 2: The results of MRD detection based on MFC and NGS assays. ND: not detected; Partial response: PR; Complete response: CR; Stable disease: SD; Very good partial response: VGPR. Please click here to download this file.
Supplementary File 1: Summary of raw data collected in this study. Please click here to download this file.
Discussion
Recent years have witnessed significant improvements in clinical outcomes for lymphoid malignancies, spurring a quest for alternative markers capable of predicting survival endpoints earlier and expediting the evaluation of new therapies20. A comprehensive meta-analysis encompassing 8,098 patients has reaffirmed the robust prognostic value of MRD negativity in enhancing long-term survival among MM patients21. Furthermore, BCR and TCR clonal rearrangements have emerged as crucial diagnostic and MRD tracking markers, guiding treatment decisions in lymphatic system malignancies22.
Mounting evidence supports the superiority of NGS-based BCR/TCR clonality assessment over MFC and PCR-based assays, particularly when ample DNA samples are available. NGS offers higher sensitivity and simpler standardization10,23,24,25,26 and has been identified as a strong prognostic factor for both PFS and overall survival at the initiation of maintenance therapy27.
In this study, we developed the NGS-based assay, which demonstrates a positive detection rate exceeding 90% for both BCR and TCR clonality in lymphoid malignancies. The assay's LOD is estimated between 1 and 2 malignant cells for both BCR and TCR clonality assays, comparable to the clonoSEQ Assay's high sensitivity with an LOD of 1.903 malignant cells16. We observed linearity with estimated slopes ranging from 0.93 to 1.06 across clonal frequencies from 1 to 10-6, indicating strong proportionality between observed and expected clonal frequencies. Following the establishment of standardized detection methods and completion of laboratory validation, we conducted clinical validation to ensure the assay's suitability for clinical MRD monitoring.
This study revealed an 81.36% (48/59) consistency between the NGS-based assay and MFC. Both methods demonstrated 100% sensitivity in identifying tumor cells in newly diagnosed or relapsed cases. For post-treatment monitoring, we found no significant correlation between MRD status assessed by MFC and PFS, likely due to the limited sample size. Consequently, we conducted a comprehensive analysis of all cases.
Among the 18 patients identified as MRD-positive by both methods, the MRD results aligned with clinical response evaluations. Nine of these patients experienced PD or relapse, four achieved SD, four achieved PR, and one died. This suggests that for patients testing MRD-positive by both methods, PD or relapse is almost invariably observed. These data suggest that MRD positivity from both NGS and MFC assays mostly reflects limited efficacy or poor prognosis in these patients. Of the 11 patients who tested MRD-positive by NGS but MRD-negative by MFC, 36.36% failed to achieve CR. These findings underscore NGS's capacity to detect MRD at frequencies ranging from 10-2 to 10-6, even with limited residual samples, while MFC failed to detect MRD in some cases. This further supports the higher sensitivity and specificity of NGS in MRD detection compared to MFC.
Previous research has demonstrated that MRD status assessed by MFC is a strong predictor of PFS and overall survival in MM patients, underscoring the importance of MRD monitoring in guiding treatment decisions and assessing prognosis after autologous stem cell transplantation28. The results here further highlight the significance of NGS assays, as exemplified by two cases (patients 11 and 14) where patients tested MRD-negative by MFC but MRD-positive by NGS. It is crucial to note that discontinuing treatment in such cases may lead to a risk of relapse, underscoring the need for careful evaluation of treatment response when discordant MRD results are observed.
This study breaks the reliance of existing NGS and MFC methods on fresh bone marrow aspirates or frozen cells and, for the first time, systematically validates that residual, even-stained bone marrow smears left after routine diagnosis can serve as reliable starting material for high-sensitivity MRD detection. This directly addresses the following clinical and methodological gaps: (1) it avoids the need to extract large volumes of bone marrow fluid for MRD monitoring, especially in elderly patients or those with difficult sampling; (2) it enables retrospective analysis of archived smears, thereby leveraging existing pathological resources to establish MRD-based prognostic evidence in historical cohorts; and (3) with a detection sensitivity of 10-5-10-6, it is far superior to conventional MFC (typically 10-4-10-5) and bypasses the false negatives caused by sample quality issues in MFC, providing a DNA-based, trackable MRD assessment tool for clinical practice.
Several critical steps were identified to ensure the success and reliability of the assay. Gentle scraping of residual smears followed by immediate buffer application was essential for obtaining adequate gDNA yield. Precise input DNA quantity (100 ng per reaction, within ±10%) was required to avoid allele dropouts or biased amplification. Equimolar pooling of barcoded products (2 nM) contributed to uniform sequencing depth, and consistent application of bioinformatics thresholds (≥10% clonal frequency at diagnosis and ≤5% mismatches for tracking) helped prevent false-positive MRD calls. In addition, several modifications to the standard protocol were introduced to address common experimental issues. When the final library concentration fell below 5 nM, a second round of PCR with 2–4 additional cycles was added cautiously to avoid over-amplification bias. For samples where clonal tracking failed due to excessive mismatches (>5%), the reference IMGT database was updated, and the mismatch tolerance was temporarily relaxed to 8% for exploratory analysis, although 5% remained the standard cutoff for clinical reporting. If the sequencing depth dropped below 50,000 reads per sample, re-pooling and re-sequencing were performed without repeating the PCR step.
Overall, this real-world validation demonstrates that residual bone marrow smear samples yield consistent and reliable test results across various treatment settings. In economically disadvantaged areas where bone marrow biopsy and MFC are routinely performed instead of NGS, the findings suggest that NGS can be considered for further molecular evaluation when initial results are negative. Utilizing residual samples is appropriate in such situations, as it eliminates the need for repeated bone marrow aspiration, thereby reducing patient burden.
While our ongoing real-world study aims to expand the sample size for further analysis, we acknowledge several limitations. False negatives can occur, particularly when extracted DNA content is insufficient, as observed in the second MRD detection for patient 10. Additionally, the proportion of clones detected by NGS is affected by cell quantification, potentially leading to overestimation of MRD cell proportions. The validation primarily focuses on bone marrow samples. However, the long-term significance of NGS-MRD lies in multiple follow-ups after treatment, where peripheral blood may be more suitable. Validation of peripheral blood samples has not yet been conducted. Given the limited number of clinical validation samples, random patient enrollment, and the diverse treatment approaches in this real-world study, collecting consecutive MRD samples proved challenging. Consequently, we focused on assessing the significance of early MRD responses in relation to subsequent progression, and could not demonstrate the impact of persistent MRD status on long-term outcomes. Moreover, NGF was not included in the comparative analysis. Although NGS and conventional MFC were systematically compared, NGF, as one of the two IMWG-recommended MRD methods (another is NGS), would have provided additional insight into assay performance. Furthermore, the sample size is relatively small (n = 40), and the cohort is heterogeneous, including various hematological malignancies. Future multicenter, large-scale studies incorporating NGF and focusing on a single malignancy, such as multiple myeloma, are warranted to confirm and extend our conclusions.
Having thoroughly characterized and validated the performance of the NGS-based BCR/TCR clonality assay, we demonstrated that it has potential as a highly sensitive, accurate, and practical method for quantifying and monitoring MRD in residual bone marrow smear samples from MM patients.
Disclosures
The authors declare that they have no conflict of interest.
Acknowledgements
This research was supported by a grant from the Natural Science Foundation of the Jiangxi Provincial Department of Science and Technology (No. 20232BAB206059), Jiangxi Provincial Department of Education Science and Technology Research Project (No. GJJ211518), Science and Technology Plan Project of Jiangxi Provincial Health Commission (No. 202310782), and Guiding Science and Technology Plan Project of Ganzhou Science and Technology Bureau of Jiangxi Province (No. GZ2020ZSF027). Science and Technology Plan Project of Jiangxi Provincial Administration of Traditional Chinese Medicine (No. 2024B0710)
Materials
| Name | Company | Catalog Number | Comments |
|---|---|---|---|
| Anti-CD19 | Abcam | AB134114 | Dilution as per manufacturer instructions |
| Anti-CD20 | Abcam | AB64088 | Dilution as per manufacturer instructions |
| Anti-CD22 | Abcam | AB32123 | Dilution as per manufacturer instructions |
| Anti-CD33 | Abcam | AB134115 | Dilution as per manufacturer instructions |
| Anti-CD34 | Abcam | AB81289 | Dilution as per manufacturer instructions |
| Anti-CD38 | Abcam | AB183326 | Dilution as per manufacturer instructions |
| Anti-CD45 | Abcam | AB40763 | Dilution as per manufacturer instructions |
| Anti-CD56 | Abcam | AB75813 | Dilution as per manufacturer instructions |
| Anti-CD9 | Abcam | AB2215 | Dilution as per manufacturer instructions |
| Anti-HLA-DR | Abcam | AB20181 | Dilution as per manufacturer instructions |
| GraphPad Prism | GraphPad | https://www.graphpad.com/ | |
| Illumina NovaSeq 6000 | Illumina | NovaSeq 6000 | https://www.illumina.com/systems/sequencing-platforms/novaseq.html |
| ImMunoGeneTics (IMGT) database | ImMunoGeneTics (IMGT) database | http://www.imgt.org/ | |
| Lymphoid malignancy cell lines | ATCC | https://www.atcc.org/ | B-ALL lines REH and NALM6, T-ALL line Jurkat, and lymphoma line H9 (DSMZ) |
| Multiparameter flow cytometry | BECKMAN COULTER | CytoFLEX | |
| OriMIRACLE LTM assay | Origimed Co., Ltd., Shanghai, China | ||
| R language | R Foundation for Statistical Computing | version 3.6.1 |
References
- van de Donk N, Pawlyn C, Yong KL. Multiple myeloma. Lancet. 2021;397(10272):410-27.
- Xia C, et al. Cancer statistics in China and United States, 2022: Profiles, trends, and determinants. Chin Med J. 2022;135(5):584-90.
- Ricciuti G, Falcone A, Cascavilla N, Martinelli G, Cerchione C. Autologous stem cell transplantation in multiple myeloma. Panminerva Med. 2020;62(4):220-4.
- Feng D, Sun J. Overview of anti-BCMA CAR-T immunotherapy for multiple myeloma and relapsed/refractory multiple myeloma. Scand J Immunol. 2020;92(2):e12910.
- Ontario Health. Minimal residual disease evaluation in childhood acute lymphoblastic leukemia: A clinical evidence review. Ont Health Technol Assess Ser. 2016;16(7):1-52.
- Yanamandra U, Kumar SK. Minimal residual disease analysis in myeloma: When, why and where. Leuk Lymphoma. 2018;59(8):1772-84.
- Bassan R, Brüggemann M, Radcliffe HS, Hartfield E, Kreuzbauer G, et al. A systematic literature review and meta-analysis of minimal residual disease as a prognostic indicator in adult B-cell acute lymphoblastic leukemia. Haematologica. 2019;104(10):2028-39.
- Kumar S, et al. International Myeloma Working Group consensus criteria for response and minimal residual disease assessment in multiple myeloma. Lancet Oncol. 2016;17(8):e328-e346.
- Dogliotti I, Drandi D, Genuardi E, Ferrero S. New molecular technologies for minimal residual disease evaluation in B-cell lymphoid malignancies. J Clin Med. 2018;7(9).
- Drandi D, et al. Highly sensitive MYD88(L265P) mutation detection by droplet digital polymerase chain reaction in Waldenström macroglobulinemia. Haematologica. 2018;103(6):1029-37.
- Camus V, et al. Digital PCR for quantification of recurrent and potentially actionable somatic mutations in circulating free DNA from patients with diffuse large B-cell lymphoma. Leuk Lymphoma. 2016;57(9):2171-9.
- Riva G, et al. Multiparametric flow cytometry for MRD monitoring in hematologic malignancies: Clinical applications and new challenges. Cancers. 2021;13(18).
- Anderson KC, et al. Minimal residual disease in myeloma: Application for clinical care and new drug registration. Clin Cancer Res. 2021;27(19):5195-212.
- ClonoSEQ cleared for residual cancer testing. Cancer Discov. 2018;8(12):OF6.
- Walzer S, Krenberger S, Vollmer L, Hewitt T, Eckert B. A cost impact analysis of clonoSEQ® as a valid and CE-certified minimal residual disease (MRD) diagnostic compared to no MRD testing in multiple myeloma in Germany. Oncol Ther. 2021;9(2):607-19.
- Ching T, et al. Analytical evaluation of the clonoSEQ assay for establishing measurable (minimal) residual disease in acute lymphoblastic leukemia, chronic lymphocytic leukemia, and multiple myeloma. BMC Cancer. 2020;20(1):612.
- Chinese Society of Hematology. The guidelines for the diagnosis and management of multiple myeloma in China (2020 revision). Zhonghua Nei Ke Za Zhi. 2020;59(5):341-6.
- Chng WJ, et al. IMWG consensus on risk stratification in multiple myeloma. Leukemia. 2014;28(2):269-77.
- Hagen P, Zhang J, Barton K. High-risk disease in newly diagnosed multiple myeloma: Beyond the R-ISS and IMWG definitions. Blood Cancer J. 2022;12(5):83.
- Rawstron AC, et al. Minimal residual disease assessed by multiparameter flow cytometry in multiple myeloma: Impact on outcome in the Medical Research Council Myeloma IX Study. J Clin Oncol. 2013;31(20):2540-7.
- Munshi NC, et al. A large meta-analysis establishes the role of MRD negativity in long-term survival outcomes in patients with multiple myeloma. Blood Adv. 2020;4(23):5988-99.
- Brüggemann M, et al. Standardized next-generation sequencing of immunoglobulin and T-cell receptor gene recombinations for MRD marker identification in acute lymphoblastic leukaemia: A EuroClonality-NGS validation study. Leukemia. 2019;33(9):2241-53.
- Medina A, et al. Comparison of next-generation sequencing (NGS) and next-generation flow (NGF) for minimal residual disease (MRD) assessment in multiple myeloma. Blood Cancer J. 2020;10(10):108.
- Kruse A, Abdel-Azim N, Kim HN, Ruan Y, Phan V, et al. Minimal residual disease detection in acute lymphoblastic leukemia. Int J Mol Sci. 2020;21(3).
- Kriegsmann K, et al. Comparison of NGS and MFC methods: Key metrics in multiple myeloma MRD assessment. Cancers. 2020;12(8).
- Takamatsu H. Comparison of minimal residual disease detection by multiparameter flow cytometry, ASO-qPCR, droplet digital PCR, and deep sequencing in patients with multiple myeloma who underwent autologous stem cell transplantation. J Clin Med. 2017;6(10).
- Perrot A, et al. Minimal residual disease negativity using deep sequencing is a major prognostic factor in multiple myeloma. Blood. 2018;132(23):2456-64.
- de Tute RM, et al. Minimal residual disease after autologous stem-cell transplant for patients with myeloma: Prognostic significance and the impact of lenalidomide maintenance and molecular risk. J Clin Oncol. 2022;40(25):2889-900.