M3-BREATHE is a mobile health (mHealth) system that integrates wearable sensors to monitor respiration, behaviour, and environmental exposures for personalized treatment and health evaluation in the real world.
Method Article
Real-World M3-BREATHE: Toward Multimodal Mobile Monitoring of Behaviour, Respiration, and Exposures for Treatment and Health Evaluation
In This Article
Summary
Abstract
The integration of mobile health (mHealth) technologies for continuous, real-time monitoring of physiological and behavioural signals, in concert with detailed measurement of environmental exposures, holds transformative potential for advancing personalized health risk assessment and enabling more effective treatment and intervention. In this protocol, I introduce a multimodal mobile monitoring system specifically designed to capture and integrate data on individual behaviour (daily activities and travel), respiratory function, physiological parameters and environmental exposures. The system combines mobile health devices and portable environmental sensors with GPS-enabled smartphone-based applications to generate synchronized, high-resolution data streams. These data are processed through a smart mobile phone application by incorporating physiological parameter calculation (e.g., physical activity intensity, respiratory rate) and external urban environmental data (e.g., urban green spaces, street view maps), after which a machine learning-based alert system was deployed to provide actionable insights into respiratory health, daily activities and mobility patterns, and exposure to risk factors. The protocol provides comprehensive and detailed guidance on hardware setup, software configuration, data acquisition procedures, and analytical workflows necessary for deploying the Multimodal Mobile Monitoring of Behaviour, Respiration, and Exposures (air pollution, noise, light, heat, greenness, etc.) for Treatment and Health Evaluation (M3-BREATHE) in both controlled clinical experiments and real-world contexts. This forward-looking M3-BREATHE platform establishes a scalable, non-invasive, and cost-efficient approach to longitudinal environment-mobility-health (E-M-H) monitoring, linking individual-level precision health in everyday life with long-term health intelligence at the population scale.
Introduction
Moving beyond traditional spatial epidemiology that has primarily emphasised population-level and area-based associations between environment and health, the focus is now shifting toward examining individual-level and mobility-based relationships and processes1,2,3,4. This shift is driven by several interrelated fundamental methodological problems, alongside emerging opportunities for more precise and context-sensitive approaches.
First, the modifiable areal unit problem (MAUP), which refers to the problem that, in the analysis of area- or zone-based data, the results may be influenced by the definition of the areal units for which data are reported5,6. It applies to two separate, but interrelated, problems with spatial data analysis. The first is the “scale problem”, where the same set of areal data is aggregated into several sets of larger areal units, with each combination leading to different data values and inferences. The second aspect of the MAUP is the “zoning problem”, where a given set of areal units is recombined into zones that are of the same size but located differently, again resulting in variation in data values and, consequently, different conclusions7,8. In order to deal with the questioning on the study’s contribution to advancing new knowledge utilizing area- or zone-based data, two methods are unremittingly discussed to minimize the impact of the MAUP. One is the maximization of within-area homogeneity. The selection of the proper areal unit of study will minimize measurement error of environmental exposure and non-differential exposure misclassification when estimating the contextual effect on health9,10,11. However, the heterogeneity of air pollution exposure within spatial units may still result in errors. Thus, another method is moving toward frame-independent forms of spatial data representation and analysis12,13. Moving beyond the conventional area-based understanding of contexts, individual-based measures account for the attribute homogeneity and spatial contiguity of contextual factors and can offer a robust analytical measure that is scale-independent or scale-invariant when examining the effects of environmental exposures on health14,15,16.
Second, the Uncertain Geographic Context Problem (UGCoP), referring to the problem that findings about the effects of area-based contextual variables on individual behaviours or outcomes may be affected by how contextual units (e.g., neighbourhoods) are geographically delineated and the extent to which these areal units deviate from the true geographic context17,18. A typical example is the evaluation of individuals’ exposure to air pollution may be erroneous by using residential locations for people who spend much time out of their homes for work, leisure, etc., which is far from the “true causally relevant” geographic context18,19. To mitigate the contextual uncertainties that influence the accurate assessment of people’s environmental exposures and their health effects, it is necessary to adopt mobility-based measurement that moves beyond notions of contextual influences that rely on using specific fixed locations (e.g., residential location, workplace)16,20. As the neglect of spatiotemporal variability in air pollution and human mobility could lead to substantial errors in individual exposure estimates21,22,23,24 as well as the evaluation of environmental justice25,26, it is essential to collect mobility-based high-resolution space-time data to understand the association between environmental exposures and health outcomes. A further challenge lies in the spatial mismatch between environmental datasets and individual-level biometric measures collected at the body-worn sensor. While street-view imagery enables fine-grained environmental characterization at the human visual scale, and satellite-derived vegetation indices (e.g., NDVI) offer broader coverage at coarser resolutions (10–250 m), both require explicit spatial alignment strategies that link mobility trajectories to environmental exposures at the exact locations where physiological and behavioural data are recorded. Addressing this scale incongruity requires explicit spatial alignment strategies that link mobility trajectories to environmental exposures at the exact locations where physiological and behavioural data are recorded.
In response to the challenges posed by the MAUP and UGCoP, researchers across multiple disciplines related to environmental health have increasingly taken part in studies on behavioural processes between environmental exposures and health outcomes, by moving toward individual-level mobility-based frameworks1,27,28,29. With increased interest in the environment-mobility-health (E-M-H) nexus, existing literature has predominantly concentrated either on the antecedent (environment-mobility) domain17,30,31,32or the consequent (mobility-health) domain33,34,35, while integrative studies encompassing all three domains remain limited. Nevertheless, individuals’ daily activities and travel have significantly shaped the dose-response effects of environmental exposures on health outcomes. Where, when and how individuals project, schedule and conduct their activities over 24-h period is closely associated with their exposures to environmental risks and the consequent health outcomes17,18,36. Moreover, another critical gap lies in the fact that few studies provide an actionable analytical framework linking real-time monitoring and longitudinal tracking of health outcomes, limiting the ability to generate robust and actionable evidence for treatment and interventions. This being said, addressing these gaps not only improves the accuracy of environment-health assessments but also uncovers the mediating role of daily activities and travel and underlying behavioural processes in the complex E-M-H nexus37, thereby providing a strong rationale for personalized, mobility-informed treatment and interventions aimed at mitigating exposure risks and promoting health outcomes.
The rise of mobile and wearable technologies38,39, particularly mobile health (mHealth) devices40,41,42 and portable environmental sensors43,44,45, has enabled new approaches to synchronously monitoring individuals’ behaviour, environmental exposures and physiological metrics. Through integration with smartphone applications, participants can document their health status, medical histories (e.g., respiratory and cardiovascular diseases), subjective physiological experience and environmental risk perception, enabling more precise and personalized risk evaluation and warning via machine learning-based or rule-based approaches. Here, I introduce the Real-World Multimodal Mobile Monitoring of Behaviour, Respiration, and Exposures (air pollution, noise, light, heat, greenness, etc.) for Treatment and Health Evaluation (M3-BREATHE). The end-to-end protocol provides comprehensive guidance on hardware setup, software configuration, data acquisition procedures, and analytical workflows required for deploying the M3-BREATHE. This protocol is suitable for researchers in environmental health, transport geography and personalized medicine conducting controlled clinical experiments (short-term, high-fidelity monitoring) or real-world longitudinal studies (long-term, non-obtrusive monitoring), but not recommended for studies requiring ultra-high-precision laboratory-level respiratory measurement (e.g., invasive pulmonary function testing).
Protocol
The conduct of this protocol for research purposes, either in controlled clinical experiments or in real-world contexts, should be undertaken with prior approval and in accordance with the guidelines of the researchers’ institutional human research ethics committee. Informed consent must be obtained from the participant prior to the beginning of the survey. The empirical investigation for this article follows the guidelines of Peking University’s Human Research Ethics Committee. All participant-based research using this protocol must obtain prior ethical approval from the investigator’s institutional research ethics committee. All participants must provide written informed consent prior to any data collection procedures. Recommended equipment settings are listed in the Table of Materials.
1. Wearable mobile health devices setup
- Chest-worn respiratory sensor setup
- Instruct the participant to put on the sensor-integrated shirt or the chest strap directly against their skin, beneath their clothing, to ensure optimal skin contact for electrophysiological signal acquisition.
- Adjust the shirt or strap fit so that it is snug and comfortable, ensuring that it does not constrain natural breathing or movement. Proper fit is confirmed when the sensor maintains stable contact with the skin and does not slip or shift noticeably during deep inhalation.
- Ensure the sensor is fully charged and successfully paired with the smartphone via Bluetooth to facilitate real-time monitoring and recording of respiratory rate (in breaths per minute, breaths/min), tidal volume (in milliliters, mL), and heart rate (in beats per minute, BPM). Confirm that the device clock is synchronized with the smartphone’s system time to enable accurate temporal alignment across multimodal data streams.
NOTE: Respiratory rate and heart rate can also be derived using wearable wristband devices, particularly for long-term monitoring (see step 1.2). Respiratory rate is indirectly calculated based on respiratory-induced variations in photoplethysmography (PPG) or heart rate variability (HRV) signals (see step 5.2). This alternative approach can help reduce participant discomfort and burden associated with prolonged use of a chest-worn respiratory sensor.
- Smart wristband device setup
- Choose the non-dominant wrist as the primary site for device placement, and secure the wristband firmly on the wrist, proximal to the ulnar styloid process.
- Adjust the strap to ensure optimal photoplethysmography (PPG) sensor-skin contact without impairing peripheral circulation. The fit is correct when the strap is snug but allows for the insertion of one fingertip.
- Open the companion application on the smartphone and ensure the device is successfully connected via Bluetooth.
- Navigate to the real-time display within the app, and confirm that the application settings are configured for continuous monitoring of all desired parameters, including: cardiovascular metrics such as heart rate (HR, units: beats per minute, BPM), heart rate variability (HRV, units: milliseconds, ms), blood pressure (BP, units: millimeters of mercury, mmHg), and electrocardiogram (ECG, units: millivolts, mV); respiratory and metabolic measures such as algorithmically estimated respiratory rate (RR, units: breaths per minute, breaths/min), blood oxygen saturation (SpO₂, units: percentage, %), and metabolic equivalents (METs, ratio); peripheral skin temperature (units: degrees Celsius, °C); motion data from the accelerometer (ACC, units: gravitational acceleration, g).
NOTE: The PPG sensor on the back of the device must maintain constant and flush contact with the skin. Re-tighten the strap if it gets loose over time.
2. Environmental sensors setup
- Connect the environmental sensing devices to the portable power bank (10,000 mAh capacity) using appropriate USB cables to secure 24-h operation. Ensure all connections are stable and cables are neatly stowed to prevent accidental disconnection during movement.
- Place the multi-air-pollutant monitor (measuring particulate matter PM2.5 and PM10 in µg/m3, carbon monoxide CO in ppm, nitrogen dioxide NO2, sulfur dioxide SO₂ and volatile organic compounds VOCs in ppb), noise sensor (in decibels, dB) and temperature sensor (in degrees Celsius, °C) in the fishnet side pocket of the participant’s backpack. Attach the light exposure tracker (illuminance, in lux, lx; Circadian Light A, CLA, 0-1) firmly to the front-facing side of the backpack’s shoulder strap, positioning it to face forward/outward without obstruction.
- Instruct the participant to carry the backpack along with their daily activities and travel for 24 h, and to charge the power bank every night. Provide a contact number for any issues.
- Confirm all sensors are powered on and have successfully established a real-time data stream, logging and transmitting data to the companion smartphone application.
NOTE: All sensors should be calibrated strictly according to their respective manufacturers’ specifications before being handed to the participants. Low-cost air pollution sensors are recommended to undergo a collocation calibration test against a research-grade reference instrument for a period of two weeks at a representative site to derive sensor-specific correction factors. The collocation procedure involves placing the low-cost sensor adjacent to the reference instrument (within 1 m, at the same height), operating both simultaneously for at least 14 days to capture a range of environmental conditions. Paired data are then used to derive linear or non-linear correction models (e.g.,Ccorrected = (Craw - b)/a) via regression analysis. For sensors without access to reference instruments, zero calibration using HEPA-filtered clean air is recommended to correct baseline drift. A 10–15 min stabilization period under clean air conditions is required before recording baseline values. Prior to each deployment, a pre-deployment verification check should be performed to confirm sensor responsiveness and data transmission stability. During data collection, daily quality assurance (QA) logs should be maintained to document any anomalies, sensor drift, or connectivity interruptions. Temperature and relative humidity sensors (RH, units: percentage, %) are usually integrated as components in the air pollution sensing devices. Continuous noise exposure can alternatively be measured using the smartphone’s built-in microphone via the dedicated application. Light exposure and heat exposure collected using the smart wristband and mobile phone are not recommended, due to high susceptibility to obstruction and confounding factors such as clothing and placement. For a longitudinal study or practice, an integrated modular device with a small size for multi-pollutant monitoring is recommended.
3. Smartphone application configuration
- Install the M3-BREATHE mobile application (custom-developed for Android/iOS) on the participant’s smartphone.
- Enable GPS, Bluetooth, and background data synchronization.
- Configure the app to record GPS location data at 1-min intervals and sync sensor data every 5 min.
- Set the data sampling rate to 1 Hz (i.e., one sample per second) for each connected device (wearable physiological monitors and portable environmental sensors) to ensure high-temporal-resolution data capture.
- Confirm that all settings are saved before initiating data recording.
NOTE: It is good practice to perform a brief (e.g., 5-min) test recording after configuration. Review the test data file to confirm that all expected data streams (GPS coordinates, HRV, ECG, air pollution, noise, etc.) are logged, correctly time-stamped and contain plausible values before commencing the full study period. It is worth noting that greenness exposure is indirectly measured by integrating high-spatiotemporal-resolution GPS trajectory data with geographic datasets such as OpenStreetMap or satellite-derived vegetation indices (e.g., NDVI for vegetation cover). To address the spatial scale mismatch between coarse-resolution environmental layers (e.g., NDVI at 10–250 m) and individual-level biometric measures, the protocol assigns environmental exposure values to each GPS point based on nearest-neighbour or buffer-averaged extraction methods, ensuring spatial alignment at the location and time of each physiological measurement.
4. Data Acquisition Procedures
- Participant onboarding
- Recruit participants using a stratified sampling method to ensure representativeness of the target population.
- Provide participants with comprehensive guidance materials, including a detailed instruction sheet, a manual and preferably an instructional video, on the procedures for wearing and using the sensors as well as operating the accompanying smartphone application.
- Conduct a baseline health survey within the app to collect demographic data (e.g., gender, age, height, weight, marital status), medical history (e.g., non-communicable diseases, NCDs), respiratory health status (e.g., smoking pack-years, chronic cough or dyspnea), and other self-reported health information (e.g., general physical and mental health, alcohol consumption, dietary patterns, physical activity levels, sleep quality).
NOTE: Recommending standardized instruments for self-reported health information collection, including the 12-Item Short Form Survey (SF-12) for general health46, the Alcohol Use Disorders Identification Test-Consumption (AUDIT-C)47, the International Physical Activity Questionnaire-Short Form (IPAQ-SF)48, and the Pittsburgh Sleep Quality Index (PSQI)49. Alternatively, 7-item Likert scales can be applied for convenience purposes.
- Daily Monitoring Routine
- Instruct the participant to wear the mobile-health physiological sensors and carry the portable environmental monitoring devices (backpack with a fishnet pocket) for a continuous 24-h period. During sleep, the environmental sensors should be positioned in the bedroom to maintain exposure assessment, with particular attention to the light sensor.
- Remind the participant to recharge the power bank each evening and keep it connected to the environmental sensors to maintain uninterrupted operation and data.
- The data stream will be monitored either through manual checks by the research team every 4 h, or preferably, by an automated alert from the backend system within the application, triggered after 30 min of data sync interruption. In case of disconnection for over 30 min, the participant will be contacted to address the issue.
- Encourage the participant to complete an activity-travel diary survey within the application (a template is provided in Table 1) each day in the evening, to enhance the accuracy of daily activity and mobility contextualization for the sake of more effective and targeted treatment and intervention. An automated reminder (application/SMS) is sent each evening at 8 p.m. to promote consistent compliance.
NOTE: An interactive interface, featuring a map for trajectory (with timestamps) visualization, can be deployed with machine learning-based identification of activities and trips based on GPS data. Ideally, advice or reminders can be sent automatically through the application to the participant to record an activity or a trip, proximate to the occurrence of the next activity/trip episode, to mitigate end-of-day recall bias. A final review before bedtime is recommended to consolidate the daily record. In addition, ecological momentary assessment (EMA) can be utilised to capture subjective experiences (e.g., breathlessness, fatigue, environmental pollution perceptions) three times per day (e.g., 8 a.m., 12 p.m., and 4 p.m.) via push notifications.
- Data Synchronization and Backup
- All collected real-time and activity-travel diary data are automatically synced to a secure, encrypted cloud server via Wi-Fi or cellular network. The cloud database is configured with regular automated backups to prevent data loss.
- All data is first stored on the smartphone's internal memory. Synced data is automatically cleared from the device every day after successful verification by the cloud server.
- All data are anonymized at the point of collection and safely stored on institutional servers. The storage, transmission and disposal of the data are managed in strict accordance with the data security and privacy policies of the host institution.
The summary of data and the source are provided in Table 2.
| ParticipantID | Date | StartTime | EndTime | Activity(A)/Trip(T) | Activity Type/Trip Mode |
| 1 | 13/08/2025 | 0:00 | 7:00 | A | Sleep |
| 1 | 13/08/2025 | 7:00 | 7:30 | A | Breakfast |
| 1 | 13/08/2025 | 7:30 | 8:00 | T | public transport |
| 1 | 13/08/2025 | 8:00 | 11:30 | A | Work |
| 1 | 13/08/2025 | 11:30 | 11:45 | T | Walk |
| 1 | 13/08/2025 | 11:45 | 12:45 | A | Lunch |
| 1 | 13/08/2025 | 12:45 | 13:00 | T | Walk |
| 1 | 13/08/2025 | 13:00 | 17:00 | A | Work |
| 1 | 13/08/2025 | 17:00 | 17:15 | T | Bicycle |
| 1 | 13/08/2025 | 17:15 | 18:00 | A | Cooking |
| 1 | 13/08/2025 | 18:00 | 19:00 | A | Supper |
| 1 | 13/08/2025 | 19:00 | 21:00 | A | Leisure |
| 1 | 13/08/2025 | 21:00 | 21:30 | A | Bath |
| 1 | 13/08/2025 | 21:30 | 23:59 | A | Sleep |
| 1 | 14/08/2025 | 0:00 | 6:30 | A | Sleep |
| 1 | 14/08/2025 | … | … | … | … |
Table 1: Activity-travel diary template for M3-BREATHE monitoring. The table illustrates how behavioral data are recorded and organized for integration with exposure and health analyses.
| Wearable mobile health devices | Smart phone application | Portable environmental sensors |
| Respiratory Rate (RR) | GPS coordinates | Particulate Matter (PM2.5, PM10) |
| Tidal Volume (TV) | Activity-travel diary | Carbon Monoxide (CO) |
| Heart Rate (HR) | Ecological momentary assessment (EMA) | Nitrogen Dioxide (NO2) |
| Heart Rate Variability (HRV) | Baseline health information | Sulfur Dioxide (SO₂) |
| Electrocardiogram (ECG) | Age, gender, etc. | Volatile Organic Compounds (VOCs) |
| Blood Pressure (BP) | Body Mass Index (BMI) | Noise (N) |
| Blood Oxygen Saturation (SpO₂) | Socioeconomic status (SES) | Temperature (T) |
| Metabolic Equivalents (METs) | Medical history | Relative Humidity (RH) |
| Skin Temperature (ST) | Respiratory health status | Illuminance (lx) |
| Accelerometer (ACC) | Self-reported health information | Circadian Light A (CLA) |
Table 2: Summary of data and the source of devices. The table lists key metrics (e.g., heart rate, respiratory rate, particulate matter, temperature) and their corresponding measurement modalities.
5. Data Processing and Analysis
- Device calibration and quality assurance
Prior to deployment, all devices will undergo basic calibration checks according to manufacturer specifications. For environmental sensors (e.g., PM2.5 monitors), this may include zero calibration or comparison against reference instruments when available. During data processing, quality assurance and quality control (QA/QC) procedures will be applied to both environmental and biometric data streams. All QA/QC steps will be documented to ensure transparency and reproducibility.- Range checks to remove physiologically or physically implausible values (e.g., extreme heart rate or pollutant concentrations).
- Detection and exclusion of signal artifacts (e.g., motion-related noise in wearable data). Smoothing or filtering procedures (e.g., moving averages) where appropriate.
- Identification and handling of missing or sparse data segments.
- Preprocessing
- Raw sensor data are cleaned (GPS drift is corrected through the Kalman filter) and synchronised with activity-travel diaries using the Multimodal Temporal Alignment approach via Python-based preprocessing packages (e.g., Pandas, GeoPandas, Tsfresh, Pyo3). All processed data are subsequently integrated into the M3-BREATHE database.
- To ensure temporal alignment between environmental exposures and biometric measurements, synchronize all data streams to a unified timestamp framework. Standardize device clocks prior to deployment using network-based time protocols. During data processing, align timestamps from different devices to a common reference time (e.g., UTC), and correct clock drift using linear interpolation or time-offset adjustment.
- Aggregate higher-frequency data (e.g., wearable-derived heart rate) to match the resolution of environmental measures or adjust environmental data to match higher-frequency data, depending on the analysis objective. Handle missing timestamps or irregular sampling intervals by applying interpolation or excluding data based on predefined quality criteria.
- Process GPS data alongside external geographical datasets characterizing the built and natural environments to contextualize individual exposures. Compute greenness exposure by integrating GPS records with OpenStreetMap data and satellite-derived vegetation indices (e.g., NDVI). Address scale disparities between high-frequency GPS trajectories and lower-resolution satellite-based environmental layers by applying nearest-neighbour or buffer-based spatial alignment methods.
- For each GPS fix, assign the corresponding environmental exposure value from the intersecting or nearest pixel, or calculate a weighted average of pixels within a defined buffer radius (e.g., 10 m, 30 m) that reflects typical GPS spatial uncertainty. Ensure that environmental exposures are attributed at a spatiotemporal resolution compatible with the simultaneously collected physiological and behavioural data.
- Feature Extraction
- Summarize environmental and mobile health monitoring data using key metrics, including measures of central tendency (mean, median, weighted mean), extreme values (maximum, minimum, percentiles), variability (standard deviation, variance, coefficient of variation, interquartile range), and temporal patterns (peak frequency, duration above threshold, rate of change, diurnal, weekly, or seasonal variation).
- Calculate cumulative air pollutant exposure using total exposure metrics (average concentration and inhaled dose) and the area under the curve (AUC). Compute the inhaled pollutant dose (D) over an exposure duration (t) using the relation below.

with minute ventilation defined as:

where C is the pollutant concentration in the inhaled air (µg/m3, ppb or ppm, depending on unit convention); is the minute ventilation, i.e., the total volume of air inhaled per minute (L/min); RR is the respiratory rate (breaths/min); VT is the tidal volume, the volume of air inhaled per breath (L/breath); and t is the exposure duration (min).
Note that the dose D is calculated in µg, provided that is converted to m3/min (i.e., divide by 1000) to maintain unit consistency. - Given that chest-worn respiratory sensors are usually expensive and burdensome to wear continuously for extended periods in real-world contexts, compared with monitoring durations of several hours to a few days in controlled clinical experiments, assess respiratory rate using accelerometer and gyroscope data obtained from the smart wristband by applying machine learning algorithms50,51. To improve the accuracy of the assessment, a random forest model usually acts as a filter, rejecting data that result in an inaccurate respiratory rate reading, after which a Convolutional Neural Network (CNN) model can be used to extract the respiratory rate52,53.
- Extract behavioural features from GPS data, smartphone-based travel-activity diaries, and motion data from wristband accelerometers. Generate a set of individual behavioural indicators to analyze associations among environmental exposure, behaviour, and health outcomes. Table 3 summarizes multi-scale profiles across the behavioural, environmental exposure, and health domains.
NOTE: Arrows illustrate the sequential alignment of profiles across behaviour, environmental exposure and health domains.
- Data Analysis
- Descriptive and exploratory analyses
- Conduct initial descriptive statistics to characterize the distribution, central tendency, and variability of all variables.
- Perform correlation analysis and variance inflation factor (VIF) tests.
- Visualize exposure and health data using time-series, boxplots, and geospatial heatmaps.
- Acute associations and temporal lags
- Use distributed lag models (DLMs).
- Bin exposure data into time blocks.
- Conduct sensitivity analyses.
- Apply time-series methods (ARIMA, VAR).
- Chronic associations and cumulative exposures
- Aggregate exposure metrics.
- Link exposure to repeated health assessments.
- Use mixed-effects regression models.
- Apply longitudinal or survival analysis.
NOTE: It is necessary to consider time-window strategies. Table 4 compares different time-window options.
- Behavioural mediation and moderation analyses
- Explore mediation using SEM or causal analysis.
- Examine moderation effects.
- Exposure-response functions and dose-response curves
- Quantify exposure-response relationships.
- Estimate inhaled dose-response functions.
- Investigate non-linear associations.
- Longitudinal and life-course analyses
- Evaluate chronic effects.
- Explore life-course trajectories.
- Personalized treatment and intervention
- Construct personalized profiles.
- Identify high-risk episodes.
- Recommend medical evaluations.
- Population health intelligence
- Generate exposure maps.
- Analyze behavioural trends.
- Assess health inequalities.
- Use machine learning models.
- Descriptive and exploratory analyses
| Behavioural Domain | Environmental Exposure Domain | Health Domain |
| Transient/momentary features | Instantaneous exposure profiles | Short-term health profiles |
| Accelerometer vector magnitude | Real-time exposure | Cardiorespiratory stress responses |
| Instantaneous activity intensity | Acute exposure | Acute changes in HR, BP, HRV, SpO₂,etc. |
| Episode-level/bout-level features | Episode-level exposure profiles | ECG arrhythmic events |
| Start time, end time, duration | Average pollutant concentration | Respiratory symptoms and function |
| Activity type | Cumulative pollutant exposure dose | Episode-specific ventilation rate fluctuations |
| Location type | Peak exposure | Self-reported coughing and shortness of breath |
| Indoor/outdoor | Percentile-based exposure | Psychological and wellbeing states |
| Transport mode | Exposure variability | EMA mood, stress, fatigue, etc. |
| Trip distance | Above-threshold exposure duration | Episode-level cognitive and affective strain |
| Trip average speed | AUC exposure | Acute exposure burdens |
| Trip purpose | Indoor vs. outdoor exposure | Medium-term health profiles |
| Physical activity intensity | Transport microenvironment exposure | Subclinical cardiovascular markers |
| Respiratory pattern | Workplace/home/recreational exposure | Sustained increases in resting HR or BP |
| Inter-segment and daily-level features | Daily-level exposure profiles | Early hypertension risk scores |
| Sedentary breaks and transitions between activity states | Daily mean exposure | Respiratory health trends |
| Transitions between indoor and outdoor environments | Daily cumulative exposure dose | Frequency of respiratory symptom episodes |
| Transitions between transport microenvironments | Daily peak exposure | Decline in lung function (RR, SpO₂, etc.) |
| Activity–trip chains | Frequency/duration of daily peaks | Metabolic and physical activity status |
| Activity/tour complexity | Daily minimum exposure | Cumulative MET-min/week |
| Activity-travel Chain | Daily percentile exposure | Activity intensity distribution |
| Time-use structure | Daily above-threshold exposure duration | Sleep and recovery health |
| Activity space, radius of gyration, spatial entropy | Daily AUC exposure | Fatigue persistence beyond daily variation |
| Overall travel direction | Daily exposure variability | Mental health and wellbeing |
| Time in Moderate-to-Vigorous Physical Activity (MVPA) | Daily exposure slope (rate of change) | Stress reactivity, anxiety scores, etc. |
| Circadian rhythm | Daily peak-to-mean ratio | Cumulative exposure risks |
| Habitual routine patterns | Longitudinal exposure profiles | Average pollutant concentration and dose |
| Routine daily activity-travel patterns | Long-term mean exposure | Long-term health profiles |
| Variability in daily activity-travel patterns | Long-term cumulative exposure dose | Cardiovascular disease risk and progression |
| Chronotype of circadian rhythm | Peak exposure | Respiratory and pulmonary outcomes |
| Weekend/weekday discrepancies in circadian rhythm | Frequency/duration of peak events | Metabolic and obesity-related outcomes |
| Regularity of Mobility (trajectory, commute, mode, etc.) | Percentile-based exposure | Mental health outcomes |
| Long-term trends in physical activity | Time above threshold | Systemic health and biological aging |
| Sedentary and active behavior cycles | AUC exposure | Functional and quality-of-life outcomes |
| Dietary timing and regularity | Daily/weekly/monthly/seasonal variability | Life-course health trajectories |
| Adaptive behavior under environmental extremes | Exposure time-series mining | Population health intelligence |
Table 3: Multiscale data profiles of M3-BREATHE. The table highlights how behavioural metrics relate to short-, medium-, and long-term health outcomes.
| Window | Use-Case | Modeling Approach | Pros | Cons |
| 1 hour | Very acute effects | Include 1-h moving average as covariate in LME or time-series; or use DLNM with hourly lags | Captures immediate peaks; minimal dilution | High noise; needs high-res data; limited chronic insight |
| 24 hours | Daily (short-term) | 24-h moving avg in mixed model; DLNM or DLM with 1-day lags | Reduces noise; aligns with regulatory metrics | May smooth out peak events |
| 7 days | Weekly (sub-acute) | 7-day avg covariate; DLM with lags up to 7 days | Captures accumulated short-term exposure | Blurs daily variability; moderate smoothing |
| 30 days | Monthly (medium-term) | 30-day avg; DLNM with monthly lag structure | Reflects recent exposure load; smoother | Misses day-to-day spikes; assumes linear cumulation |
| 90 days | Seasonal (long-term) | 90-day avg or distributed lag across ~90d | Captures seasonal trend | Over-smoothes; confounds with seasonal factors |
| 365 days | Annual (long-term) | 1-year avg in LME or Cox model | Useful for chronic risk; controls for season | Ignores acute variation; confounded by aging trends |
Table 4: Time-window strategies and analytical approaches. Summary of time-window strategies and corresponding analytical approaches used to assess environmental exposures across different temporal scales, highlighting their applicability, strengths, and limitations.
Results
The following representative results are drawn from a pilot study that integrated portable air pollution sensors, activity–travel diaries and episode-level self-reported subjective wellbeing (SWB). Participants were required to carry portable air pollution sensors during their daily activities and travel for a continuous 48-h period (either Friday–Saturday or Sunday–Monday) and to complete accompanying activity-travel diaries. Data from a total of 112 valid participants, from December 2017 to February 2018, in the Meiheyuan residential community, Beijing, were included in the analysis. This preliminary analysis focuses on the interrelations among PM2.5 exposure (environmental domain), daily activities (behavioural domain), and cognitive SWB (health domain). While this pilot does not yet validate the full M3-BREATHE pipeline, particularly the integration of physiological signals (e.g., HRV, respiratory rate) and real-time exposure alerts, it serves as an illustrative example of the analytical approach. Full end-to-end validation of the complete multimodal system is needed for future work.
To validate the end-to-end M3-BREATHE pipeline, we assessed data integrity (99.3% GPS data capture rate and 93.2% air pollution monitor capture rate), synchronization accuracy (≤1 s time asynchrony between multimodal data), and calibration validity (PM2.5 measurements from low-cost sensors had a Pearson correlation of r=0.86 with research-grade reference instruments after collocation calibration). The pipeline integrated GPS trajectory data, environmental exposure data, and self-reported diary data, enabling the identification of activity-specific exposure patterns and exposure-health associations. These results confirm the reproducibility and reliability of the M3-BREATHE protocol for real-world E-M-H monitoring.
Figure 1 represents the average PM2.5 exposure concentration (blue bars, left axis) and cognitive SWB scores (orange line, right axis) across a range of daily activities and travel. The results show that PM2.5 exposure concentrations differed markedly by activity types. The highest average exposure was observed during sleep, indicating high-level air pollution concentration indoors at home. This may be because the study area is a comparatively highly polluted area compared with other parts of Beijing. Other activities with consistently high exposure concentrations included surfing the Internet, entertainment, studying, and taking a walk, all of which exceeded 20 µg/m3. Mid-range exposure concentrations were found for activities such as work, physical activity, caregiving and trips (15–20 µg/m3). The lowest exposures were recorded during personal affairs, seeing a doctor, dining and personal care (5–15 µg/m3). These differences, based on this pilot study, reflect the specific environmental contexts in which activities take place (indoor vs. outdoor and sedentary vs. active). In contrast, cognitive SWB scores showed less variability across activities, ranging narrowly between 1.7 and 2.3 (on a 1–5 dissatisfaction scale). The lowest satisfaction scores were associated with seeing a doctor and trips, followed by personal affairs and work, while the highest satisfaction scores were linked to physical activity, entertainment and social activity, which are often intrinsically rewarding activities.
It is found that the activity types associated with higher PM2.5 exposure concentrations did not always correspond to lower cognitive SWB, suggesting decoupling patterns between PM2.5 exposure and self-reported cognitive SWB. For instance, physical activity and entertainment combined with elevated exposure and high cognitive SWB scores. This may reflect that the health risk of PM2.5 exposure may be overlooked or not consciously linked to cognitive SWB, probably due to the invisible nature of PM2.5, which makes it even more insidious and difficult to detect in the environment. By comparison, pollutants like SO2, NOx and O3 have more readily detectable characteristics. For instance, SO2 has a distinctive sulfuric odor and NOx is often associated with visible emissions from industrial processes and vehicle exhaust. These gaseous pollutants can cause immediate irritation to the eyes, throat, and respiratory system, making them easier to detect and respond to without the need for specialized equipment. However, PM2.5 is the most dangerous pollutant because it can penetrate into the gas exchange regions of the lung (alveolus), and very small particles may pass through the lungs to affect other organs and hence do harm to the circulatory system59. This finding highlights the unique challenge posed by PM2.5, whose imperceptible nature and severe health impacts make it a critical but often underestimated environmental risk across various daily activities.
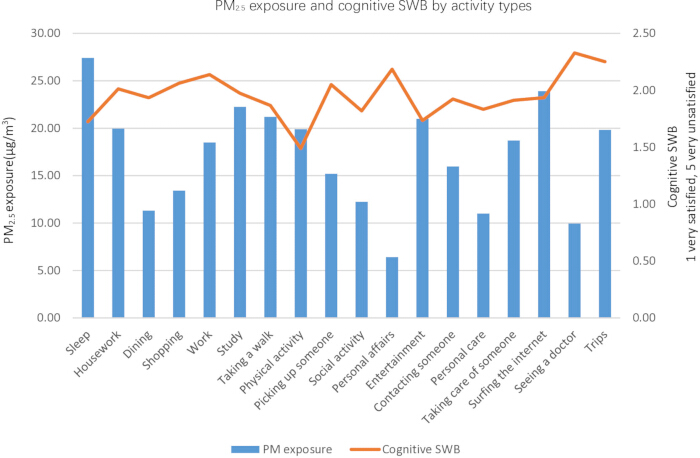
Figure 1: PM2.5 exposure concentration and cognitive subjective well-being (SWB) by daily activity type. Cognitive subjective well-being (SWB) is measured on a Likert scale ranging from 1 (very satisfied) to 5 (very unsatisfied). The figure illustrates variations in fine particulate matter (PM2.5, µg/m3) exposure levels and corresponding well-being scores across activities. Data points represent observed values. Please click here to view a larger version of this figure.
To examine the relationship between air pollution exposure and subjective well-being (SWB), this pilot study employs a Generalized Additive Model (GAM), allowing for flexible nonlinear effects. Both contemporaneous air pollution exposure (AAP) and lagged exposure from the previous activity (AAP_1) are modeled using smooth functions, while socio-demographic characteristics (gender, age, hukou, education, marital status, and income) are included as control variables. The results show that neither AAP nor AAP_1 has a statistically significant effect on SWB, with p-values of 0.234 and 0.266, respectively. Although the estimated smooth terms suggest some nonlinear patterns, these effects are not robust (Figure 2). In contrast, certain individual characteristics exhibit stronger associations with SWB.
These findings suggest that short-term air pollution exposure, whether contemporaneous or lagged by one activity episode, does not significantly influence SWB. One possible explanation is that individuals may not immediately respond to short-term fluctuations in air quality, or that such effects require longer or cumulative exposure to become detectable. Future research could extend this analysis by incorporating multiple lag structures (e.g., exposures from several preceding activity episodes), using time-based measures (e.g., minute-level exposure duration), or applying alternative modeling approaches such as distributed lag models or machine learning methods to better capture dynamic and cumulative effects of air pollution on well-being.
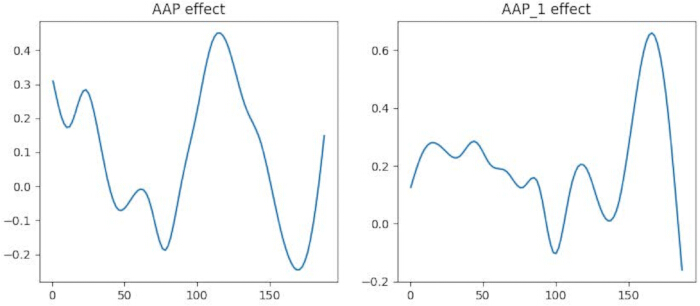
Figure 2: Nonlinear effects of current and lagged air pollution exposure on subjective well-being. The curves represent model-derived effect estimates over time, highlighting short-term fluctuations and delayed responses. AAP denotes contemporaneous exposure, while AAP₁ represents exposure lagged by one time unit (e.g., 1 day). Please click here to view a larger version of this figure.
Discussion
A critical step in deploying the M3-BREATHE protocol is the reliable setup and synchronisation of multimodal devices, as data integrity depends heavily on stable connections between wearable sensors, portable environmental monitors and the smartphone application. It is also essential to ensure all the sensors are calibrated in accordance with the manufacturers’ specifications before initiating the survey. Ideally, the portable environmental devices, particularly the air pollution monitor, should be collocated and calibrated against research-grade reference instruments prior to deployment, to ensure the validity and accuracy of the measurements for research purposes.
In controlled clinical experiments or short-term, small-scale surveys, the use of a chest-worn respiratory strap provides high-fidelity respiratory parameters (respiratory rate, tidal volume, ECG), offering greater accuracy than wrist-based sensors and serving as a triangulation basis for validating their algorithmic estimates. In contrast, for longitudinal monitoring in naturalistic environments, including voluntary consumer use, the combination of a smart wristband and smartphone application is preferable, as these devices are less obtrusive and promote sustained participant compliance. For studies with limited resources or participant burden concerns, a minimum kit consisting of a smart wristband, smartphone application, and a single pollutant monitor is recommended. Additional sensors (e.g., chest-worn respiratory strap, dedicated light tracker) should be considered based on specific research objectives and budget. Detailed recommendations for the adaptation of the M3-BREATHE protocol in controlled clinical experiments and real-world longitudinal study/practice are provided in Table 5.
| Data Domain | Metric (Abbreviation) | Controlled clinical experiment | Real-world longitudinal study/practice | |||||
| Chest-worn Sensor | Smart Wristband | Portable Environmental Monitor | Smartphone app | Smart Wristband | Portable Environmental Monitor | Smartphone app | ||
| Physiological | Heart Rate (HR) | ΟΟΟ | ΟΟ | ΟΟΟ | ||||
| Heart Rate Variability (HRV) | ΟΟΟ | ΟΟ | ΟΟΟ | |||||
| Respiratory Rate (RR) | ΟΟΟ | Ο | ΟΟΟ | |||||
| Tidal Volume (TV) | ΟΟ | Ο | ΟΟ | |||||
| Electrocardiogram (ECG) | ΟΟΟ | ΟΟ | ΟΟΟ | |||||
| Blood Pressure (BP) | ΟΟΟ | ΟΟ | ||||||
| Blood Oxygen Saturation (SpO₂) | ΟΟΟ | ΟΟ | ||||||
| Metabolic Equivalents (METs) | ΟΟΟ | ΟΟ | ||||||
| Skin Temperature (ST) | ΟΟ | Ο | ||||||
| Accelerometer (ACC) | ΟΟ | ΟΟΟ | ||||||
| Environmental | Particulate Matter (PM2.5, PM10) | ΟΟΟ | ΟΟΟ | |||||
| Carbon Monoxide (CO) | ΟΟΟ | ΟΟ | ||||||
| Nitrogen Dioxide (NO2) | ΟΟΟ | ΟΟ | ||||||
| Sulfur Dioxide (SO₂) | ΟΟ | Ο | ||||||
| Volatile Organic Compounds (VOCs) | ΟΟ | ΟΟ | ||||||
| Noise (N) | ΟΟΟ | Ο | Ο | ΟΟ | ||||
| Temperature (T) | ΟΟΟ | ΟΟ | ||||||
| Relative Humidity (RH) | ΟΟ | Ο | ||||||
| Light Exposure (illuminance) | ΟΟΟ | ΟΟ | ||||||
| Light Exposure (Circadian Light A) | ΟΟ | Ο | ||||||
| Greenness | ΟΟΟ | Ο | ||||||
| Behavioral & Contextual | GPS Location / Trajectory | ΟΟΟ | ΟΟΟ | |||||
| Activity-Travel Diary (ATD) | ΟΟΟ | Ο | ||||||
| Ecological Momentary Assessment (EMA) | ΟΟ | Ο | ||||||
| Baseline Characteristics (BC) | ΟΟΟ | ΟΟΟ | ||||||
| Notes: ΟΟΟ, minimum kit; ΟΟ, standard kit; Ο, alternative | ||||||||
Table 5: Recommendations for the adaptation of the M3-BREATHE protocol. Summary of measurement domains and instrumentation levels across study settings (ΟΟΟ minimum; ΟΟ standard; Ο alternative).
Several modifications and troubleshooting strategies are required when applying this protocol in different settings. First, in case of a disconnection between the monitoring devices and the smartphone or periods over 30 min with null or invalid data (e.g., health parameter data loss due to sensor malfunction or lack of skin contact), automated reports to investigators should be generated so that participants can be contacted promptly to resolve the issue. Investigators can also conduct regular data integrity checks. Second, for longitudinal deployments of the protocol, device adherence and battery management may present greater challenges. Participants may occasionally forget to wear the smart wristband, recharge power banks or fill in the activity-travel diaries. Automated in-app reminders, backend monitoring, and daily diary prompts are effective mitigation tools.
Despite its advantages, M3-BREATHE has several limitations. While smart chest straps yield precise respiratory measurements, they are generally impractical for long-term real-world monitoring due to participant burde60. Wristband-based measurements and algorithms for respiration assessment are therefore recommended, though they have reduced accuracy for estimating tidal volume or detecting subtle arrhythmias, and their performance can be affected by motion artefacts61. In addition, the utilisation of multiple environmental monitoring devices increases the possibility of potential connectivity failures, non-synchronous clocks or sensor malfunctions. An integrated modular device for multi-pollutant monitoring or alternative approaches (e.g., smartphone-based noise monitoring) should be developed, with the objective of maintaining measurement accuracy while minimizing device size and maximizing portability62. Moreover, reliance on in-app self-reported systems (e.g., activity-travel diaries, medical records) may introduce recall bias and increase long-term compliance burdens63. Machine learning-based identification of activities and trips can be adopted64, while tracking medical treatment records from healthcare providers can be seamlessly connected to the smartphone application via a simple one-click interface.
This visionary real-world M3-BREATHE establishes a scalable, non-invasive, and cost-efficient platform for longitudinal environmental-mobility-health (E-M-H) nexus research and practice, advancing existing approaches. Traditional spatial epidemiology often relies on fixed-site monitoring or residential proxies for exposure assessment, making it vulnerable to the modifiable areal unit problem (MAUP) and the uncertain geographic context problem (UGCoP)21,65. By integrating multimodal high space-time resolution behavioural, physiological and environmental exposure data, this system moves toward frame-independent individualised exposure assessments, facilitating the unpacking of the behavioural “black box” in the environmental–health relationship66,67. It supports both individual and population-based in-depth interpretation of dose–response dynamics, linking real-time multi-pollutant exposures to physiological reactivity and health outcomes, enabling personalized treatment and intervention, public health surveillance and translational research linking environmental exposure, daily activities and mobility and health outcomes68, as well as facilitating individuals’ health self-management and risk mitigation for environmental exposures69 (e.g., daily activity planner in avoiding high-risk exposure based personal historical E-M-H profiles).
Future applications of M3-BREATHE include (1) integration with AI-driven real-time intervention systems, where personalized exposure alerts trigger adaptive behaviour recommendations (e.g., commuting rerouting during peak PM2.5 exposure); (2) deployment in vulnerable populations (e.g., older adults, asthmatics) to assess disease-specific exposure-health associations and support precision medicine; (3) combination with genomic data to uncover gene-environment interactions in chronic disease development; (4) miniaturization of integrated modular environmental sensors to reduce participant burden and improve long-term adherence; (5) cross-city and cross-country scaling to generate global E-M-H datasets for comparative environmental health research. In addition, the protocol can be adapted for monitoring other environmental risks by replacing relevant portable sensors.
Disclosures
The author declares no competing interests.
Materials
| Name | Company | Catalog Number | Comments |
|---|---|---|---|
| AirBeam | HabitatMap | AirBeam-3 | PM1, PM2.5, PM10, temperature, humidity |
| AirVisual Pro | IQAir | Pro | AQI, PM2.5, CO2, temperature, humidity. |
| Atmotube Pro | Atmotube | Pro | PM1, PM2.5, PM10,TVOC, temperature, humidity, barometric pressure |
| BioNomadix BioShirt | BioPac | BN-BIOSHIRT-Fx | Wireless smart shirt with built-in fabric electrodes and respiration sensors, able to record ECG and breathing signals. |
| Extech SL355 Personal Noise Dosimeter | Extech | SL355 | logs SPL, Leq, Peak, etc. |
| Fitbit Sense | Fitbit | 2 | Heart rate, ECG, SpO2, stress levels, sleep, GPS |
| FITVII GT5 Pro Max | FITVII | https://fitvii.com/products/gt5-pro-charger | Heart rate, Blood pressure, ECG, blood glucose, SpO2, sleep, sports modes |
| GAOTek Compact Personal Noise Dosimeter | GAO Tek | ASLM-341 | logs SPL, Leq, Peak, etc. |
| Go Direct Respiration Belt | Vernier | GDX-RB | Chest strap respiration monitor using strain or expansion sensors to detect thoracic expansion or contraction |
| Hexoskin Smart Shirt | Hexoskin | N/A | Smart garment with embedded textile sensors for continuous monitoring of respiratory rate, heart rate, ventilation, activity, sleep, etc |
| Huawei Band | Huawei | 9 | Heart rate, SpO2, sleep stages, respiratory rate, arrhythmia detection |
| Inkbird Air Quality Monitor | Inkbird | N/A | PM2.5, PM10, HCHO, TVOC, CO, CO2,temperature, humidity |
| La Roche-Posay My Skin Track UV | La Roche-Posay | My Skin Track UV | clipped to clothing; measures UVA and UVB; solar-powered |
| Miniaturized Light Dosimeter | Wearifi | BLE Light Dosimeter | up to 8 channels of spectral dosimetry (e.g. UV → IR), measures cumulative light dose; good for long-term exposure tracking. |
| Moto Watch 120 | Motorola | https://www.phonearena.com/news/motorola-moto-watch-120-us-release-price-specs-features-official_id161375 | Heart rate, sleep, SpO2, stress, 100+ sports modes |
| Personal Noise Dosimeter SV-104A | Svantek | SV 104A | logs SPL, Leq, TWA, Peak, etc. |
| Prana Air Pocket PM2.5 Monitor | PranaAir | N/A | PM1, PM2.5, PM10, AQI |
| Smart Health Wristband | VIYIWOK | https://www.ebay.com/itm/306538996133 | Heart rate, sleep, stress, sports modes |
| Smart Watch Fitness Tracker | TYKOIT | https://www.tykoit.com/product/senior-friendly-smart-watch-no-phone-app-needed | Heart rate, SpO2, sleep, steps, calories |
| SunSprite Personal Light Tracker | GoodLux Technology | SunSprite | clipped to clothing; measures visible light and UV; solar-powered |
| Temtop Air Station | Elitech | P1,M2000 | PM2.5, PM10, AQI, temperature, humidity, and weather |
| Xiaomi Smart Band | Xiaomi | 9 | Heart rate, SpO2, sleep stages, stress levels |
References
- Zhang, Y., Kwan, M. P. Considering human mobility is essential for accurate environmental exposure assessment. Sci. Bull. , (2025).
- Zinsstag, J., et al. Advancing one human-animal-environment health for global health security: what does the evidence say. Lancet. 401 (10376), 591-604 (2023).
- Le, H. T., Poom, A. Advancing environmental exposure and health impact assessment research with travel behaviour studies. Transp. Rev. 44 (4), 733-742 (2024).
- Tian, Y., Chen, C., Sagoe-Crentsil, K., Zhang, J., Duan, W. Intelligent robotic systems for structural health monitoring: Applications and future trends. Autom. Constr. 139, 104273(2022).
- Wong, D. W. The modifiable areal unit problem (MAUP). WorldMinds: Geographical Perspectives on 100 Problems: Commemorating the 100th Anniversary of the Association of American Geographers 1904-2004. , Springer Netherlands. Dordrecht. 571-575 (2004).
- Parenteau, M. P., Sawada, M. C. The modifiable areal unit problem (MAUP) in the relationship between exposure to NO₂ and respiratory health. Int. J. Health Geogr. 10 (1), 58(2011).
- Jelinski, D. E., Wu, J. The modifiable areal unit problem and implications for landscape ecology. Landsc. Ecol. 11 (3), 129-140 (1996).
- Cai, G., Hao, Y. Guiding geospatial analysis processes in dealing with modifiable areal unit problems. 13th Int. Conf. on Geographic Information Science (GIScience 2025), , Schloss Dagstuhl-Leibniz-Zentrum für Informatik. 14-1 (2025).
- Goodchild, M. F. Geographical information science. Int. J. Geogr. Inf. Syst. 6 (1), 31-45 (1992).
- Kwan, M. P., Schwanen, T. Geographies of mobility. Ann. Am. Assoc. Geogr. 106 (2), 243-256 (2016).
- Hayward, P. M. The modifiable areal unit problem (MAUP) and health disparities. , University of Connecticut. PhD thesis (2009).
- Tobler, W. R. Frame independent spatial analysis. Accuracy of Spatial Databases. , 115-122 (1989).
- Wong, D. Aggregation effects in geo-referenced data. Practical Handbook of Spatial Statistics. , CRC Press. 83-106 (2020).
- Kwan, M. P. From place-based to people-based exposure measures. Soc. Sci. Med. 69 (9), 1311-1313 (2009).
- Fang, T. B., Lu, Y. Personal real-time air pollution exposure assessment methods promoted by information technological advances. Ann. GIS. 18 (4), 279-288 (2012).
- Kwan, M. P. The limits of the neighborhood effect: contextual uncertainties in geographic, environmental health, and social science research. Ann. Am. Assoc. Geogr. 108 (6), 1482-1490 (2018).
- Liu, Y., Kwan, M. P., Yu, C. The uncertain geographic context problem (UGCoP) in measuring people’s exposure to green space using the integrated 3S approach. Urban For. Urban Green. 85, 127972(2023).
- Kwan, M. P. The uncertain geographic context problem. Ann. Assoc. Am. Geogr. 102 (5), 958-968 (2012).
- Fusco, G., Caglioni, M., Emsellem, K., Merad, M., Moreno, D., Voiron-Canicio, C. Questions of uncertainty in geography. Environ. Plan. A. 49 (10), 2261-2280 (2017).
- Kwan, M. P., Neutens, T. Space-time research in GIScience. Int. J. Geogr. Inf. Sci. 28 (5), 851-854 (2014).
- Park, Y. M., Kwan, M. P. Individual exposure estimates may be erroneous when spatiotemporal variability of air pollution and human mobility are ignored. Health Place. 43, 85-94 (2017).
- Ma, J., Tao, Y., Kwan, M. P., Chai, Y. Assessing mobility-based real-time air pollution exposure in space and time using smart sensors and GPS trajectories in Beijing. Smart Spaces and Places. , Routledge. 102-116 (2021).
- Thomas, D., Stram, D., Dwyer, J. Exposure measurement error: influence on exposure-disease relationships and methods of correction. Annu. Rev. Public Health. 14 (1), 69-93 (1993).
- Wu, Y., et al. Methods to account for uncertainties in exposure assessment in studies of environmental exposures. Environ. Health. 18 (1), 31(2019).
- Racz, L., Rish, W. Exposure monitoring toward environmental justice. Integr. Environ. Assess. Manag. 18 (4), 858-862 (2021).
- Vandenberg, L. N., et al. Addressing systemic problems with exposure assessments to protect the public’s health. Environ. Health. 21 (Suppl 1), 121(2023).
- Wei, L., et al. Validity of mobility-based exposure assessment of air pollution: A comparative analysis with home-based exposure assessment. Environ. Sci. Technol. 58 (24), 10685-10695 (2024).
- Schmitz, O., et al. A computational framework for agent-based assessment of multiple environmental exposures. J. Expo. Sci. Environ. Epidemiol. , 1-13 (2025).
- Tian, W., Cao, K., Feng, Q. The impact of environmental exposure on the health of older adults: A review from the GIScience perspective. Trans. GIS. 29 (3), e70056(2025).
- Reck, D. J., Martin, H., Axhausen, K. W. Mode choice, substitution patterns and environmental impacts of shared and personal micro-mobility. Transp. Res. D Transp. Environ. 102, 103134(2022).
- Brottrager, M., Crespo Cuaresma, J., Kniveton, D., Ali, S. H. Natural resources modulate the nexus between environmental shocks and human mobility. Nat. Commun. 14 (1), 1393(2023).
- Guo, W., He, J., Yang, W. Association between outdoor jogging behavior and PM₂.₅ exposure: Evidence from massive GPS trajectory data in Beijing. Sci. Total Environ. 947, 174759(2024).
- Cyriac, J., et al. Improvements in diet and physical activity–related psychosocial factors among African Americans using a mobile health lifestyle intervention to promote cardiovascular health: The FAITH! App pilot study. JMIR Mhealth Uhealth. 9 (11), e28024(2021).
- Rafiq, R., McNally, M. G., Uddin, Y. S., Ahmed, T. Impact of working from home on activity-travel behavior during the COVID-19 Pandemic: An aggregate structural analysis. Transp. Res. A Policy Pract. 159, 35-54 (2022).
- Farnham, A., et al. Travel behaviours and health outcomes during travel: profiling destination-specific risks in a prospective mHealth cohort of Swiss travellers. Travel Med. Infect. Dis. 47, 102294(2022).
- Fanning, J., Brooks, A. K., Irby, M. B., N’Dah, K. W., Rejeski, W. J. Associations between patterns of daily stepping behavior, health-related quality of life, and pain symptoms among older adults with chronic pain: A secondary analysis of two randomized controlled trials. Clin. Interv. Aging. , 459-470 (2024).
- Guo, W., Schwanen, T., Brand, C., Chai, Y. The associations of real-time and perceived air pollution exposure with episode-level subjective wellbeing: A case study of a suburban community in Beijing. Health and Place. 94, 103477(2025).
- Abernethy, A., et al. The promise of digital health: then, now, and the future. NAM Perspect. 2022, 10-31478 (2022).
- Kickbusch, I., et al. The Lancet and Financial Times Commission on governing health futures 2030: growing up in a digital world. Lancet. 398 (10312), 1727-1776 (2021).
- Poongodi, M., Sharma, A., Hamdi, M., Maode, M., Chilamkurti, N. Smart healthcare in smart cities: Wireless patient monitoring system using IoT. J. Supercomput. 77 (11), (2021).
- Steinhubl, S. R., Muse, E. D., Topol, E. J. The emerging field of mobile health. Sci. Transl. Med. 7 (283), 283rv3(2015).
- Almotiri, S. H., Khan, M. A., Alghamdi, M. A. Mobile health (m-health) system in the context of IoT. 2016 IEEE 4th International Conference on Future Internet of Things and Cloud Workshops (FiCloudW), , 39-42 (2016).
- Tiele, A., Esfahani, S., Covington, J. Design and development of a low-cost, portable monitoring device for indoor environment quality. J. Sens. 2018 (1), 5353816(2018).
- van Duijnhoven, J., et al. Measuring light exposure in daily life: A review of wearable light loggers. Build. Environ. , 112771(2025).
- Fischer, T., Schraivogel, S., Caversaccio, M., Wimmer, W. Are smartwatches a suitable tool to monitor noise exposure for public health awareness and otoprotection. Front. Neurol. 13, 856219(2022).
- Haddad, C., Sacre, H., Obeid, S., Salameh, P., Hallit, S. Validation of the Arabic version of the “12-item short-form health survey” (SF-12) in a sample of Lebanese adults. Arch. Public Health. 79 (1), 56(2021).
- Wade, D., Varker, T., Forbes, D., O'Donnell, M. The Alcohol Use Disorders Identification Test-Consumption (AUDIT-C) in the assessment of alcohol use disorders among acute injury patients. Alcohol. Clin. Exp. Res. 38 (1), 294-299 (2014).
- Lee, P. H., Macfarlane, D. J., Lam, T. H., Stewart, S. M. Validity of the international physical activity questionnaire short form (IPAQ-SF): A systematic review. Int. J. Behav. Nutr. Phys. Act. 8 (1), 115(2011).
- Farrahi Moghaddam, J., Nakhaee, N., Sheibani, V., Garrusi, B., Amirkafi, A. Reliability and validity of the Persian version of the Pittsburgh Sleep Quality Index (PSQI-P). Sleep Breath. 16 (1), 79-82 (2012).
- Liaqat, D., et al. WearBreathing: Real world respiratory rate monitoring using smartwatches. Proc. ACM Interact. Mob. Wearable Ubiquitous Technol. 3 (2), 1-22 (2019).
- Takahashi, Y., et al. Accuracy of heart rate and respiratory rate measurements using two types of wearable devices. Prog. Rehabil. Med. 7, 20220016(2022).
- Hernandez, J., McDuff, D., Picard, R. W. Biowatch: estimation of heart and breathing rates from wrist motions. 2015 9th International Conference on Pervasive Computing Technologies for Healthcare (PervasiveHealth), , 169-176 (2015).
- Natarajan, A., Su, H. W., Heneghan, C., Blunt, L., O’Connor, C., et al. Measurement of respiratory rate using wearable devices and applications to COVID-19 detection. NPJ Digit. Med. 4 (1), 136(2021).
- Guo, W., Schwanen, T., Brand, C., Chai, Y. The associations of real-time and perceived air pollution exposure with episode-level subjective wellbeing: A case study of a suburban community in Beijing. Health Place. 94, 103477(2025).
- Yu, M., et al. Developing high-resolution PM2.5 exposure models by integrating low-cost sensors, automated machine learning, and big human mobility data. Front. Environ. Sci. 11, 1223160(2023).
- Xia, C., Yeh, A. G. Mobility as a response to environmental hazards in the urban context: A new perspective on mobility and inequality. Travel Behav. Soc. 27, 192-203 (2022).
- Guo, W., Chai, Y., Kwan, M. P. Travel-related exposure to air pollution and its socio-environmental inequalities: Evidence from a week-long GPS-based travel diary dataset. Spatiotemporal Analysis of Air Pollution and Its Application in Public Healt. , 293-309 (2020).
- Dritsas, E., Trigka, M. Efficient data-driven machine learning models for cardiovascular diseases risk prediction. Sensors. 23 (3), 1161(2023).
- Amini, H. WHO air quality guidelines need to be adopted. Int. J. Public Health. 66, 1604483(2021).
- Vitazkova, D., et al. Advances in respiratory monitoring: a comprehensive review of wearable and remote technologies. Biosensors. 14 (2), 90(2024).
- Mayorga-Vega, D., Casado-Robles, C., López-Fernández, I., Viciana, J. Activity wristband-based physical activity recommendations in young people. Sci. Sports. 37 (4), 303-315 (2022).
- Fanti, G., et al. Features and practicability of the next-generation sensors and monitors for exposure assessment to airborne pollutants: a systematic review. Sensors. 21 (13), 4513(2021).
- Möller, A., Kranz, M., Schmid, B., Roalter, L., Diewald, S. Investigating self-reporting behavior in long-term studies. Proc. SIGCHI Conf. Hum. Factors Comput. Syst, , 2931-2940 (2013).
- Koushik, A. N., Manoj, M., Nezamuddin, N. Machine learning applications in activity-travel behaviour research: a review. Transp. Rev. 40 (3), 288-311 (2020).
- Li, J., et al. Five-year lung cancer mortality risk analysis and topography in Xuan Wei: a spatiotemporal correlation analysis. BMC Public Health. 19 (1), 173(2019).
- Le, H. T., Poom, A. Advancing environmental exposure and health impact assessment research with travel behaviour studies. Transp. Rev. 44 (4), 733-742 (2024).
- Guo, W., Schwanen, T., Brand, C., Chai, Y. Exploring the complex relationships between air pollution, life satisfaction and mental health through the lens of daily activity-travel patterns: The case of a suburban residential community in Beijing. J. Transp. Geogr. 127, 104300(2025).
- Kaufman, J. D., Curl, C. L. Environmental health sciences in a translational research framework: more than benches and bedsides. Environ. Health Perspect. 127 (4), 045001(2019).
- Peerbolte, T. F., et al. Conversational agents supporting self-management in people with a chronic disease: systematic review. J. Med. Internet Res. 27, e72309(2025).
Reprints and Permissions
