This protocol describes an automated, flow-based photochemical research platform that enables high throughput, reproducibility, and low sample consumption. The system integrates programmable LED irradiation, in-line UV-Vis spectroscopy, and a Python-based analysis framework with a graphical user interface to measure quantum yields, absorption profiles, and photoisomerization kinetics of molecular photoswitches.
Method Article
Photoisomerization and Kinetic Characterization of Molecular Photoswitches Using a Semi-Automated Experimental System
In This Article
Summary
Abstract
Molecular photoswitches occur widely in nature, where they play key roles in vision, and are increasingly utilized in emerging technologies. Their development, however, is often limited by the labor-intensive characterization of photochemical properties. This work presents an automated flow-based platform for efficient and reproducible photochemical characterization of molecular photoswitches. To accurately measure photoisomerization quantum yields, absorption profiles, and thermal back-conversion kinetics, the setup combines in-line UV-Vis spectroscopy with a programmable LED array. The automated fluid handling, temperature control, and real-time light flux calibration lead to improved reproducibility, reduced sample consumption, and minimal manual intervention compared to traditional methods. Large datasets are processed by a Python-based analytical framework that allows the extraction of kinetic and thermodynamic parameters from a variety of photoswitch classes. The platform is validated through testing known photoswitch systems, including azobenzene, and derivatives of bicyclooctadiene and norbornadiene, showing good agreement with literature values. By combining controlled irradiation, thermal relaxation studies, and automated data processing, this methodology provides a scalable framework for accelerating the discovery and characterization of functional molecular photoswitches.
Introduction
Molecular photoswitches occur broadly in nature, where they are integral to the visual systems of many organisms1, and they have also found applications in a wide range of established and emerging technologies, including photo-responsive eyewear2, switchable windows3, sensing devices4, energy storage materials5, light-controlled therapies6, smart polymers7, molecular solar thermal systems8, optical data storage9, and molecular machines10. Despite their considerable potential, the development of new photoswitch systems is often constrained by the demanding and time-consuming nature of accurately characterizing their photochemical behavior11. Since these systems undergo reversible transitions, it is crucial to precisely evaluate key photochemical and photophysical properties to determine their suitability for such applications, including the absorbance spectrum, thermal back-conversion kinetics, and the photoisomerization quantum yield12.
Conventional techniques for acquiring these characteristics rely on manual, batch-based measurements that are too low-throughput to keep pace with the increasing diversity of recently synthesized photoswitches, require large sample volumes, and are subject to user variability13.
The methods presented here offer an affordable, automated, flow-based photochemical characterization system intended for repeatable and efficient investigations of molecular photoswitches to overcome these limitations. The technology combines in-line UV-Vis spectroscopy for real-time isomer population monitoring in microfluidic settings, with a programmable LED array for regulated irradiation at different wavelengths of light14. To ensure accurate and repeatable datasets, automated fluid handling, temperature control, and light flux calibration minimize experimental variability while reducing sample volume and manual intervention. Large amounts of data are processed via an analytical Python-based framework to extract kinetic and thermodynamic parameters.
Benchmark systems such as azobenzene, derivatives of bicyclooctadiene, and norbornadiene have been used to validate the approach; the findings demonstrate good agreement with values found in the literature15 This methodology provides a streamlined approach for systematically evaluating photoswitch performance and accelerating the discovery of new functional systems by combining precise light delivery, automated data collection, and simplified analysis16.
The automated characterization platform combines fluidic, thermal, and optical components in a flow-based system (Figure 1)17. Using fiber optics and a collimating lens, light from an LED array and a deuterium-halogen lamp is directed into a UV-Vis flow cuvette housed in a temperature-controlled holder. A focusing lens collects the transmitted light and directs it toward a spectrometer. An electronically controlled selection valve connects to a low-pulsation peristaltic pump that circulates sample solutions, enabling quick switching between samples and solvents for automated cleaning and sequential measurements. A specialized graphical user interface (GUI) provided in Supplementary File 1 manages all actions. To record a reference spectrum, the workflow begins with filling the flow cuvette with solvent. After adding the selected sample, the GUI sets the irradiation wavelength, LED power, and acquisition interval. The program displays real-time spectral and kinetic data while automatically switching between LED activation and spectral acquisition during the run. When the absorbance threshold or target time is reached, the measurement sequence is automatically terminated. The device then flushes the tube with either the next sample or approximately 200 µL of solvent. The solvent channel cleans the flow path after each measurement. The internal Python script is used to store all the data for further kinetic and thermodynamic analysis.
Numerous initial parameters need to be specified by the user to ensure reproducibility and clarity in reporting automated photoswitch characterization experiments. Many of the initial parameters, such as sample concentration, LED wavelength and power, measurement wavelength, and temperature, can vary significantly depending on the chemical and photophysical properties of the photoswitch under study. As each molecule responds differently to light and solvent conditions, users must determine the most appropriate settings for their specific compound. To ensure accurate and reproducible measurements, the optimal sample concentration can be estimated from the absorption spectrum, aiming to maintain linearity within the Beer-Lambert regime, e.g. absorbance in the range of 0.5 to 1.0. Table 1 makes it clear which parameters the user controls.
Protocol
1. Sample preparation
- Preparation of Norbornadiene 1 (NBD1)
- Synthesize 2-cyano-3-(3,4-dimethoxyphenyl)norbornadiene according to literature18. Dissolve 1.2 mg in 100 mL of acetonitrile (4.74 x 10⁻⁴ M). Transfer the solution to a 20 mL vial with a membrane cap.
- Preparation of Bicyclooctadiene (BOD)
- Synthesize ethyl-3-(2-methoxyphenyl)bicyclo[2.2.2]octa-2,5-diene-2-carboxylate according to literature19. Dissolve 9.5 mg in 100 mL of acetonitrile (3.5 x 10⁻⁴ M).
- Mix 5 mL of this solution with 5 mL of acetonitrile to obtain 1.75 x 10⁻⁴ M. Transfer to a 20 mL vial with a membrane cap.
- Preparation of Azobenzene
- Use commercial azobenzene (97+%). Dissolve 8 mg in 100 mL of acetonitrile (4.39 x 10⁻⁴ M).
- Dilute 1 mL of this solution with 9 mL of acetonitrile to obtain 4.39 x 10⁻⁵ M. Transfer to a 20 mL vial with a membrane cap.
- Preparation of NBD2
- Synthesize 3-(4,4,5,5-tetramethyl-1,3,2-dioxaborolan-2-yl)quinoline20 and 3-bromo-2-cyanonorbornadiene21 following reported procedures. Synthesize NBD2 by adding bromo-2-cyanonorbornadiene (90 mg, 0.46 mmol) and Na2CO3 (389 mg, 3.67 mmol) to a flask with water (5 mL) and dimethoxyethane (5 mL) and degas by nitrogen bubbling for 1 hour. Add Pd(PPh3)4 (27 mg, 0.02 mmol) under a flow of nitrogen and stir the resulting suspension at 60 °C for 48 hours. Cool the mixture to RT, add water (10 mL) and extract the product with DCM (3 × 50 mL). Dry the combined organics over MgSO4, filter, and purify the crude by flash column chromatography (hexane: ethyl acetate, gradient to 60:40) to give the product as a pale yellow solid (15 mg, 13%).
1H NMR (400 MHz, CD2Cl2) δ 9.27 (1 H, d, j = 2.3 Hz, H9), 8.44 (1 H, d, j = 2.3 Hz, H16), 8.10 (1 H, d, j = 8.5 Hz, H11), 7.93 (1 H, dd, j = 8.4, 1.4 Hz, H14), 7.78 (1 H, ddd, j = 8.5, 6.9, 1.5 Hz, H12), 7.61 (1 H, ddd, j = 8.2, 6.9, 1.2 Hz, H13), 6.99 (2 H, m, H1 and H2), 4.30 (1 H, m, H6), 4.02 (1 H, m, H3), 2.37 (1 H, dt, j = 7.0, 1.7 Hz, H7a), 2.28 (1 H, dt, j = 7.0, 1.6 Hz, H7b); 13C NMR (101 MHz, CD2Cl2) δ 167.6, 148.2, 148.0, 143.1, 140.3, 133.1, 130.6, 129.3, 128.6, 127.4, 127.3, 126.4, 119.5, 117.8, 71.6, 55.4, 54.2. The NMR spectra of NBD2 and QC2 are given in Figure 13. - Use NBD2. Dissolve 1.9 mg of NBD2 in 17 mL of toluene (4.57 x 10⁻⁴ M)
- Dilute 1 mL of this solution with 8.4 mL of toluene to obtain 5.44 x 10⁻⁵ M. Transfer to a 20 mL vial with a membrane cap.
- Synthesize 3-(4,4,5,5-tetramethyl-1,3,2-dioxaborolan-2-yl)quinoline20 and 3-bromo-2-cyanonorbornadiene21 following reported procedures. Synthesize NBD2 by adding bromo-2-cyanonorbornadiene (90 mg, 0.46 mmol) and Na2CO3 (389 mg, 3.67 mmol) to a flask with water (5 mL) and dimethoxyethane (5 mL) and degas by nitrogen bubbling for 1 hour. Add Pd(PPh3)4 (27 mg, 0.02 mmol) under a flow of nitrogen and stir the resulting suspension at 60 °C for 48 hours. Cool the mixture to RT, add water (10 mL) and extract the product with DCM (3 × 50 mL). Dry the combined organics over MgSO4, filter, and purify the crude by flash column chromatography (hexane: ethyl acetate, gradient to 60:40) to give the product as a pale yellow solid (15 mg, 13%).
- Loading of samples and solvents
- Place sample vials into the selection valve. Place solvent vials in designated positions if alternative solvents are required.
2. LED photon flux determination
- Preparation of the power meter setup
- Launch the photonflux calculator program (Supplementary File 2). Connect the photodiode power sensor to the PM100USB power and energy meter interface. Ensure the USB interface is properly connected to the computer for data transfer and logging.
- Positioning the power sensor
- Place the photodiode power sensor inside the cuvette holder, aligned with the optical path of the LED light source. Ensure that the cuvette is positioned between the LED light source and the power sensor.
NOTE: Rationale for sensor placement - By placing the sensor after the cuvette, only the photons passing through the sample chamber are measured. This approach excludes photons that would not enter the cuvette due to the smaller window size compared to the LED irradiation beam. It also accounts for photon loss caused by reflection at the quartz cuvette walls.
- Place the photodiode power sensor inside the cuvette holder, aligned with the optical path of the LED light source. Ensure that the cuvette is positioned between the LED light source and the power sensor.
- Recording photon flux measurements
- Switch on the LED light source and allow it to stabilize if necessary. Acquire power readings from the PM100USB interface using the manufacturer’s software. Save the measured power values for further analysis in the photonflux calibration table (Supplementary File 3).
3. Automation system setup
- Configuring the flow cuvette
- Place the UV-Vis flow cuvette into a temperature-controlled holder (all of the measurements were performed at room temperature). Connect the deuterium-halogen lamp and LED array to one side via fiber optics. The small cuvette window (2 x 4 mm) requires precise alignment.
- Connect the spectrometer to the other side via fiber optics. Position a collimating lens between the lamp and the cuvette; position a focusing lens between the cuvette and the spectrometer.
- Setting up the flow control
- Connect the sample through a precision peristaltic pump. Insert a selection valve upstream to switch between the sample and the solvent. Add 0.1 mm metal shims alongside the cuvette to secure alignment.
4. System initialization
- Acquisition of reference spectrum
- Launch the in-house GUI quantum yield experiment program (Supplementary File 4). Pump solvent at a rate of 1 mL/min through the valve, pump, and flow cuvette. Acquire a reference spectrum using the deuterium lamp (UV-Vis range) for baseline correction.
5. Experimental workflow
- Sample introduction
- Switch the valve from solvent to sample in the GUI. Start the pump using a flow rate of 1 mL/min to fill the flow cuvette with the sample. Rapid solvent switching is enabled via the selection valve.
NOTE: The chosen sample used throughout this demonstration is NBD1. - From the list of available LEDs, select the 340 nm UV LED and set the operating current to 600 mA in the GUI. Set UV-Vis measurement intervals to 1 s (a measurement will be taken every second to obtain more data points).
- Switch the valve from solvent to sample in the GUI. Start the pump using a flow rate of 1 mL/min to fill the flow cuvette with the sample. Rapid solvent switching is enabled via the selection valve.
- Automated measurement
- Start the measurement sequence. The instrument will record full UV-Vis spectra (absorbance vs. wavelength) at each measurement step (by automatically switching the LED on/off between measurements and opening and closing the lamp shutter for spectrum acquisition). From those spectra, the software picks one or more specific wavelengths that you choose in the field above the absorption spectra (since NBD1 absorbs at 340 nm, type 340 nm). For those selected wavelengths, it then tracks how the signal changes over time as the measurement sequence runs. A time-dependent plot will be generated (time on the x-axis, absorbance on the y-axis).
NOTE: Repeat the quantum yield measurement 3 times to improve the accuracy of the final result. - Once the forward reaction is complete, set the temperature of the temperature-controlled holder to 60 °C. To do so, open TApp on the desktop, connect to COM8, go to Change Target to change the temperature, and press OK. Select Start back-conversion in the program. The metastable isomer (QC1) will thermally relax back to its parent molecule (NBD1).
NOTE: Repeat step 5.2.2 for 4 more temperatures: at 65 °C, 70 °C, 75 °C, and 80 °C. The back-conversion must be performed at a minimum of 3 different temperatures (with 5 temperatures providing a more accurate analysis) to obtain the Arrhenius and Eyring fits in the QYA.pyw program.
- Start the measurement sequence. The instrument will record full UV-Vis spectra (absorbance vs. wavelength) at each measurement step (by automatically switching the LED on/off between measurements and opening and closing the lamp shutter for spectrum acquisition). From those spectra, the software picks one or more specific wavelengths that you choose in the field above the absorption spectra (since NBD1 absorbs at 340 nm, type 340 nm). For those selected wavelengths, it then tracks how the signal changes over time as the measurement sequence runs. A time-dependent plot will be generated (time on the x-axis, absorbance on the y-axis).
- Termination of experiment
- Stop the experiment manually once the back-conversion is complete.
6. Post-experiment procedures
- Preparation for next measurement: Flush with at least three tubing volumes (~200 μL) of fresh sample.
- Final cleaning
- Switch the valve to solvent. Pump solvent through the system until the tubing and cuvette are clean.
7. Analysis of data
- Determine the quantum yield using the program in Supplementary File 4 and the half-life using the program in Supplementary File 5.
- Open QYA.pyw. Load the file saved from the QYEX.pyw, set the concentration to 4.1 x 10⁻⁵ M and select the 340 nm LED to load the correct photon flux for this particular experiment. In the hyperparameters section, set the zero-point wavelength equal to 500 nm, the analysis wavelength to 340 nm, and the number of points for fit to 10. Run the analysis and, if the slope follows a good fit, note the quantum yield calculated by the program. Quantum yields were determined by fitting the time-dependent absorbance change using a kinetic model that accounts for photon absorption and concentration changes during irradiation. From the corrections section, include the back reaction for the program to calculate the rate constants.
- Open HLA.pyw. Load the file saved from the QYEX.pyw and set the analysis wavelength to 340 nm. In the kinetics analysis chart, insert the rate constants calculated in the previous step for at least 5 different temperatures. Run the analysis. The program will generate the Arrhenius and Eyring fits.
Results
Benchmarking was performed using three representative photoswitches - 2-cyano-3-(3,4-dimethoxyphenyl)norbornadiene (NBD1)22, azobenzene23, and ethyl-3-(2-methoxyphenyl)bicyclo[2.2.2]octa-2,5-diene-2-carboxylate (BOD)19 comparing the data from the automated workflow with previously reported results. Control experiments show that continuous UV-lamp irradiation converts approximately 10% of NBD1 within 10 minutes (Figure 2)17. Under standard measurement conditions, each spectrum is recorded in less than 0.5 s, corresponding to <0.01% conversion, demonstrating that lamp exposure has a negligible effect on quantum yield measurements. Unlike conventional approaches that photoconvert samples externally and transfer them to a spectrometer, the automated setup confines small sample volumes within a thermostat-controlled, irradiated chamber, minimizing concentration fluctuations and ensuring accurate kinetic measurements. Thermal rate constants determined at five temperatures (60 °C, 65 °C, 70 °C, 75 °C, 80 °C) were used for Eyring analysis to extract ΔH‡ and ΔS‡ (Table 6).24
The used derivative of norbornadiene, 2-cyano-3-(3,4-dimethoxyphenyl)norbornadiene (Figure 3 a) was first reported in literature18 and is referred to here simply as NBD1. The absorbance spectrum of NBD1 shows minimal overlap with its quadricyclane (QC1) isomer (Figure 3 b)17, allowing simplification of equation (1) by neglecting photo-induced back-conversion (QC1 → NBD1). QC1 also exhibits a thermal half-life of approximately 30 days at room temperature, which is much slower than the photoisomerization timescale under the experimental conditions. Consequently, because the QC1 thermal half-life (27 days at 25 °C) is several orders of magnitude longer than the irradiation timescale (minutes), thermal back-conversion can be neglected (Figure 4)17. This results in a simplified model where only the forward reaction is considered, and assuming a monochromatic light source, the differential equation can be solved analytically to give the quantum yields (Table 2)17.
The bicyclooctadiene (BOD) derivative studied here (Figure 5), ethyl-3-(2-methoxyphenyl)bicyclo[2.2.2]octa-2,5-diene-2-carboxylate, has been previously reported in the literature19. The photoproduct absorbs outside the spectral region of the parent compound, simplifying measurement interpretation. When the photoproduct spectrum is unknown, it is often assumed at low conversion that it does not absorb, which accelerates data collection but may introduce an unknown error. Unlike the NBD–QC system, the shorter half-life of the photoisomer (TCO) leads to a very fast back-conversion at room temperature, requiring inclusion of both forward photo-isomerization and reverse thermal steps in the kinetic model. Because the rate equation cannot be solved analytically, numerical fitting is performed by minimizing residuals (Figure 6, Table 4)17, typically taking a few seconds on a standard computer, compared to sub-second fitting for analytical models neglecting thermal reversion. Thermal back-conversion was further measured at four temperatures to determine the half-life and thermodynamic parameters (Table 8). At 25 °C, the BOD half-life was measured to be 63 s, in good agreement with the previously reported 79.8 s. Eyring and Arrhenius analyses are shown in Figure 717.
Azobenzene has a long thermal half-life at room temperature (>6 days), allowing thermal back-conversion to be neglected. The cis-azobenzene photoproduct absorbs minimally in the region of the trans-isomer (ε340nm^trans ≈ 12,500 M⁻1 cm⁻1; ε340nm^cis ≈ 200 M⁻1 cm⁻1), minimizing spectral interference24. Since the molar absorptivity of the cis isomer at 340 nm is two orders of magnitude smaller than that of the trans isomer, its contribution to the absorbance signal is negligible at low conversion. At low conversion, photo-induced back-conversion has a negligible impact, permitting simplification of the kinetic model by excluding reverse photoisomerization and thermal terms (Figure 8, Table 5)17. While measuring the photostationary state would allow determination of both forward and backward quantum yields, this study focuses on the forward reaction. The measured thermal half-life of 6.78 days aligns well with the literature value of 7.34 days, and the corresponding Eyring and Arrhenius analyses are shown in Figure 917, with thermodynamic parameters summarized in Table 917.
In addition to benchmarking with established photoswitches, 2-cyano-3-(3-quinoline)norbornadiene (NBD2) was synthesized and studied using the automated setup (Figure 10). The photoconversion results presented in this manuscript are new, showcasing the capability of the system to characterize the photochemical behavior of novel compounds under controlled and reproducible irradiation conditions. The solvent used was toluene, and the concentration of the solution was 5.4 x 10⁻⁵ M. Using a 340 nm LED, an overall quantum yield of 11 % was obtained (Figure 11, Table 3). Since QC2 absorbs at the irradiation wavelength of 340 nm, both the parent compound and the photoproduct compete for the same photons, meaning the effective photon flux driving each species evolves during the reaction. To avoid systematic errors in the quantum yield, an optimized fit for this overlapping absorption between NBD2 and QC2 at the irradiation wavelength was formulated, explicitly including the product contribution. The corrected fit uses a kinetic model that accounts for changes in the concentrations of the parent compound and photoproduct during irradiation, while considering that both absorb at 340 nm. Application of the optimized fitting procedure resulted in a corrected overall quantum yield of 11.6 %.
Within this framework, the measured photon flux corresponds to the total incident photon flux entering the sample and is converted into the absorbed photon flux using the time-dependent total absorbance of the system. The Beer-Lambert law is used to determine the fraction of incident photons that are absorbed, after which the absorbed photon flux is divided between NBD2 and QC2 in proportion to their respective contributions to the total absorbance at each time point. Consequently, as the product forms, it captures an increasing fraction of the photons, progressively reducing the light available for further conversion of the parent compound.
Because the concentrations of NBD2 and QC2 change over time and directly affect how much light is absorbed, the system cannot be described with a simple analytical equation. Instead, the kinetic model is solved numerically. In practice, a trial value of the quantum yield is chosen, the reaction is simulated over time, and the resulting absorbance curve is compared to the experimental data. The quantum yield is then adjusted and the simulation repeated until the best match between calculated and measured absorbance is obtained. This corresponds to a global fit of the full absorbance-time dataset, rather than fitting individual points independently. To run this model, the molar absorptivity of QC2 at 340 nm must be known. This parameter is determined separately using the Beer-Lambert law, based on the absorbance measured after irradiation at 340 nm. Once determined, the molar absorptivity of QC2 is treated as a fixed input parameter and is not adjusted during the fitting procedure.
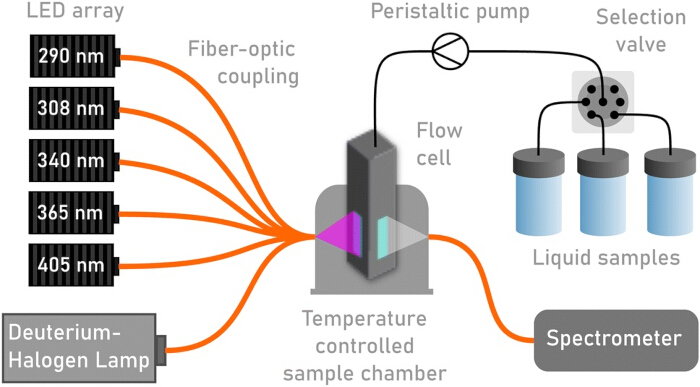
Figure 1: Schematic of the photoswitch characterization platform. The automated system is built upon a multi-component flow system. This figure is reproduced from reference 17 with permission from the Royal Society of Chemistry, under CC-BY open access license.17 Please click here to view a larger version of this figure.
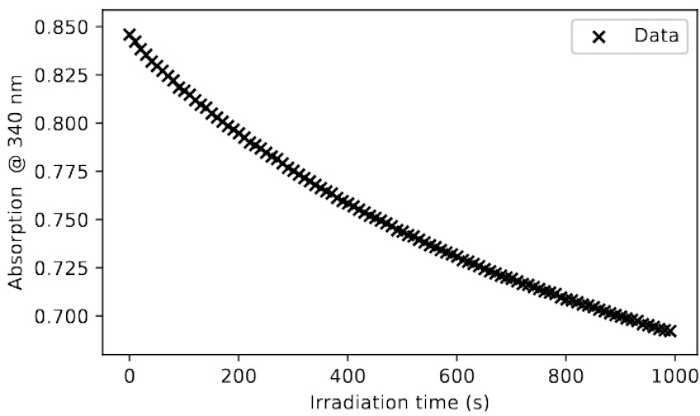
Figure 2: Effect of continuous UV-lamp exposure on norbornadiene (NBD1). After 10 min of irradiation, NBD undergoes ~10% conversion, whereas individual spectra recorded in <0.5 s result in negligible (<0.01%) conversion. This figure is reproduced from reference 17 with permission from the Royal Society of Chemistry, under CC-BY open access license.17 Please click here to view a larger version of this figure.
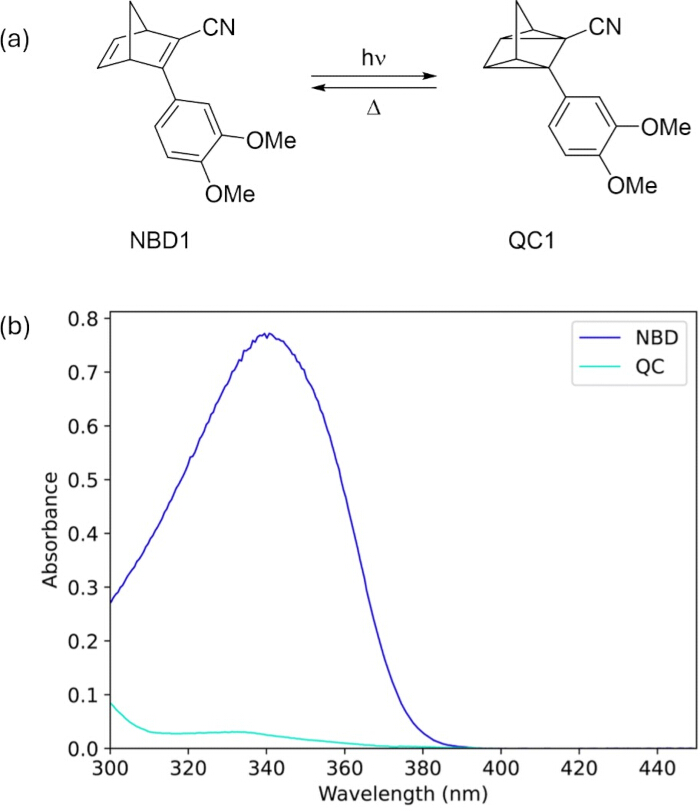
Figure 3: NBD1–QC1 photoswitching and UV–Vis spectra. a) Schematic representation of the norbornadiene–quadricyclane (NBD1–QC1) photoswitch system. b) UV-Vis absorption spectra of NBD1 and QC1. The figure shows the NBD1–QC1 photoswitch system, including a schematic of the light-induced NBD1-to-QC1 conversion and the corresponding UV–Vis spectra, highlighting the absorption changes between NBD1 and QC1. This figure is reproduced from reference 17 with permission from the Royal Society of Chemistry, under CC-BY open access license.17 Please click here to view a larger version of this figure.
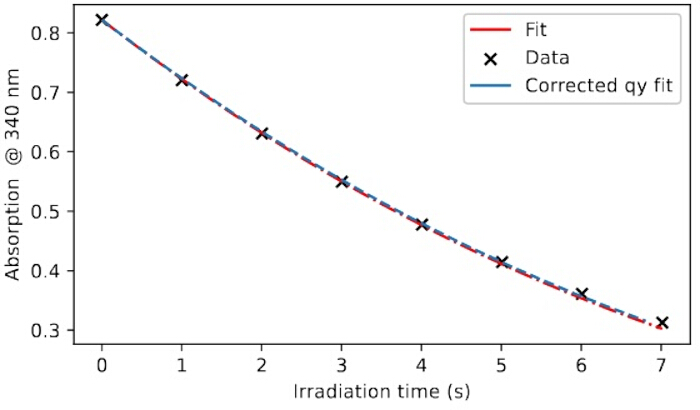
Figure 4: Illustration of the negligible contribution of thermal and photo-induced back-conversion for the NBD1–QC1 pair, due to minimal spectral overlap and a long QC half-life. Effect of including the thermal back-reaction on the quantum yield fit at 25 °C. Neglecting the thermal back-reaction gave a quantum yield of 67%, whereas accounting for it increased the value slightly to 68%. This figure is reproduced from reference 17 with permission from the Royal Society of Chemistry, under CC-BY open access license.17 Please click here to view a larger version of this figure.
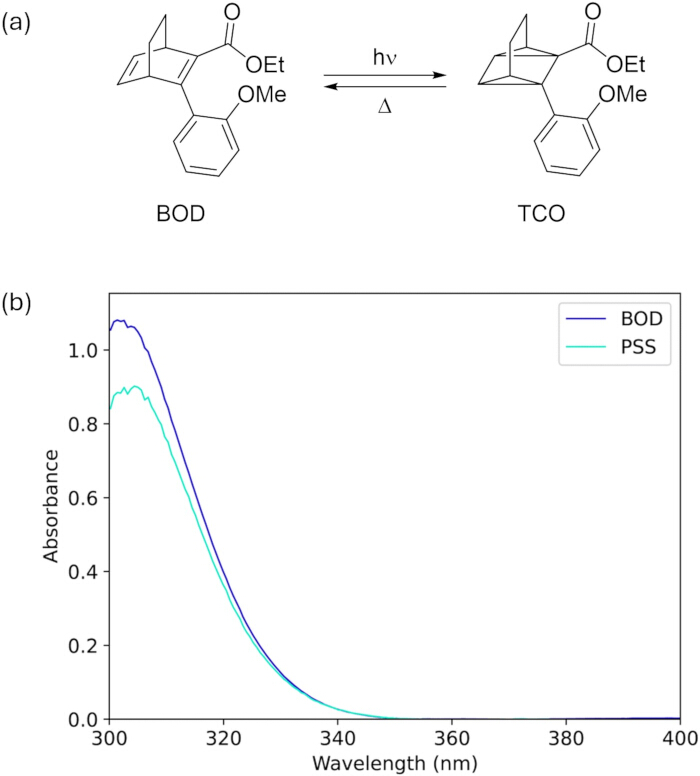
Figure 5: BOD–TCO photoswitching and UV–Vis spectral changes. a) Schematic of the bicyclooctadiene–tetracyclooctane (BOD–TCO) photoswitch system. b) UV-Vis spectra of BOD and its photostationary state (TCO) after irradiation at 308 nm. The figure depicts the BOD–TCO photoswitch system, showing a schematic of the light-induced BOD-to-TCO conversion and the corresponding UV–Vis absorption spectra, which illustrate the spectral changes upon formation of the TCO-rich photostationary state after 308 nm irradiation. This figure is reproduced from reference 17 with permission from the Royal Society of Chemistry, under CC-BY open access license.17 Please click here to view a larger version of this figure.
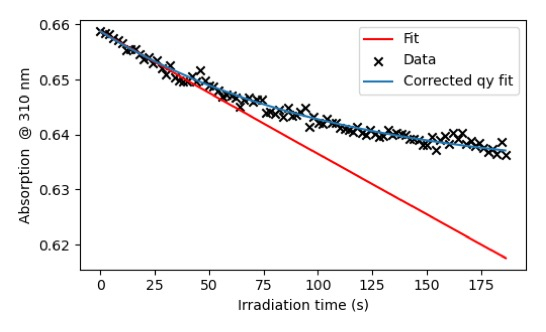
Figure 6: Illustrations of quantum yield fitting with and without inclusion of the thermal back-conversion term. Comparison between the analytical fit neglecting thermal back-conversion (QY = 13.8%) and the numerical fit including thermal back-conversion (QY = 15.1%, k = 5.5497×10⁻³ s−1 at 20 °C) for BOD, highlighting the differences in the obtained kinetics. Please click here to view a larger version of this figure.
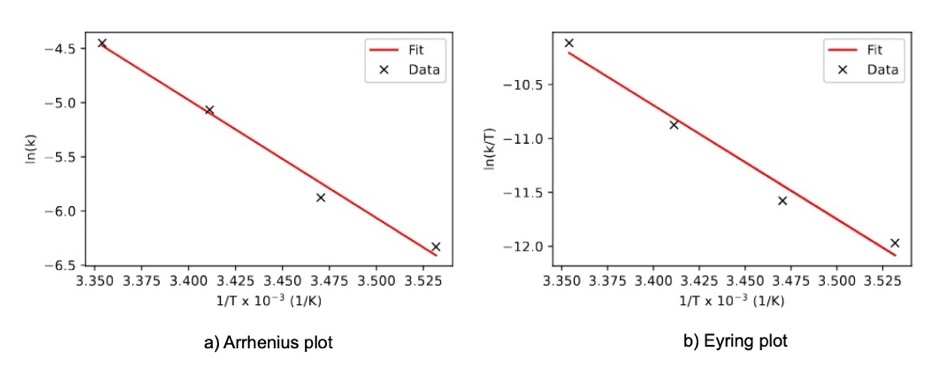
Figure 7: Eyring and Arrhenius plots for BOD. The plots were used to determine thermal half-lives and thermodynamic parameters at three temperatures. The rate constants were fitted using both the Arrhenius and Eyring equations. This figure is reproduced from reference 17 with permission from the Royal Society of Chemistry, under CC-BY open access license.17 Please click here to view a larger version of this figure.
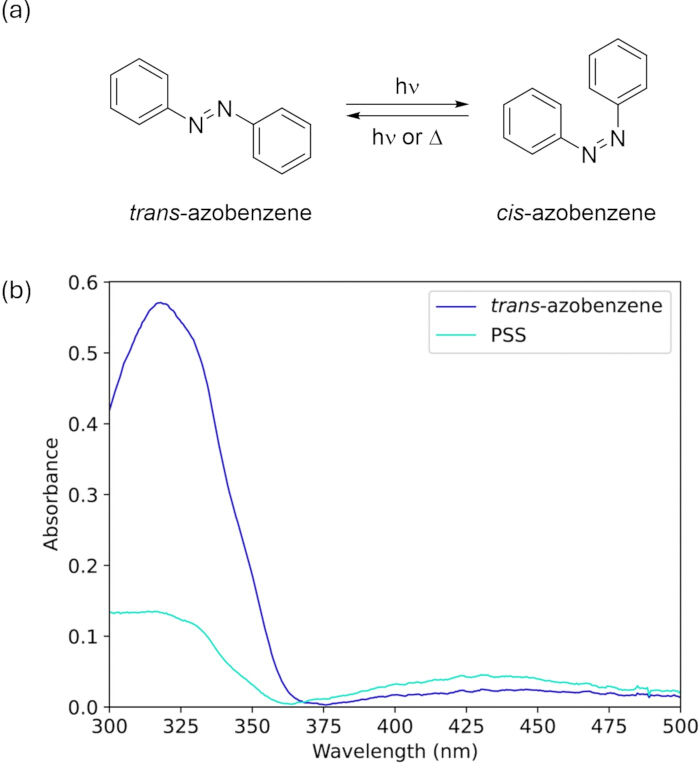
Figure 8: Azobenzene photoisomerization and UV–Vis spectral changes. a) Schematic of azobenzene photoisomerization. b) UV-Vis spectra of trans-azobenzene and the photostationary state (cis-azobenzene enriched) after 340 nm irradiation. The figures illustrate azobenzene photoisomerization, showing a schematic of the trans-to-cis switching process and the corresponding UV–Vis absorption spectra, highlighting the spectral changes upon formation of the cis-rich photostationary state after 340 nm irradiation. This figure is reproduced from reference 17 with permission from the Royal Society of Chemistry, under CC-BY open access license.17 Please click here to view a larger version of this figure.
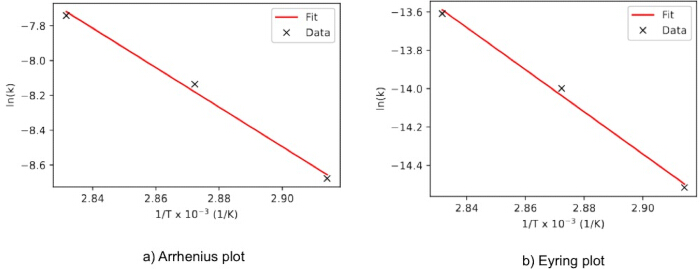
Figure 9: Eyring and Arrhenius plots for azobenzene. The plots were used to determine thermal half-lives and thermodynamic parameters at three temperatures. The rate constants were fitted using both the Arrhenius and Eyring equations. This figure is reproduced from reference 17 with permission from the Royal Society of Chemistry, under CC-BY open access license.17 Please click here to view a larger version of this figure.
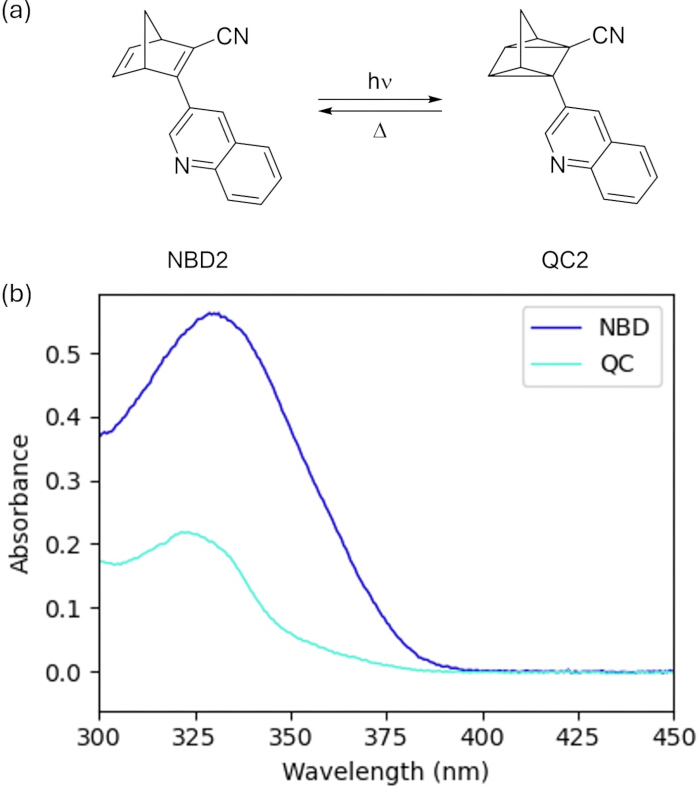
Figure 10: Photoisomerization and absorbance spectra of NBD2. a) Schematic representation of the NBD2/QC2 photoisomerization. b) UV-Vis spectra of NBD2 and QC2 after 340 nm irradiation. Please click here to view a larger version of this figure.
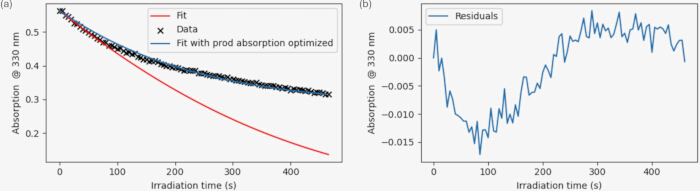
Figure 11: Quantum yield fitting for NBD2 with product absorption optimized. a) Example quantum yield fit of NBD2 upon irradiation at 340 nm, following the time-resolved absorbance at 330 nm. The rate of the thermal back-conversion (k = 9.1×10⁻⁶ s−1) and the product absorption at the irradiation wavelength (ε ^NBD2 = 9210 M−1 cm−1, ε ^QC2 = 1900 M−1 cm−1) is included in this numerical fit to give an optimized QY of 11.6% (blue line) at 25 °C compared to the analytical fit that gives a QY value of 13.3% (red line). b) Residuals for the optimized quantum yield fit including the product absorption. Please click here to view a larger version of this figure.
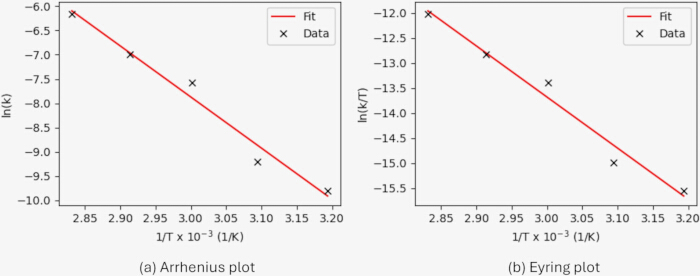
Figure 12: Eyring and Arrhenius plots for NBD2. The plots were used to determine thermal half-lives and thermodynamic parameters at five temperatures. The rate constants were fitted using both the Arrhenius and Eyring equations. Please click here to view a larger version of this figure.
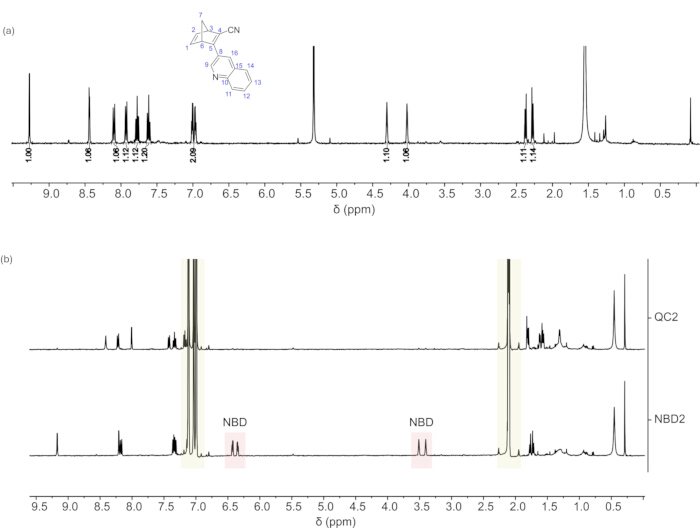
Figure 13. 1H NMR spectra of NBD2/QC2. a) NMR spectrum of NBD2 in CD2Cl2 with numbered atoms corresponding to the assignment in the experimental section. b) NMR spectra of NBD2 in toluene-d8 and after 1 hour of irradiation with 340 nm LED that allows full conversion to QC2. The characteristic NBD peaks are shown in pink and these disappear upon irradiation, and the residual solvent peaks are highlighted in yellow. Please click here to view a larger version of this figure.
| Category | Parameter | Example / Notes |
| Sample | Identity of photoswitch | NBD, BOD, Azobenzene |
| Concentration | e.g., 4.1 × 10⁻⁵ M | |
| Solvent | e.g., acetonitrile, toluene | |
| LED / Irradiation | Wavelength | Available wavelengths: 280 nm, 310 nm, 340 nm, 365 nm, 410 nm, 455 nm |
| Operating current / Power | 600 mA, 600, 600 mA, 1000 mA, 1200 mA, 1200 mA, respectively. | |
| Photon flux | Calibrated value corresponding to LED and settings | |
| Measurement interval | By default it is 1 second per spectrum | |
| Spectroscopic / Analysis | Analysis wavelength | More or less equal to the LED wavelength used |
| Zero-point wavelength | The point where there is no more absorption (usually around 500 nm) | |
| Number of points for fitting | Usually around 10, depending on how much data points are available | |
| Temperature | Forward reaction | Usually room temperature (25 °C) |
| Back-conversion | Depends a lot on the molecule (e.g., 70 °C) | |
| Kinetic analysis | At least three different temperatures required during back-conversion | |
| Flow System | Flow rate | By default it is 1 mL/min |
| Flushing volume | 200 μL between measurements |
Table 1: User-dependent parameters. The table summarizes the key initial parameters that must be set by the user for automated photoswitch characterization, including sample concentration, solvent, LED wavelength and power, measurement wavelength, temperature, flow rate, and software settings, which are essential for ensuring reproducible and accurate photochemical measurements.
| Wavelength of irradiation | Number of measurements | Experimental value |
| 340 nm | 7 | 0.676 ± 0.028 |
| 365 nm | 2 | 0.689 ± 0.022 |
Table 2: Quantum yields of NBD1/QC1 in toluene at 25 °C. Quantum yields of NBD1 measured at two irradiation wavelengths in toluene at 25 °C. This table is reproduced from reference 17 with permission from the Royal Society of Chemistry, under CC-BY open access license.17
| Wavelength of irradiation | Number of measurements | Experimental value |
| 340 nm | 5 | 0.109 ± 0.017 |
Table 3: Quantum yields of NBD2/QC2 in toluene at 25 °C (uncorrected fit). Quantum yields of NBD2 measured at one irradiation wavelength in toluene at 25 °C.
| Wavelength of irradiation | Number of measurements | Experimental value | Quant et al. (2022) |
| 308 nm | 2 | 0.146 ± 0.007 | 0.1443 ± 0.0004 |
Table 4: Quantum yield of BOD in acetonitrile at 20 °C (308 nm). Quantum yield of BOD measured at 308 nm irradiation, performed at 20 °C in acetonitrile. This table is reproduced from reference 17 with permission from the Royal Society of Chemistry, under CC-BY open access license.17
| Wavelength of irradiation | Number of measurements | Experimental value | Ladanyi et al. (2017) |
| 340 nm | 3 | 0.148 ± 0.003 | |
| 334 nm | 6 | 0.155 ± 0.006 |
Table 5: Quantum yields for trans–cis azobenzene photoisomerization. Quantum yields for trans-to-cis azobenzene photoisomerization at 340 nm in acetonitrile at 25 °C, compared with literature values measured in methanol at 334 nm. This table is reproduced from reference 17 with permission from the Royal Society of Chemistry, under CC-BY open access license.17
| Property | Value |
| half-life (25°C) | 27 days |
| ∆H‡ | 115.039935 kJ/mol |
| ∆S‡ | 16.1 J/mol K |
| ∆G‡ (25°C) | 117.974 kJ/mol |
Table 6: Thermodynamic parameters for NBD1. The table presents key kinetic and thermodynamic parameters for the thermal isomerization of NBD1, including its half-life at 25 °C, along with the associated enthalpy, entropy, and Gibbs free energy of activation, which together describe the compound’s thermal stability and isomerization behavior. This table is reproduced from reference 17 with permission from the Royal Society of Chemistry, under CC-BY open access license.17
| Property | Value |
| half-life (25°C) | 0.884 days |
| A | 2.15e+10 1/s |
| ∆H‡ | 82.998240 kJ/mol |
| ∆S‡ | -56.3 J/mol K |
| ∆G‡ (25°C) | 68.22 kJ/mol |
Table 7: Thermodynamic parameters for NBD2. The table presents key kinetic and thermodynamic parameters for the thermal isomerization of NBD2, including its half-life at 25 °C, Arrhenius pre-exponential factor, and the associated enthalpy, entropy, and Gibbs free energy of activation, which together describe the compound’s thermal stability and isomerization behavior.
| Property | Value |
| half-life (25°C) | 63 seconds |
| A | 7.10e+13 1/s |
| ∆H‡ | 87.824995 kJ/mol |
| ∆S‡ | 12.2 J/mol K |
| ∆G‡ (25°C) | 90.240 kJ/mol |
Table 8: Thermodynamic parameters for BOD. The table presents key kinetic and thermodynamic parameters for the thermal isomerization of a BOD, including its half-life at 25 °C, Arrhenius pre-exponential factor, and the associated enthalpy, entropy, and Gibbs free energy of activation, which together describe the compound’s thermal stability and isomerization behavior. This table is reproduced from reference 17 with permission from the Royal Society of Chemistry, under CC-BY open access license.17
| Property | Value |
| half-life (25°C) | 6.796 days |
| A | 3.99e+10 1/s |
| ∆H‡ | 91.452630 kJ/mol |
| ∆S‡ | -51.6 J/mol K |
| ∆G‡ (25°C) | 94.347 kJ/mol |
Table 9: Thermodynamic parameters for azobenzene. The table presents key kinetic and thermodynamic parameters for the thermal isomerization of an azobenzene, including its half-life at 25 °C, Arrhenius pre-exponential factor, and the associated enthalpy, entropy, and Gibbs free energy of activation, which together describe the compound’s thermal stability and isomerization behavior. This table is reproduced from reference 17 with permission from the Royal Society of Chemistry, under CC-BY open access license.17
Supplementary File 1: Quantum yield experiment. The quantum yield experiment program is the GUI that allows the user to carry out the photoconversion reaction. A reference spectrum of the solvent in use must be made or uploaded prior to the start of the experiment (for baseline correction). The absorption spectrum of the molecule can be monitored here over time. The program is able to back-convert the molecule to its parent state, if necessary, i.e. through heating (for a T-type photoswitch) or with irradiation at a different wavelength (for a P-type photoswitch).Please click here to download this file.
Supplementary File 2: Photonflux calculator. The photonflux calculator program is used to calibrate the photon flux of available LEDs. The photon flux was determined from the optical power measured with a calibrated photodiode sensor and converted to photon flux using the LED wavelength.Please click here to download this file.
Supplementary File 3: Photonflux calibration table. The photonflux calibration table holds the data collected from the photonflux calculator.Please click here to download this file.
Supplementary File 4: Quantum yield analysis. The quantum yield analysis program allows the user to determine either the quantum yield of a reaction or, alternatively, the corresponding photon flux. Before starting the analysis, the user must provide either the solution concentration or the extinction coefficient. If thermally promoted back-conversion occurs during the experiment, the associated rate constants can also be determined; these values are subsequently used to calculate the half-life of the molecule.Please click here to download this file.
Supplementary File 5: Half-life analysis. The half-life analysis program uses the rate constants (k) at a minimum of three different temperatures to generate Arrhenius and Eyring fits, enabling the extraction of the corresponding kinetic and thermodynamic parameters.Please click here to download this file.
Discussion
The primary photochemical and thermodynamic characteristics of molecular photoswitches can be reliably and effectively determined using the automated flow-based photochemical characterization platform. A few workflow components are essential to obtaining accurate results. Accurate calculation of photoisomerization quantum yields requires precise calibration of the LED photon flux25. The power sensor must always be placed after the cuvette for two reasons. Firstly, to ensure that only photons that reach the sample are measured (since the LED irradiation beam is often wider than the cuvette window). Secondly, to consider the reflection and absorption losses at the cuvette surfaces26. Maintaining constant temperature control within the microfluidic chamber is essential because even small variations can affect thermal back-conversion rates and distort kinetic analyses. Finally, automated sample handling must be carefully validated to avoid the introduction of air bubbles or dilution effects, which can lead to spectral artifacts27. A previously unreported NBD photoswitch, NBD2, was evaluated using the automated setup, demonstrating its photoinduced conversion in toluene and highlighting the ability of the system to characterize novel photoswitches reproducibly.
The platform's modular design enables modifications based on the needs of various photoswitch systems. Other light sources, including UV lamps or laser diodes, can be incorporated into the irradiation module for photoswitches that absorb outside the spectral range of the LED array. The Python framework can be extended to include global fitting methods or multi-wavelength deconvolution in situations where overlapping absorption bands make spectral analysis more difficult. Ensuring the optical path is precisely aligned to maximize the transmitted signal, checking the stability of the LED output, and maintaining sample concentrations within the linear detection range of the UV-Vis spectrometer are all routine troubleshooting tasks. If the quantum yield and kinetic analyses fail to produce a reliable fit, this often indicates either that the chosen kinetic model is inappropriate (e.g., neglecting thermal reversion in BOD-type systems) or that the data are insufficiently resolved in time, which can be improved by increasing the frequency of spectral measurements28.
There are still certain limits and restrictions, even though the platform greatly improves reproducibility and throughput. Without alterations, the current configuration is not applicable to solid-state, heterogeneous, or membrane-bound photoswitches since it requires homogeneous liquid samples. Strong spectral overlap between the parent and photoproduct reduces the accuracy of spectral deconvolution and may introduce inaccuracy in the calculation of quantum yield at high conversions29. Furthermore, currently the minimal time between successive spectral measurements is 1 s, although shorter integration times may be achievable depending on spectrometer settings30. Traditional methods for characterizing photoswitches are often batch-based and involve manually irradiating samples in cuvettes before transferring them to spectrometers. These procedures add user-dependent variability, consume larger amounts of sample, and have limited throughput. On the other hand, the presented method integrates monitoring, analysis, and irradiation into a single automated pipeline. Concentration variations and handling errors are reduced by obtaining spectra in situ and containing microliter-scale samples in a temperature-controlled microfluidic environment. This approach differs from conventional, segmented techniques in that it can automatically conduct Eyring and Arrhenius studies at various temperatures in a single workflow. Quantum yields and thermal half-lives for NBD, BOD, and azobenzene closely match values seen in the literature, demonstrating that automation increases efficiency and repeatability without sacrificing accuracy15.
This platform enables broad, cross-disciplinary applications by providing rapid and standardized characterization of photoswitch systems. Designing photoswitches with predictable on/off dynamics in biological contexts requires accurate quantum yield and half-life measurements, which are crucial in photopharmacology31. Accurate assessment of photoisomerization efficiency and storage stability in solar thermal fuels speeds up the screening of potential molecules for useful energy storage32. The technique facilitates the quick comparison of potential candidates for light-driven actuation or data storage in materials science, where photoswitches are integrated into polymers and responsive coatings33. Beyond specific uses, the capacity to produce large, standardized datasets makes it possible to use machine learning techniques to direct molecular design and optimization34.
The automated characterization platform, in summary, creates an automated workflow which enables the analysis of multiple photoswitch samples sequentially with minimal manual intervention. While the modular design facilitates troubleshooting and adaptability to various photoswitch classes, crucial stages include meticulous photon flux calibration and strict temperature control35. The approach is a significant advancement over conventional batch-based methods, despite being constrained by issues with spectrum overlap and sample homogeneity. This integrated workflow is important, because it allows for systematic assessment of molecular photoswitches by integrating irradiation, monitoring, and kinetic modeling into a single workflow. This automated workflow provides a scalable framework for accelerating the discovery and characterization of functional molecular photoswitches across multiple research fields such as solar energy storage, smart materials, and light-driven biological systems because it can speed up discovery while requiring less user participation36.
Disclosures
The authors have nothing to disclose.
Acknowledgements
The authors gratefully acknowledge financial support from the European Commission's Horizon 2020 Program (Grant No. 951801 MOST), the European Research Council's Excellent Science Program (Grant No. 101002131 PhoTherm), and from the Deutsche Forschungsgemeinschaft (DFG) Research Unit FOR5499 Molekulares Management von Sonnenenergie – Chemie von MOST – Systemen Project number 496207555, including project part D-Dev: Exploring MOST for/in devices. We also acknowledge the Universitat Politecnica de Catalunya for access to analytical instrumentation and infrastructure.
Materials
| Name | Company | Catalog Number | Comments |
|---|---|---|---|
| Flow cuvette | Starna Cells | 583.4.2F-Q-10/Z15 | Inside the cuvette holder |
| LED array | Thorlabs | M280F5, M310F1, M340F4, M365FP1, | Fiber-coupled; Provides controlled irradiation |
| M405F3, M430F1, M455F3 | |||
| Photodiode Power Sensor | Thorlabs | S120VC | For photon flux measurement |
| Portable computer with software installed | For data acquisition, storage, and analysis | ||
| Power and Energy Meter Interface (USB) | Thorlabs | PM100USB | Connects sensor to computer for data transfer |
| Pump | Vapourtec | SF10 | - |
| Sample rack | In-house design and 3D print | - | - |
| Spectrometer | Avantes | AvaSpec-ULS2048CL-EVO | - |
| Syringes and tubing | IDEX | 0.7 mm inner diameter ETFE tubing | Compatible with microfluidic pump system |
| Temperature-controlled cuvette holder | Quantum Northwest | qPod 3e | - |
| UV Lamp | Avantes | AvaLight-D(H)-S | - |
| Valve | Knauer | AVQ63AF | Valve unifier AWA01XA |
References
- Pianowski, Z. L. Recent Implementations of Molecular Photoswitches into Smart Materials and Biological Systems. Chem A Eur J. 25, 5128-5144 (2019).
- Welleman, I. M., Hoorens, M. W. H., Feringa, B. L., Boersma, H. H., Szymański, W. Photoresponsive molecular tools for emerging applications of light in medicine. Chem Sci. 11, 11672-11691 (2020).
- Meng, X., et al. Recent Advances in Smart Windows Based on Photo‐Responsive Liquid Crystals Featuring Phase Transition. Chempluschem. 89, e202300700(2024).
- Mishra, K., et al. Genetically encoded photo-switchable molecular sensors for optoacoustic and super-resolution imaging. Nat Biotechnol. 40, 598-605 (2022).
- Salthouse, R. J., Moth-Poulsen, K. Multichromophoric photoswitches for solar energy storage: from azobenzene to norbornadiene, and MOST things in between. J Mater Chem A Mater. 12, 3180-3208 (2024).
- Wang, H., Bisoyi, H. K., Zhang, X., Hassan, F., Li, Q. Visible Light‐Driven Molecular Switches and Motors: Recent Developments and Applications. Chem A Eur J. 28, e202103906(2022).
- Xu, Y., Tang, Y., Li, Q. Visible‐ and Near‐Infrared Light‐Driven Molecular Photoswitches for Biological Applications. Adv Funct Mater. 35, 2416359(2025).
- Luo, P., Xiang, S., Li, C., Zhu, M. Photomechanical polymer hydrogels based on molecular photoswitches. J Poly Sci. 59, 2246-2264 (2021).
- Sun, C., Wang, C., Boulatov, R. Applications of Photoswitches in the Storage of Solar Energy. ChemPhotoChem. 3, 268-283 (2019).
- Losantos, R., Sampedro, D. Design and Tuning of Photoswitches for Solar Energy Storage. Molecules. 26, 3796(2021).
- Salthouse, R. J., Moth-Poulsen, K. Multichromophoric photoswitches for solar energy storage: from azobenzene to norbornadiene, and MOST things in between. J Mater Chem A Mate.r. 12, 3180-3208 (2024).
- van Leeuwen, T., Lubbe, A. S., Štacko, P., Wezenberg, S. J., Feringa, B. L. Dynamic control of function by light-driven molecular motors. Nat Rev Chem. 1, 0096(2017).
- Irie, M. Diarylethenes for Memories and Switches. Chem Rev. 100, 1685-1716 (2000).
- Volker, A., Steen, J. D., Crespi, S. A fiber-optic spectroscopic setup for isomerization quantum yield determination. Beilstein J Org Chem. 20, 1684-1692 (2024).
- Orrego-Hernández, J., Dreos, A., Moth-Poulsen, K. Engineering of Norbornadiene/Quadricyclane Photoswitches for Molecular Solar Thermal Energy Storage Applications. Acc Chem Res. 53, 1478-1487 (2020).
- Griffiths, R. R., et al. Data-driven discovery of molecular photoswitches with multioutput Gaussian processes. Chem Sci. 13, 13541-13551 (2022).
- Elholm, J. L., et al. An automated photo-isomerisatio.n and kinetics characterisation system for molecular photoswitches. Digital Disc. 4, 2045-2051 (2025).
- Jevric, M., et al. Norbornadiene‐Based Photoswitches with Exceptional Combination of Solar Spectrum Match and Long‐Term Energy Storage. Chem Eur J. 24, 12767-12772 (2018).
- Quant, M., et al. Synthesis, characterization and computational evaluation of bicyclooctadienes towards molecular solar thermal energy storage. Chem Sci. 13, 834-841 (2022).
- Jevric, M., et al. Norbornadiene‐Based Photoswitches with Exceptional Combination of Solar Spectrum Match and Long‐Term Energy Storage. Chem Eur J. 24, 12767-12772 (2018).
- Ladányi, V., et al. Azobenzene photoisomerization quantum yields in methanol redetermined. Photochem Photobiol Sci. 16, 1757-1761 (2017).
- Vetráková, L., et al. The absorption spectrum of cis-azobenzene. Photochem Photobiol Sci. 16, 1749-1756 (2017).
- Bowman, W. D., Demas, J. N. Ferrioxalate actinometry. A warning on its correct use. J Phys Chem. 80, 2434-2435 (1976).
- Hatchard, C. G., Parker, C. A. A new sensitive chemical actinometer - II. Potassium ferrioxalate as a standard chemical actinometer. Proc R Soc Lond A Math Phys Sci. 235 (1203), 518-536 (1956).
- Megerle, U., Lechner, R., König, B., Riedle, E. Laboratory apparatus for the accurate, facile and rapid determination of visible light photoreaction quantum yields. Photochem Photobiol Sci. 9, 1400-1406 (2010).
- Aleotti, F., et al. Engineering Azobenzene Derivatives to Control the Photoisomerization Process. J Phys Chem A. 127, 10435-10449 (2023).
- Kumbhakar, M., et al. High‐Throughput Screening of High‐Entropy Fluorite‐Type Oxides as Potential Candidates for Photovoltaic Applications. Adv Energy Mater. 13, 2204337(2023).
- Stadler, E., et al. A versatile method for the determination of photochemical quantum yields via online UV-Vis spectroscopy. Photochem Photobiol Sci. 17, 660-669 (2018).
- Kobauri, P., Dekker, F. J., Szymanski, W., Feringa, B. L. Rational Design in Photopharmacology with Molecular Photoswitches. Angew Chem Int Ed. 62, e202300681(2023).
- Mony, J., et al. Photoisomerization Efficiency of a Solar Thermal Fuel in the Strong Coupling Regime. Adv Funct Mater. 31, 2010737(2021).
- Wang, N., Wang, H., Wang, K., Zuo, J., Wang, Z. Reversible dual stimuli-responsive polymer coatings with antimicrobial properties for oil–water separation. J Water Proc Eng. 77, 108484(2025).
- Wang, Z., et al. Liquid‐Based Multijunction Molecular Solar Thermal Energy Collection Device. Adv Sci. 8, 2103060(2021).
- Börjesson, K., Lennartson, A., Moth-Poulsen, K. Efficiency Limit of Molecular Solar Thermal Energy Collecting Devices. ACS Sustain Chem Eng. 1, 585-590 (2013).
Reprints and Permissions
This article has been published
Video Coming Soon