This protocol outlines a computational process to create and assess ensemble machine learning models for heart disease prediction using publicly accessible benchmark data within a reproducible preprocessing and evaluation structure.
A subscription to JoVE is required to view this content. Sign in or start your free trial.
Research Article
Comparative Evaluation of Ensemble Machine Learning Approaches for Heart Disease Prediction
In This Article
Summary
Abstract
This paper presents a computational bench-marking assessment of Ensemble Learning algorithms in the prediction of heart disease, combining different Machine Learning algorithms, such as hard voting, soft voting, and stacking, in a single framework. The evaluation was conducted using publicly available cardiovascular dataset obtained from the Kaggle repository (https://www.kaggle.com/datasets/sid321axn/heart-statlog-cleveland-hungary-final) comprising 1,190 instances and 11 clinical features. The process involves data preprocessing, which includes handling missing values, removing outliers, scaling variables and class balancing to ensure uniform input feature selection, based on Random Forest (RF), is used to eliminate unnecessary features. Among the evaluated models, the stacking ensemble classifier achieved the highest overall accuracy of 91.88% on the test dataset. Although additional metrics such as precision, recall and F1-score were computed for comparative analysis, the emphasis of this study remains on methodological benchmarking rather than clinical validation.
Various base classifiers, including Decision Tree, Random Forest, AdaBoost, and XGBoost, are applied and tested independently. These models are then combined using ensemble techniques with hard voting, soft voting, and stacking. In stacking, Logistic Regression is used as the meta-model, which is trained on cross-validated predictions of the out-of-fold samples to avoid overfitting.
Evaluations are carried out using accuracy as the primary criterion for comparison, so that individual classification systems and their combination strategies can be compared uniformly in the same preprocessing and validation environment. Though performance metrics are provided for comparative indications, the emphasis of the approach lies in the development and evaluation of strategies and not in their clinical assessment.
This protocol makes it easy to compare ensemble machine learning algorithms on publicly available cardiovascular datasets and helps to make a systematic comparison of data preprocessing and ensemble configuration approaches.
Introduction
Publicly available cardiovascular disease datasets are widely used as benchmark problems in machine learning research for evaluating classification algorithms and predictive modelling techniques1,2,3. Such datasets, which contain clinical and demographic attributes, provide a standardized and reproducible basis for comparing preprocessing strategies, feature selection methods, and ensemble learning architectures under controlled experimental conditions. Consequently, they are commonly employed to assess algorithmic behaviour rather than to support clinical inference or real-world deployment4,5.
Previous research has looked into various machine learning methods for predicting cardiovasculr disease, such as Logistic Regression (LR), Support Vector Machines (SVM), Random Forests (RF) and gradient boosting models6,7,8,9. More recently, studies have focused on ensemble learning techniques, such as hard voting, soft voting and stacking, to make models more stable and improve their performance10,11,12,13,14. However, the differences in how data is prepared, features are handled, validation is done, and results are measured across these studies make it hard to compare the outcomes reported directly. To provide a high-level contextual overview of cardiovascular disease categories commonly reported in the literature, a conceptual illustration is presented in Figure 1.
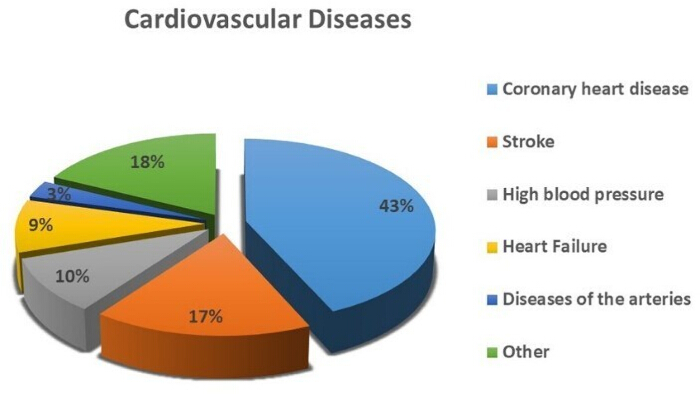
Figure 1: Conceptual illustration of commonly reported cardiovascular disease categories, included for contextual background only. Please click here to view a larger version of this figure.
Figure 1 is included solely for high-level contextual reference and does not represent data derived from the dataset analyzed in this study or any outputs of the proposed computational protocol.
In particular, many existing works emphasize performance outcomes without clearly isolating the contribution of individual methodological components, such as feature selection timing, class balancing, or ensemble configuration15,16,17,18. This variability highlights the need for a reproducible benchmarking framework that systematically evaluates ensemble machine learning methods using a consistent preprocessing pipeline and evaluation protocol on a publicly available dataset.
It is hypothesized that ensemble learning approaches, particularly stacking methods, will demonstrate improved classification accuracy and balanced class-wise performance compared with individual base classifiers when evaluated under standardized preprocessing and validation conditions.
Accordingly, the objective of this study is to conduct a computational benchmarking analysis of ensemble machine learning approaches for cardiovascular disease prediction using a publicly available Kaggle dataset. The process entails standardized data preprocessing, use of the Random Forest algorithm to rank the importance of features, as well as the employment of different ensemble techniques, which involve hard voting, soft voting, and stacking. Logistic Regression is used as the meta-classifier algorithm in stacking. This ensures there is no overfitting, as it uses cross-validated predictions.
This study is intended strictly as a public dataset benchmarking investigation. Its findings are limited by reliance on a single dataset and potential dataset-specific biases, and therefore do not imply clinical validation or deployment. External validation using independent datasets and prospective evaluation would be required before any clinical application could be considered.
The following research questions guide this study:
This study examines how different ensemble machine learning approaches, including hard voting, soft voting, and stacking, compare in terms of classification accuracy when applied to a publicly available cardiovascular disease dataset.
Access restricted. Please log in or start a trial to view this content.
Protocol
This protocol described a reproducible computational workflow for benchmarking ensemble machine learning models using a publicly available cardiovascular disease dataset.
Selection of the dataset
The study employed a publicly available cardiovascular disease dataset obtained from the Kaggle repository. The dataset comprised 1190 instances and included 11 features. For model training, 80% of the data was utilized, while the remaining 20% was allocated for performance evaluation. Table 1 presented a detailed description of the dataset features. The dataset was loaded into Python (version 3.9) using the pandas library (version 1.5.3). Dataset integrity was verified by examining missing values, duplicate records, and inconsistent data types.
Table 1 summarizes the demographic, clinical, and experimental attributes included in the cardiovascular disease dataset, along with their data types and encoded formats. These features constituted the input variables for all subsequent model training and evaluation procedures.
| Sl. No | Feature Name | Data Type | Description |
| 1 | Age | Numeric | Age of the patient in years. |
| 2 | Sex | Nominal | Male represented as 1, and Female represented as 0. |
| 3 | Chest pain type | Categorical | 1: Typical 2: Typical angina 3: Non-anginal pain 4: Asymptomatic |
| 4 | Resting BP s | Numerical | Blood pressure at rest measured in millimeters of mercury (mmHg). |
| 5 | Cholesterol level | Numeric | Serum cholesterol in milligrams per deciliter (mg/dL). |
| 6 | Fasting blood sugar | Nominal | Blood sugar levels above 120 mg/dl during fasting are represented as 1 for true and 0 for false. |
| 7 | Resting ECG | categorical | Three distinct values are assigned as follows: 0 for Normal, 1 for Abnormality in ST-T wave, and 2 for Left ventricular hypertrophy. |
| 8 | Max heart rate | Numeric | Peak heart rate attained |
| 9 | Exercise angina | Nominal | Angina induced by exercise, where 0 represents NO and 1 represents Yes. |
| 10 | Oldpeak | Numeric | ST-depression during exercise compared to the resting state. |
| 11 | ST slope | categorical | ST segment slope during peak exercise categorized as follows: 0: Normal 1: Upsloping 2: Flat 3: Downsloping |
Table 1: Description of Dataset Features Used for Heart Disease Prediction.
Preprocessing of the data
Data preprocessing was performed using Python libraries. Rows containing missing values were removed using pandas.DataFrame.dropna() function. Outliers in numerical features were identified and removed using the interquartile range (IQR) method and boxplot-based visualization, which illustrates the distribution and detected outliers across features (Figure 2). All numerical variables were scaled using the StandardScaler function from the scikit-learn library (version 1.2.2). Class imbalance was addressed through random under-sampling to obtain a balanced class distribution prior to model training.
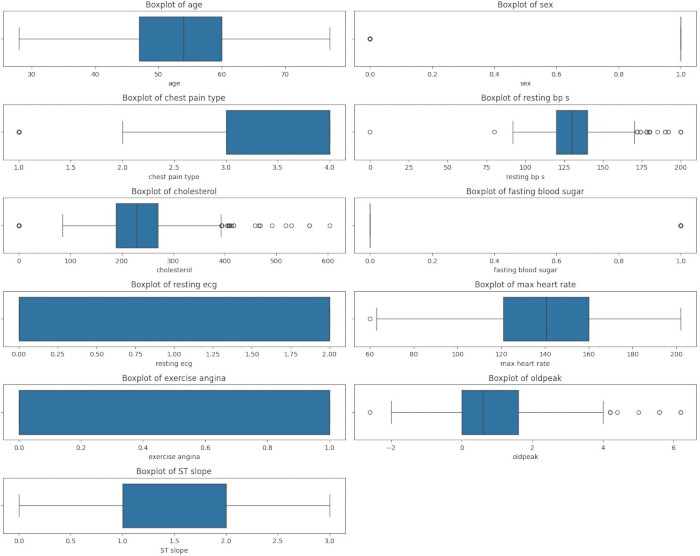
Figure 2: Boxplot of all Attributes in the Cardiovascular Disease Dataset. Please click here to view a larger version of this figure.
Pearson’s correlation coefficient (PCC) was employed to assess relationships among features. The resulting correlation matrix, visualized as a heat map, illustrates the strength and direction of pairwise feature correlations and highlights redundant attributes for elimination (Figure 3).
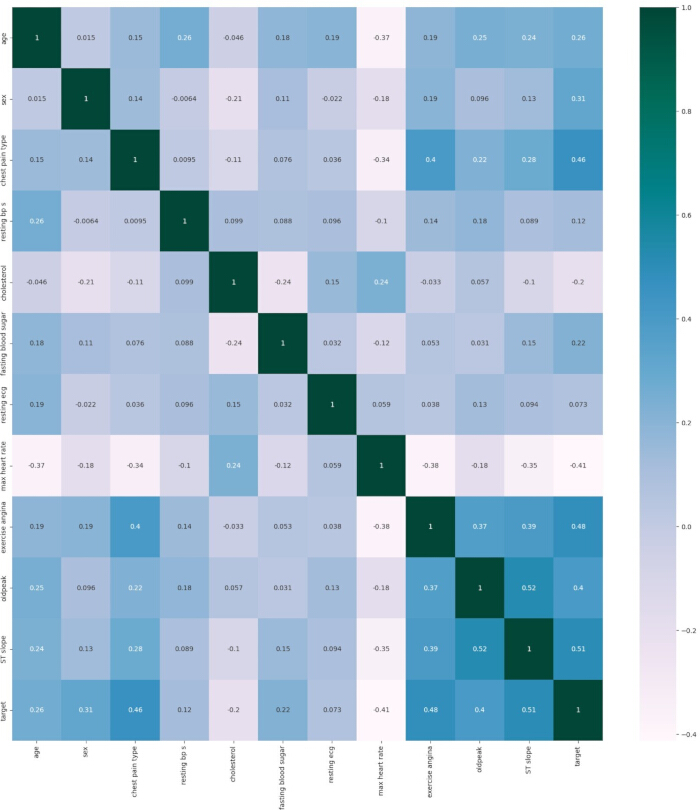
Figure 3: Correlation Matrix for the Heart Disease Dataset. Please click here to view a larger version of this figure.
The model results in a heat map of the correlation matrix that is aesthetically pleasing and enables faster comprehension of correlations between different features in the data. This heat map uses colors to show how much and in which direction values are correlated, making it an important tool in Exploratory Data Analysis. Lighter colors show higher positive correlations, darker colors show higher negative correlations, and more greens show correlations near zero.
Feature extraction
Feature selection was performed using Random Forest feature importance implemented via the RandomForestClassifier in open-source machine learning libraries. Feature importance scores were calculated based on the mean decrease in impurity, and features were ranked accordingly. The top-N ranked features were retained for subsequent analysis. Feature selection was applied after completion of all preprocessing steps and prior to train–test splitting, ensuring that a fixed and consistent feature set was used across all classification models and ensemble configurations (Figure 4).
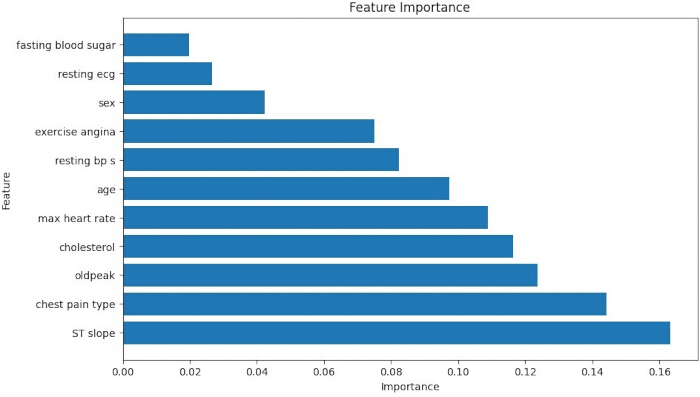
Figure 4: Feature importance scores computed using Random Forest feature importance. Features are ranked by normalized importance value. Please click here to view a larger version of this figure.
Features were ranked based on the mean decrease in impurity using Random Forest feature importance with random_state = 42; however, all available features (N = 11) were retained for subsequent model training. Feature selection was applied after preprocessing and prior to train–test splitting, ensuring a fixed feature set across all models.
Model training and ensemble construction
The dataset was partitioned into training and testing subsets using an 80:20 split ratio with the train_test_split() function. The training data were used exclusively for model development and ensemble construction, while the testing data were reserved for performance evaluation. Base classifiers, including Decision Tree, Random Forest, AdaBoost, and XGBoost, were trained on the training dataset using default hyperparameter settings unless otherwise specified.
Hard voting and soft voting ensemble models were constructed using the VotingClassifier, with equal weights assigned to all base classifiers to ensure objective comparison. A stacking ensemble model was implemented using Logistic Regression as the meta-classifier. The meta-classifier was trained on out-of-fold predictions generated through 5-fold cross-validation of the base classifiers, which reduced overfitting and enabled unbiased estimation of ensemble performance.
Proposed model
The proposed ensemble framework was implemented to construct a composite classifier using multiple ensemble learning strategies. All training data were standardized, and identical preprocessing steps were applied to the testing data to ensure consistency between training and evaluation phases. Base classifiers were integrated using hard voting, soft voting and stacking mechanisms and the stacking meta-classifier was trained using Logistic Regression on cross-validated predictions. The overall architecture and data flow of the ensemble framework (Figure 5).
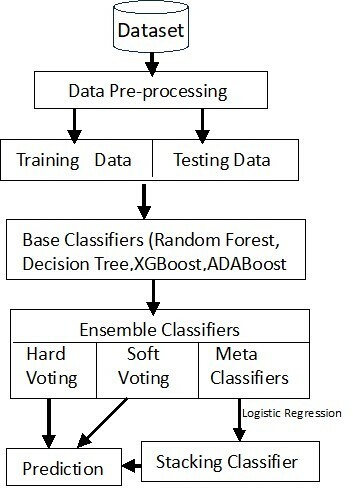
Figure 5: Architecture of Proposed Model. Please click here to view a larger version of this figure.
Level-I:
At Level I of the ensemble framework, four base classifiers—Random Forest, Decision Tree, XGBoost and AdaBoost—were trained using the scaled training dataset. These base classifiers were combined to construct both hard voting and soft voting ensemble models. Equal weights were assigned to all base classifiers to maintain objectivity and to prevent bias arising from differential weight tuning during ensemble construction.
Level-II:
At Level II, a stacking ensemble classifier was implemented by combining predictions generated by the base classifiers. The base classifiers were trained using 5-fold cross-validation and out-of-fold predictions were generated for each fold. These out-of-fold predictions were then used as input features to train a Logistic Regression meta-classifier, thereby reducing overfitting and enabling unbiased estimation of ensemble performance.
Access restricted. Please log in or start a trial to view this content.
Results
This section presents the effects of data preprocessing and feature selection, compares the performance of individual and ensemble classifiers and summarizes benchmarking outcomes across standard evaluation metrics. Data preprocessing, including missing value removal, class balancing and feature scaling, produced consistent input distributions across all classifiers. Models trained on preprocessed data exhibited reduced variability in performance across repeated 5-fold cross-validation runs and train–test splits compared...
Access restricted. Please log in or start a trial to view this content.
Discussion
This study demonstrates that stacking-based ensemble learning consistently achieved superior and more stable classification performance compared with individual classifiers and voting-based ensembles under standardized preprocessing and benchmarking conditions.
The consistency of ensemble performance observed in this study reinforces the importance of methodological rigor in comparative machine learning research19,20,
Access restricted. Please log in or start a trial to view this content.
Disclosures
The authors declare that they have no conflicts of interest related to this research work. No financial, personal, or professional relationships have influenced the results, analysis, or conclusions presented in this manuscript.
Acknowledgements
The authors acknowledge the use of publicly available datasets and open-source software resources that supported this study. The authors also thank their respective institutions, including Sri Sri University, Bhubaneswar, and SOA University, Bhubaneswar, for providing the academic environment and research facilities necessary to conduct this work.
Access restricted. Please log in or start a trial to view this content.
Materials
| Name | Company | Catalog Number | Comments |
|---|---|---|---|
| AdaBoostClassifier | scikit-learn Developers | N/A | Ensemble boosting classifier used for benchmarking |
| Jupyter Notebook | Project Jupyter | N/A | Computational notebook environment |
| Kaggle Heart Statlog (Cleveland–Hungary) Dataset | Kaggle | N/A | Public cardiovascular dataset (1190 instances, 11 features). URL: https://www.kaggle.com/datasets/sid321axn/heart-statlog-cleveland-hungary-final |
| LogisticRegression | scikit-learn Developers | N/A | Meta-classifier used in stacking ensemble |
| Matplotlib | Matplotlib Development Team | N/A | Data visualization library |
| NumPy | NumPy Developers | N/A | Numerical computation library |
| pandas (Version 1.5.3) | pandas Development Team | N/A | Data preprocessing and handling |
| Python (Version 3.9) | Python Software Foundation | N/A | Programming environment used for implementation |
| RandomForestClassifier | scikit-learn Developers | N/A | Base classifier and feature importance computation |
| Seaborn | Seaborn Development Team | N/A | Heatmap visualization of correlation matrix |
| StandardScaler | scikit-learn Developers | N/A | Feature scaling function |
| VotingClassifier | scikit-learn Developers | N/A | Hard and soft voting ensemble implementation |
| XGBoostClassifier | DMLC | N/A | Gradient boosting classifier used as base learner |
References
- Libby, P., Bonow, R. O., et al. Braunwald’s Heart Disease: A Textbook of Cardiovascular Medicine. Elsevier Health Sci. 9, (2011).
- Nayak, O., Pallapothala, T., Gupta, G. P. Heart disease prediction framework using soft voting-based ensemble learning techniques. Convergence of Big Data Technologies and Computational Intelligent Techniques. IGI Global. , IGI Global. 147-165 (2023).
- Gaidai, O., Yan, P., Xing, Y. Future world cancer death rate prediction. Sci Rep. 13 (1), 303(2023).
- Imran, M., et al. A hybrid ensemble framework for cardiac disease risk stratification with machine learning. J Popul Ther Clin Pharmacol. 30 (18), 1336-1353 (2023).
- Elhneiti, M., Al-Hussami, M. Predicting risk factors of heart disease among Jordanian patients. Health. 9 (2), 237-247 (2017).
- Sevakula, R. K., Verma, N. K. Assessing generalization ability of majority vote point classifiers. IEEE Trans Neural Netw Learn Syst. 28 (12), 2985-2997 (2017).
- Li, H., et al. Ensemble learning for overall power conversion efficiency of all-organic dye-sensitized solar cells. IEEE Access. 6, 34118-34126 (2018).
- Chicco, D., Jurman, G. Machine learning can predict survival of patients with heart failure from serum creatinine and ejection fraction alone. BMC Med Inform Decis Mak. 20 (1), 16(2020).
- Predicting the survival of heart failure patients in unbalanced data sets. Türkmenoğlu, B. K., Yildiz, O. In Proc. 29th Signal Process Commun Appl Conf (SIU), , IEEE. 1-4 (2021).
- Wang, B., et al. A multi-task neural network architecture for renal dysfunction prediction in heart failure patients with electronic health records. IEEE Access. 7, 178392-178400 (2019).
- Amin, M. S., Chiam, Y. K., Varathan, K. D. Identification of significant features and data mining techniques in predicting heart disease. Telemat Inform. 36, 82-93 (2019).
- Gao, X. Y., et al. Improving the accuracy for analyzing heart diseases prediction based on the ensemble method. Complexity. 2021, 1-10 (2021).
- Hasan, N., Bao, Y. Comparing different feature selection algorithms for cardiovascular disease prediction. Health Technol. 11, 49-62 (2021).
- Pan, C., et al. Impact of categorical and numerical features in ensemble machine learning frameworks for heart disease prediction. Biomed Signal Process Control. 76, 103666(2022).
- Renugadevi, G., et al. Predicting heart disease using hybrid machine learning model. J Phys Conf. 1916 (1), 012208(2021).
- Rani, P., et al. A decision support system for heart disease prediction based upon machine learning. J Reliab Intell Environ. 7 (3), 263-275 (2021).
- Fayez, M., Kurnaz, S. Novel method for diagnosis diseases using advanced high-performance machine learning system. Appl Nanosci. 11, 1-7 (2021).
- Mohri, M., Rostamizadeh, A., Talwalkar, A. Introduction. Foundations of Machine Learning. , 2nd ed, MIT Press. 1-7 (2018).
- Kelleher, J. D., Mac Namee, B., D’Arcy, A. Fundamentals of Machine Learning for Predictive Data Analytics. , MIT Press. (2020).
- Wittek, P. Quantum Machine Learning: What Quantum Computing Means to Data Mining. , Academic Press. (2014).
- Sridhar, C., et al. Optimal medical image size reduction model creation using recurrent neural network and GenPSOWVQ. J Healthc Eng. 2022, 1-12 (2022).
- Dalal, S., et al. A hybrid machine learning model for timely prediction of breast cancer. Int J Model Simul Sci Comput. 14 (4), 2341023(2023).
- Edeh, M. O., et al. Artificial intelligence-based ensemble learning model for prediction of hepatitis C disease. Front Public Health. 10, 892371(2022).
- Latha, C. B. C., Jeeva, S. C. Improving the accuracy of prediction of heart disease risk based on ensemble classification techniques. Inform Med Unlocked. 16, 100203(2019).
- Bhatt, C. M., et al. Effective heart disease prediction using machine learning techniques. Algorithms. 16 (2), 88(2023).
- Khan, A., et al. A novel study on machine learning algorithm-based cardiovascular disease prediction. Health Soc Care Community. 2023, 1-12 (2023).
- García-Ordás, M. T., et al. Heart disease risk prediction using deep learning techniques with feature augmentation. Multimed Tools Appl. 82, 1-15 (2023).
- Tiwari, A., Chugh, A., Sharma, A. Ensemble framework for cardiovascular disease prediction. Comput Biol Med. 146, 105624(2022).
- Chowdary, K. R., et al. Early heart disease prediction using ensemble learning techniques. J Phys Conf Ser. 2325 (1), 012051(2022).
- Alqahtani, A., et al. Cardiovascular disease detection using ensemble learning. Comput Intell Neurosci. 2022, 1-10 (2022).
- Naser, M. A., et al. A review of machine learning’s role in cardiovascular disease prediction: recent advances and future challenges. Algorithms. 17 (2), 78(2024).
- Vara, N. V. D. S. S., et al. AI-assisted medical imaging and heart disease diagnosis using ensemble classifiers. J Artif Intell Gen Sci. 6 (1), 210-229 (2024).
- Gnanavelu, A., et al. Cardiovascular disease prediction using machine learning metrics. J Young Pharm. 17 (1), 226-233 (2025).
- Pal, P., et al. Interactive cardiovascular disease prediction system using learning techniques. Results Control Optim. 19, 100560(2025).
Access restricted. Please log in or start a trial to view this content.