This protocol describes the essential steps for the cultivation of primary T cells, including their isolation, activation, expansion, and transient transfection by mRNA electroporation. Additionally, a workflow and antibody panel for flow cytometric analysis of phenotype, activation markers, viability, and chimeric antigen receptor (CAR) expression are proposed.
Method Article
Isolation, Cultivation, and Transient Transfection of Primary Human T Cells to Generate Chimeric Antigen Receptor (CAR) T Cells
In This Article
Summary
Abstract
To assess the efficacy and potency of chimeric antigen receptor (CAR) T cells, it is essential to isolate, activate, expand, characterize, and genetically engineer primary human T cells. Compared to common T cell lines, primary cells can provide a more realistic model system, since they are highly variable, capable of T cell-mediated killing, and able to differentiate. Here, we provide a step-by-step protocol for all essential steps for the cultivation of primary T cells, including their isolation from blood products, activation, in vitro expansion, and transient transfection. We describe differences in expansion kinetics and differentiation of primary T cells upon activation with two different reagents and provide an antibody panel for flow cytometric analysis of T cell phenotype and activation state. We offer detailed instructions for electroporation of human T cells with mRNA encoding a CAR and assessing CAR expression kinetics over time. This protocol provides recommendations on ideal timepoints for downstream potency and efficacy assays of CAR T cells and the influence of different amounts of mRNA on signal intensity. Given the transient nature of this method, it provides a rapid and easy-to-implement possibility to test and compare many CAR constructs in parallel.
Introduction
Primary human T cells represent a physiologically relevant and versatile model for studying T cell biology and for the development and evaluation of cell therapies, including CAR engineering. Unlike immortalized cell lines, T cells derived from healthy donors closely reflect the functional diversity, activation states, phenotypic diversity, and signaling dynamics of T cells in vivo, providing a more accurate representation of immune responses and therapeutic performance1,2. Moreover, the most commonly used Jurkat T cell line, which is derived from a lymphoblastic leukemia, was reported to exhibit genomic instability upon prolonged culture, a common phenomenon with cell lines.3 While T cell lines, including reporter cell lines4, can be valuable tools for early screening and enable a fast read-out, the use of primary T cells from patients more closely reflects the final application. However, the limited availability and suboptimal quality of patient-derived T cells often restrict their applicability, particularly during early stages of preclinical product development5,6,7. Using cells from healthy donors further minimizes variability introduced by disease-related immune alterations and previous treatments and allows reproducible assessment of T cell function, activation, and transgene expression across multiple donors.
Given that primary T cells are available, protocols for isolation, activation and expansion of primary T cells are critical prerequisites for their genetic manipulation and functional assays. Common activation strategies employ either magnetic beads coated with antibodies, polymeric reagents containing T cell agonists, or soluble antibody formulations. Usually, activation reagents mimic physiological T cell receptor (TCR) activation through the CD3 complex and co-stimulatory signaling through CD28, which resembles a stronger activation than solely via CD38. Activation with CD3/28 beads allows for precise control of activation strength and bead-to-cell ratio. After an initial stimulation phase, beads can either be removed or kept in the culture for continuous activation. T cells typically expand rapidly for three to four weeks before cell growth slows down. In contrast, TransAct contains a colloidal polymeric matrix, and excess reagent can simply be removed by centrifugation and exchange of the supernatant. Therefore, it provides an alternative that enables homogeneous activation in culture and resembles T cell activation with a lower stimulus compared to CD3/28 beads. However, proliferation is induced for approximately two weeks, and re-stimulation is required for longer expansion periods. After initial T cell activation with an activation reagent, T cells are cultured and expanded in vitro for one to four weeks before they can be used for experiments. Notably, the type of activation reagent, the choice of cytokines9,10,11, and the expansion period influence the absolute T cell numbers, phenotype and activation state. Typically, optimal conditions such as reagent concentration, culture density, cytokine supplementation, and expansion time should be initially tested and empirically determined to achieve robust proliferation without causing activation-induced cell death or T cell exhaustion. Here, we give a side-by-side comparison of two different activation protocols and their effect on the differentiation and activation profile of primary human T cells to support the decisions on the choice of activation reagent and timing of experiments.
Additionally, we suggest a flow cytometric panel useful for analyzing phenotypic composition and activation status of T cells, supporting experimental planning. For genetic modification of primary T cells, transient transfection using electroporation of messenger ribonucleic acid (mRNA) represents a safe, efficient, and flexible alternative to viral transduction12. While lentiviral vectors enable stable and long-term expression of transgenes, they require complex biosafety measures, involve integration into the host genome, and can lead to variable expression depending on the integration site. In addition, the production of lentiviral supernatants, followed by T cell transduction and selection of transduced cells is time-consuming. In contrast, mRNA electroporation allows rapid and transient expression of target genes without genomic integration or viral components, thereby reducing regulatory burden and enabling fast and iterative testing of constructs. This is particularly advantageous for early development stages, in which multiple CAR candidates are screened and evaluated. In recent publications, transfection with mRNA is explored as a therapeutic platform13,14,15. We suggest that transient transfection with mRNA16 is an approach that is easy to implement, especially for laboratories without the possibility to conduct lentiviral work in a biosafety level 2 (BSL-2) environment. A side-by-side comparison of different activation regiments prior lentiviral transduction is available elsewhere17.
This protocol describes the isolation, activation, cultivation, expansion, and transient transfection of primary human T cells using either anti-CD3/28 beads or TransAct for activation and mRNA electroporation for transient CAR expression. The outlined workflow enables reproducible generation of functional CAR T cells suitable for downstream applications such as cytotoxicity assays, phenotypic characterization, or in vitro modeling of adoptive T cell therapies.
Protocol
This protocol follows the ethical guidelines of the Medical University of Vienna. The ethic proposals were approved by the ethics committee of the Medical University of Vienna (1087/2025 and 1198/2025).
1. Isolation of primary T cells from blood products
NOTE: The starting material can be whole blood, apheresis product or leukocyte reduction chambers. Keep the sample at 4 °C until processing and start the isolation as early as possible, but at the latest within 24 h after sample collection. Different isolation strategies are available for T cell isolation, including negative and positive selection. Sections 1.1 and 1.2 introduce two different protocols to provide options for T cell isolation. Handling blood products should be performed in a biological safety cabinet, keeping the sample at room temperature (RT) during processing.
- Isolation of T cells by negative selection using density gradient centrifugation
- According to the kit instructions, add the required amount of the antibody cocktail per mL of sample. Incubate for the given time at RT. For the proposed human T cell enrichment kit: Use 50 µL of antibody cocktail per mL of sample and incubate for 20 min at RT (e.g., for 5 mL of sample, add 250 µL of antibody cocktail).
NOTE: For this specific kit, a minimum amount of red blood cells (RBCs) needs to be present for successful T cell isolation (the recommended minimum ratio is 100 RBCs per nucleated cell). This is typically the case when whole blood or leukocyte reduction chambers are used as starting material. For the use of apheresis product, this isolation strategy might not be successful as the RBC ratio is typically too low. Therefore, previous isolation of peripheral blood mononuclear cells (PBMCs) followed by a T cell isolation step as described in section 1.2 is recommended. - Prepare density medium (Ficoll, Pancoll or similar) in an appropriate tube. For sample volumes below 3 mL, use 3 mL of density medium (in a 15 mL centrifugation tube). For sample volumes of 4 mL and above, use 15 mL of density medium (in a 50 mL centrifugation tube).
- At the end of the incubation time, dilute the sample with an equal volume of phosphate buffered saline (PBS) containing 2% fetal bovine serum (FBS) and mix by pipetting. This corresponds to a 1:2 dilution (e.g., dilute 3 mL of sample with 3 mL of PBS with 2% FBS). Carefully layer the diluted sample on top of the density medium using a serological pipette and pipetting aid with the pipetting speed set to a minimum.
- Hold the tube at a 45° angle to increase the surface area of the density medium and support layering.
- Centrifuge the sample at 1,200 x g, RT, for 20 min. Turn off the brake of the centrifuge or set it to a minimum. After centrifugation, a white layer should be visible between the interface of the density medium and the plasma. This white cloudy ring contains the desired T cells.
- Harvest the T cells by carefully collecting the layer using either a sterile transfer pipette or a 2 mL serological pipette and transferring them to a fresh tube. Disturb the layers as little as possible to avoid carrying over the density medium or plasma.
- Continue with the section 1.3.
- According to the kit instructions, add the required amount of the antibody cocktail per mL of sample. Incubate for the given time at RT. For the proposed human T cell enrichment kit: Use 50 µL of antibody cocktail per mL of sample and incubate for 20 min at RT (e.g., for 5 mL of sample, add 250 µL of antibody cocktail).
- Isolation of T cells by positive selection using a gravity flow kit
- Perform a density gradient isolation step to extract PBMCs from the sample: Prepare density medium according to section 1.1.2. Dilute the sample with an equal volume of PBS with 2% FBS. This corresponds to a 1:2 dilution (e.g., dilute 3 mL of sample with 3 mL of PBS + 2% FBS).
- Carefully layer the diluted sample on top of the density medium using a serological pipette and pipetting aid with the pipetting speed set to a minimum. Hold the tube at a 45° angle to increase the surface area of the density medium and support layering.
- Centrifuge at 400 x g, RT, for 30 min with the break switched off or set to a minimum. After centrifugation, a white layer should be visible at the interface of the density medium and the plasma. This white cloudy ring contains the PBMCs, as their density is lower than the density of RBCs.
- Harvest PBMCs by carefully collecting the white cloudy layer and transferring them to a fresh tube. Use a sterile transfer pipette or a 2 mL serological pipette for this step and disturb the layers as little as possible.
- Wash the collected cells: Add 20 mL of PBS with 2% FBS. Count the cells and calculate the total cell number. Centrifuge at 300 x g, 4 °C, for 10 min, with the break turned on. From now on, keep the cells on ice and work with cooled reagents.
- Pipette off the supernatant. The following calculations are used for up to 1 x 10⁷ cells and can be scaled up accordingly. Resuspend the cell pellet in 80 µL of PBS with 0.5% bovine serum albumin (BSA) and 2 mM ethylenediaminetetraacetic acid (EDTA).
- Mix 10 µL of CD4 microbeads with 10 µL of CD8 microbeads. Add the bead mixture to the resuspended PBMCs. Mix well and incubate for 15 min at 4 °C.
- In the meantime, place the gravity flow column in the magnetic field of an appropriate separation device. Prepare the column by rinsing it with 3 mL of PBS with BSA and EDTA.
- After the incubation step, wash cells by adding 2 mL of PBS with BSA and EDTA. Centrifuge at 300 x g, 4 °C, for 10 min. Discard supernatant and resuspend up to 10⁸ cells in 500 µL of PBS with BSA and EDTA.
- Apply the cell suspension onto the column. The labeled cells are retained in the column by the magnetic separation device. The flowthrough contains unlabeled cells (CD4 and CD8 double-negative PBMCs) and can be collected if desired. Wash the column 3x by rinsing it with 3 x 3 mL of PBS with BSA and EDTA. Add a new buffer as soon as the column is empty.
- To elute labelled cells, remove the gravity flow column from the magnetic separator and place its outlet above a fresh collection tube. Pipette 5 mL of PBS containing BSA and EDTA onto the column, then push the plunger firmly into the column to elute the cells. Continue with section 1.3.
NOTE: Magnetic antibody kits are available as pan T cell kits as well as for specific T cell subsets and can be either positive or negative selection kits. In each case, labelled cells are retained by the magnetic separation device. For positive selection, T cells (or their subsets) are labelled with magnetic beads via their cognate antibody. For negative selection, all cells that do not belong to the specified T cell population are labelled with magnetic beads. T cells are therefore found in the flow-through.
- Freezing of isolated T cells
- Wash T cells with 20 mL of PBS with 2% FBS. Centrifuge at 300 x g, RT, for 10 min. The break can be turned on again. Discard the supernatant.
- Resuspend cells in 5-10 mL of PBS with 2% FBS. To use cells directly for cultivation, proceed with the section 2.4. To freeze cells, proceed with the following section.
NOTE: Freezing of cells is not required if the isolated T cells are used immediately for activation and cultivation. - Count the resuspended cells and centrifuge at 300 x g, 4 °C, for 10 min. In the meantime, calculate the number of cells to be frozen. One T cell aliquot should contain 5-20 x 106 cells. Prepare the required number of labelled cryo-vials as well as the freezing medium (see Table 1).
- After centrifugation, discard the supernatant and pipette off the remaining liquid. Work quickly from now on.
- Resuspend the cell pellet in 1 mL of pre-cooled freezing medium for each aliquot (e.g., if five aliquots are prepared, resuspend the pellet in 5 mL of freezing medium). Aliquot 1 mL cell suspension into each cryo-vial. Freeze the cryo-vials immediately at -80 °C.
NOTE: Freezing at a controlled rate is recommended. To achieve this, use appropriate freezing containers. Transfer the cells to liquid nitrogen after freezing at -80 °C (e.g., on the next day or within two weeks).
| Component | Final concentration |
| Dimethyl Sulfoxide | 10 % (v/v) |
| Fetal Bovine Serum | 45 % (v/v) |
| RPMI 1640 with phenol red | 45 % (v/v) |
Table 1: Composition of the freezing medium. The freezing medium is used to preserve cell integrity and viability during freezing and storage.
2. Thawing, activation, and expansion of primary T cells
- Perform all steps under sterile working conditions using a biological safety cabinet.
- Pre-warm Roswell Park Memorial Institute (RPMI) 1640 medium without additives at 37 °C and transfer 20 mL into a centrifuge tube. Thaw an aliquot of frozen T cells by quickly subjecting the tube to warm water. Stop thawing when a small ice pellet is still visible within the cryo-vial.
- Immediately add 1 mL of pre-warmed RPMI to the cell suspension and carefully transfer it to the centrifuge tube. Rinse the cryo-vial with 1 mL of RPMI. Avoid additional resuspension steps, which would subject the cells to shear stress.
- Centrifuge cells at 300 x g, RT, for 5 min. Discard the supernatant. Resuspend the cell pellet in full T cell medium. Full T cell medium consists of RPMI 1640 with 10% FBS, 1% Penicillin/Streptomycin, 5 ng/mL Interleukin 7 (IL-7), and 10 ng/mL Interleukin 15 (IL-15) (see Table 2).
- Count the resuspended cells. Seed cells in full T cell medium at a density of 1 x 10⁶ cells/mL in an appropriate well plate. Add the required amount of activation reagent, as indicated in the respective manual. For example, to activate 1 x 10⁶ cells, seed cells in 1 mL of full T cell medium in a 24-well plate. Add either 25 µL of CD3/28 beads or 10 µL of TransAct reagent.
NOTE: If cells are not dense enough (i.e., the cell count is below 1 x 10⁶ cells/mL), centrifuge again with the same conditions as before. Resuspend pellet in the appropriate amount of full T cell medium to reach a density of 1 x 10⁶ cells/mL. - Incubate cells at 37 °C in an incubator with a 5% CO2 environment for up to three weeks. Count cells every 2-3 days and adjust the density to 0.3-0.5 x 10⁶ cells/mL by adding fresh full T cell medium. Cell density should not exceed 1.5 x 10⁶ cells/mL, since primary T cells might not return to the exponential growth phase if they are cultured to high densities.
NOTE: Especially in the first days after activation, macroscopic cell clusters might be visible (see Figure 2D). This is expected, as cells cluster around the activation reagent when proliferation is initialized. Generally, cells will be ready to use approximately one week after activation. However, the timing depends on the experimental setup and the required number of cells. It is recommended to use T cells always within the same range after activation for biological replicates (i.e., 9-12 days post activation).
| Component | Final concentration |
| Fetal Bovine Serum | 10 % (v/v) |
| Interleukin 15 (IL-15) | 10 ng/mL |
| Interleukin 7 (IL-7) | 5 ng/mL |
| Penicillin/Streptomycin 10,000 U/mL | 1 % (v/v) |
| RPMI 1640 with phenol red | NA |
Table 2: Composition of full T cell medium. Medium used for the cultivation of primary human T cells after activation.
3. Staining for phenotype and activation markers
- Count T cells. Use 0.1 x 10⁶ cells per staining reaction. Calculate the required volume of cell suspension and transfer it to an appropriate polystyrene round-bottom tube.
NOTE: The number of stained cells can be decreased to a minimum of 50,000 cells if needed. Staining more cells than the required amount is possible, as long as the antibodies are in molar excess, as described previously18,19. - Wash cells once by directly adding 1 mL of staining buffer, consisting of PBS with 0.5% FBS. Centrifuge at 300 x g, 4 °C, for 5 min. From now on, keep cells on ice and work with cooled reagents.
- In the meantime, prepare one antibody master mix for all tubes as described in Table 3. Dilute the antibodies to the final concentration in staining buffer. Staining is performed in a volume of 50 µL per tube. Mix well, for example, by vortexing.
NOTE: This protocol may be combined with other staining experiments, such as the staining for CAR expression as described in section 6. A live/dead staining dye can be added to aid in gating for live cells. In this case, the emission spectra need to be picked accordingly to avoid overlap with the other fluorophores used. - After centrifugation, discard the supernatant and pipette off the remaining liquid. Resuspend each pellet in 50 µL of the antibody master mix.
- Incubate the tubes at 4 °C in the dark for at least 30 min. This incubation step can be prolonged up to several hours.
- Wash cells by adding 1 mL of staining buffer directly to the staining reaction. Centrifuge at 300 x g, 4 °C, for 5 min and discard the supernatant. Repeat this section with the same conditions. After the second washing step, discard the supernatant, leaving a small amount of residual buffer in the tubes to prevent the cells from drying.
- Keep the stained cells pelleted and on ice until measurement. Resuspend the pellet in 100 µL of staining buffer just before measurement.
NOTE: This protocol is optimized for staining conducted in 5 mL round-bottom tubes. Staining in 96-well plates is also possible using a slightly adapted protocol. Since plates have a lower working volume, two 200 µL washing steps before staining are advised. If more than 50 µL cell suspension is seeded per well, pellet cells and discard supernatant before proceeding to the washing steps. Staining is also performed in 50 µL per well. After staining, conduct three instead of two washing steps with 200 µL staining buffer. Centrifugation is performed with the same settings as described above.
| Laser color | Laser λ (nm) | Emission filter | Filter range (nm) | Fluorescent dye | Antigen | Final dilution | Marker type |
| Violet | 405 | 450/45 | 427.5–472.5 | VioBlue | CD45 | 1:100 | Pan leukocyte |
| Violet | 405 | 525/40 | 505–545 | VioGreen | CD69 | 1:50 | Activation |
| Violet | 405 | 610/20 | 600–620 | Vio Bright V600 | CD45RA | 1:100 | Phenotype |
| Blue | 488 | 525/40 | 500–545 | FITC | CD8 | 1:100 | Phenotype |
| Blue | 488 | 690/50 | 665–715 | PerCP–Vio 700 | CD154 | 1:50 | Activation |
| Yellow/ green | 561 | 585/42 | 564–606 | PE | CD134 | 1:50 | Activation |
| Yellow/ green | 561 | 675/30 | 660–690 | PE–Vio 670 | CD3 | 1:100 | Pan T Cell |
| Yellow/ green | 561 | 780/60 | 750–810 | PE–Vio 770 | CD25 | 1:50 | Activation |
| Red | 638 | 660/20 | 650–670 | APC | CD137 | 1:50 | Activation |
| Red | 638 | 712/25 | 699.5–724.5 | Vio Bright R720 | CD62L | 1:100 | Phenotype |
| Red | 638 | 780/60 | 750–810 | APC–Vio 770 | CD4 | 1:100 | Phenotype |
Table 3: Overview of the antibody panel and proposed fluorophores for analysis of primary T cell expression of phenotype and activation markers. A flow cytometer with at least 4 lasers and the corresponding filter setup is needed to perform this experiment. If the device setup differs, fluorophores need to be adjusted accordingly.
4. In vitro transcription of CAR-encoding DNA to generate mRNA
- Design a suitable DNA template for in vitro transcription (IVT) into mRNA. Include a T7 promoter for the T7 RNA polymerase, a Kozak sequence, a start codon, a signal peptide sequence, the desired CAR sequence, and a stop codon (Figure 1).
NOTE: The Kozak sequence is a recognition motif that is critical for the initiation of protein translation by supporting correct assembly of a start codon by the ribosome. The signal peptide is required for the correct processing of the CAR in the Golgi and incorporation into the plasma membrane. To detect CAR expression, it is helpful to include a tag on the extracellular portion of the CAR (e.g., a DYKDDDDK tag or a MAP tag). Some CARs might also be detected using their soluble cognate antigen conjugated with a fluorophore, or antibodies against other common structures, such as the scFv linker domain (e.g., anti-G4S linker antibody or anti-Whitlow linker antibody). - Amplify DNA by polymerase chain reaction (PCR) using primers flanking the CAR construct, including the T7 promoter. For the IVT, 1 µg of the CAR-DNA is needed. Verify the correct length of the PCR product by performing analytical agarose gel electrophoresis. Purify the PCR product by column purification using a PCR and DNA cleanup kit before proceeding to IVT. DNA can be stored at -20 °C.
NOTE: It can be beneficial to include 5-10 random nucleotides in the primer regions before and after the transcript to achieve better binding of the polymerase. Since a large amount of DNA is needed for the IVT, the volume of the PCR reaction can be scaled up accordingly. - Use an IVT kit including a poly (A) tailing step to generate polyadenylated mRNA. Perform IVT in a biological safety cabinet and clean surfaces thoroughly with disinfectant. Follow the kit instructions to conduct the IVT.
NOTE: Elongating the transcription step up to several hours may increase mRNA yield. The duration of the polyadenylation step should be kept constant across samples, as it directly influences the length of the poly (A) tail. This can, in turn, influence mRNA stability and expression efficiency in vivo20. - Purify mRNA using a column-based RNA cleanup kit and determine the concentration of purified mRNA using an appropriate device.
NOTE: There are several ways to assess the quality of transcribed mRNA, including analytical gel electrophoresis before and after the poly (A) tailing step and absorbance ratio-based methods for determining mRNA concentration. The recommended A260/230 ratio is 2.0-2.2; values below 1.8 indicate contamination and potential poor performance in expression tests. The importance of mRNA modifications and purification prior to electroporation is described elsewhere21,22,23. - Aliquot 3-5 µg of purified mRNA (the final amount of mRNA that will be used in experiments for one electroporation) and store aliquots at -80 °C. Avoid repeated freeze-thaw cycles.

Figure 1: Schematic representation of the DNA template components needed for the generation of an mRNA for T cell transfection. The template DNA for IVT should contain a T7 promoter, the Kozak sequence, a start codon followed by a signal peptide to enable secretion of the protein to the extracellular space, the desired CAR sequence, and a stop codon. Abbreviations; mRNA = messenger ribonucleic acid; DNA = deoxyribonucleic acid; CAR = chimeric antigen receptor; IVT = in vitro transcription. Please click here to view a larger version of this figure.
5. Transient transfection of primary T cells by mRNA electroporation
- One day prior to the transfection, dilute T cells to a density of 0.3 x 10⁶ cells/mL in full T cell medium (see Table 2). The cells should be in the exponential growth phase on the day of transfection (i.e., at a density below 1 x 10⁶ cells/mL) for efficient CAR expression.
- On the day of the transfection, pre-warm all required media at 37 °C.
- Count the T cells and calculate the required volume. Use 1-5 x 10⁶ cells for each CAR-mRNA.
NOTE: It is advised to always include a "MOCK" transfection (i.e., T cells that undergo the transfection procedure, but without adding mRNA). These cells can also be used as negative controls for staining and experiments. Keep the cell number constant within an experiment. - Transfer the required volume of T cell suspension into a conical centrifuge tube. Centrifuge at 300 x g, RT, for 5 min. Discard the supernatant. All centrifugation steps in the following sections are repeated under these conditions.
NOTE: If the required volume exceeds the capacity of a single conical centrifuge tube, it can be split into equal parts across two or more tubes. In this case, resuspend all pellets in a total volume of 20 mL RPMI medium and pool them during the first washing step (section 5.6). - Prepare full T cell medium in an appropriate well plate for the recovery of the T cells after the electroporation.
NOTE: Use these considerations for calculation: The cells should be seeded at a density of approximately 0.5-1.0 x 10⁶ cells/mL after electroporation. Approximately 1/3 to 1/2 of the cells die during or after electroporation. For example, if 2 x 10⁶ cells are used per electroporation, a minimum of 1 x 10⁶ cells is expected to remain. To reach the required cell density, use 2.0 mL of full T cell medium (in a 12-well plate). Pre-warm the plate containing the T cell medium at 37 °C until electroporation is performed. - Perform the first washing step with 20 mL of RPMI with phenol red and without supplements. Pipette RPMI on top of the cells, centrifuge at 300 x g, RT, for 5 min, and discard supernatant.
- Perform the second washing step with 20 mL of RPMI without phenol red and without supplements as described above.
NOTE: If T cells from several donors are used for electroporation, the cells can be prepared in parallel until section 5.8. Use only one T cell batch to perform the last washing step (section 5.8). Leave the other cells pelleted without discarding the supernatant and proceed with the last washing step when the first round of electroporation is finished. - Perform the third washing step with 20 mL of reduced serum medium as described above.
- During the last centrifugation step, collect all required mRNA aliquots from the freezer and keep them on ice. Label the electroporation cuvettes and the plate with the pre-warmed media.
- Set up the conditions on the electroporation device. Here, a Gene Pulser Xcell total system is used. The protocol settings for primary T cells should be:
Square Wave Protocol: Voltage: 500 V, number of pulses: 1, Pulse length: 5 ms, Pulse interval: 0, Cuvette diameter: 4 mm
NOTE: This protocol is optimized for primary T cells. Other cell types might require adaptation of the settings, especially the pulse length. - Discard supernatant thoroughly by pipetting off remaining liquid without disturbing the pellet. Resuspend the cell pellet in 100 µL of reduced serum medium per electroporation (e.g., if five electroporations are performed, resuspend the pellet in a total volume of 500 µL).
- Use 100 µL of the T cell suspension and 3-5 µg of the mRNA per electroporation. Only prepare one electroporation at a time. Add the T cell suspension to the mRNA-containing tube, mix gently. Avoid pipetting up and down. Work swiftly from now on.
NOTE: The volume of the added mRNA should not exceed 10 µL. The amount of mRNA can be adjusted if necessary. When comparing CARs or experiments, always use the same number of cells and mRNA for each electroporation. This is important, since the amount of mRNA is directly linked to CAR expression levels (see Figure 5). - Transfer the mRNA/T cell mix to an electroporation cuvette. Ensure that the suspension covers the bottom of the cuvette. Do not pipette up and down.
- Quickly transfer the cuvette containing the mRNA/T cell mix to the electroporation device and perform electroporation with the settings as prepared in section 5.11.
- After electroporation, carefully recover the T cells in pre-warmed full T cell medium by adding 100 µL of medium from the well plate to the cuvette, then transferring the cells back to the plate. Rinse cuvette with 100 µL of medium.
NOTE: Cells are sensitive to shear stress after electroporation. Avoid repeated resuspension steps. - Repeat sections 5.12 to 5.15 for all mRNA constructs.
- Incubate transfected T cells at 37 °C with 5% CO2. If another T cell batch is prepared, continue with section 5.8 with this batch now.
- Perform the respective experiment within 24 h.
NOTE: CAR expression will be detectable as early as 3-6 h after electroporation. Peak expression levels and kinetics may depend on the mRNA construct and should be tested in preliminary experiments. Detailed protocols describing possible downstream potency assays, such as the analysis of CAR T cell cytotoxicity or cytokine secretion levels upon co-culture with tumor target cells, are available elsewhere23,24,25,26,27.
6. Analysis of CAR expression after electroporation
- 6-24 h after electroporation, resuspend and count T cells. Use 50,000-100,000 cells per staining reaction. Transfer the required volume of cell suspension to an appropriate polystyrene round-bottom tube. The following sections may be performed outside of a biological safety cabinet.
- Wash cells by adding 1 mL of staining buffer, consisting of PBS with 0.5% FBS. Centrifuge at 300 x g, 4 °C, for 5 min. From now on, keep cells on ice and work with cooled reagents.
- Prepare a master mix with all antibodies used in the staining panel. Include an antibody that enables CAR-detection (for example, through an incorporated peptide-tag such as a DYKDDDDK-tag). Dilute the antibodies as recommended in a final staining volume of 50 µL (e.g., to obtain a 1:50 dilution, 1 µL of antibody is added to 49 µL of buffer for each tube).
NOTE: Staining for CAR expression may be performed solely with a CAR-detection antibody or combined with phenotypic and activation marker staining. The antibody, as well as the conjugated fluorophore, can be adjusted. When exchanging antibodies and/or fluorophores, consider the respective excitation and emission spectra. APC is compatible with the proposed 7-aminoactinomycin D (7-AAD) dye for concurrent viability staining. - After centrifugation, discard the supernatant thoroughly by pipetting off residual liquid without disturbing the cell pellet. Resuspend each pellet in 50 µL of the prepared antibody mix.
- Incubate the tubes at 4 °C in the dark for at least 30 min. This incubation step can be prolonged up to several hours.
- Wash the cells by adding 1 mL of staining buffer directly to the tube. Centrifuge at 300 x g, 4 °C, for 5 min and discard the supernatant thoroughly by pipetting off residual liquid. Resuspend the cell pellets in 100 µL of staining buffer per tube.
- Before starting the measurement, add 2 µL of 7-AAD solution to the tubes and mix well. Incubate for 10 min at RT in the dark. Proceed to measurement immediately.
NOTE: Do not incubate cells with 7-AAD for more than 15 min, as this may skew the results. To achieve homogeneous incubation times, consider adding 7-AAD either sequentially or in batches. This protocol is optimized for staining conducted in 5 mL round-bottom tubes. Staining in 96-well plates can also be performed using a slightly modified protocol. Since plates have a lower working volume (a maximum of 250 µL), two washing steps with 200 µL of buffer before staining are advised. If more than 50 µL of cells are seeded per well, pellet the cells and discard the supernatant before proceeding to the washing steps. Staining is also performed in 50 µL per well. After incubation, perform two washes with 200 µL staining buffer. Centrifugation is performed with the same settings as described above.
Results
Activation and expansion of primary human T cells
Primary T cells were thawed and activated on day 0 with either CD3/28 beads or TransAct, expanded for 23 days, and counted every 2-3 days (Figure 2A). On counting days, cell densities were adjusted to 0.3-0.5 x 10⁶ cells/mL. On days 0/2/5/9/14/20, T cells were used for flow cytometric analysis to assess the phenotype and expression of activation markers. Within the first week after activation, T cells proliferated and expanded rapidly with both activation reagents (Figure 2B), with a slightly lower fold-expansion for the following days for T cells activated by TransAct (Figure 2C). Notably, activation of T cells was also visible by microscopic analysis, with T cell clusters forming around the activation reagents (Figure 2D).
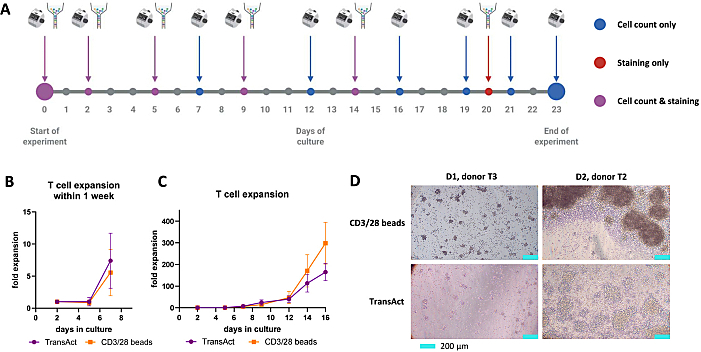
Figure 2: Activation and expansion of primary T cells using two different activation reagents. (A) Schematic representation of the experimental timeline. Cells were activated either with CD3/28 beads or TransAct on day 0 and cultured for 23 days. Blue dots depict days where the cells were counted, red dots depict days where the cells were analyzed by flow cytometry, and purple dots depict days where both analyses were performed. (B) and (C) Expansion of primary T cells during (B) the first week or (C) within 16 days of culture. Values depict the mean ± standard deviation of 4 (CD3/28 beads) or 3 (TransAct) different healthy T cell donors. (D) Representative microscopic images of activated T cells with visible cell clustering on days 1 and 2 after activation. Images were taken with an inverted microscope. The ruler corresponds to 200 µm. Please click here to view a larger version of this figure.
Staining of T cell phenotype and activation markers
For flow cytometric analysis, the following gating strategy was applied (Figure 3): A first gate (FSC-Height vs. SSC-Height) was applied to remove cell debris and beads, followed by gating for single cells (FSC-Width vs. SSC-Area). The percentage of CD3+ cells should be in the range of 98-100%. Further sub-gating yielded the percentage of CD4+ (helper) T cells and CD8+ (cytotoxic) T cells, which were further gated for different phenotypic T cell subsets using the markers CD45RA and CD62L. CD3+ T cells were additionally analyzed for the expression of activation markers (CD25/CD69/CD134/CD137/CD154).
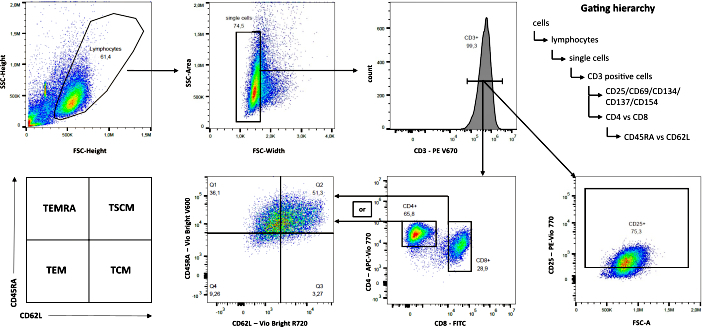
Figure 3: Gating strategy for flow cytometric analysis. Representative dot plots of one T cell donor activated with CD3/28 beads on day 5 are shown (n = 4). Abbreviations; TEMRA = T effector memory cells re-expressing CD45RA; TSCM = stem cell-like memory T cells; TEM = effector memory T cells; TCM = central memory T cells. Please click here to view a larger version of this figure.
After activation with CD3/28 beads, the percentage of CD4+ T cells compared to CD8+ T cells decreased over time, with 74.3% (± 7.4%) of CD4+ T cells on day 5, which decreased to 14.6% (± 3.4%) on day 20 after activation. CD8+ T cells increased from 20.7% (± 6.4%) on day 5 to 82.4% (± 3.1%) on day 20 (Figure 4A). Similar trends were detected after activation with TransAct, with slightly lower percentages of CD8+ T cells on day 20 (72.5% ± 0.7%). Therefore, the slightly slower T cell expansion that was observed after activation with TransAct corresponded to a lower percentage of CD8+ and a higher percentage of CD4+ cells during the expansion period. The differences in T cell phenotypic composition were similar with both activation reagents (Figure 4B). However, the frequencies of T effector memory cells re-expressing CD45RA (TEMRA) were overall higher for CD8+ cells than for CD4+ cells. Concordantly, CD4+ T cells showed higher percentages of central memory T cells (TCM) and stem-cell-like memory T cells (TSCM) (Figure 4B).
CD134 was the only activation marker that was already upregulated after thawing of T cells, with 37.6% (± 4.1%) CD134+ T cells activated with CD3/28 beads and 36.1% (±4.4%) CD134+ T cells for TransAct-activated T cells (Figure 4C). In both activation strategies, CD25, CD69, and CD134 were highly upregulated by day 2. For CD3/28 beads, CD69 and CD134 expression reached their peak on day 2, while CD25 peaked on day 5. Similar results were seen for TransAct-activated T cells. CD134 and CD154 were upregulated only on day 14 for both CD3/28 beads and TransAct-activated cells. Overall, the observed trends were very similar between the two activation reagents. However, CD69 expression on day 14 was slightly higher in CD3/28-activated T cells than their TransAct counterparts (97.1% ± 0.9% versus 86.5% ± 5.1%). This corresponds to the prolonged high expansion rate seen with CD3/28 bead-activated cells. To sum up, the proposed activation marker panel includes markers that are upregulated both at early and later timepoints after activation, with varying sensitivity between the different activation markers, but overall, similar trends for both activation reagents.
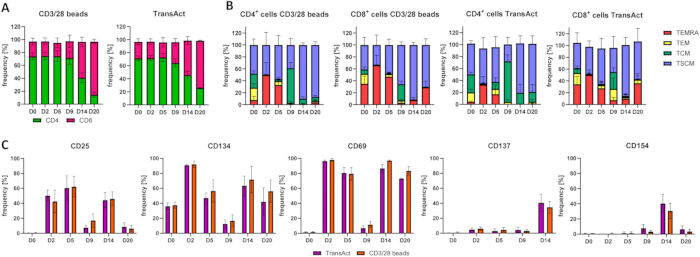
Figure 4: Analysis of T cell phenotype and activation marker expression with different activation reagents during a cultivation period of 20 days. (A) Percentages of CD4+/CD8+ T cells during cultivation after activation with CD3/28 beads (left) or TransAct (right). (B) T cell differentiation after activation with CD3/28 beads (two left panels) or TransAct (two right panels), each for either CD4+ or CD8+ cells. The phenotype was assessed using the markers CD45RA and CD62L. TEMRA: CD45RA+ CD62L-, TEM: CD45RA- CD62L-, TCM: CD45RA-CD62L+, TSCM: CD45RA+ CD62L+. (C) Expression of activation markers after activation with CD3/28 beads or TransAct and during the expansion period. Frequencies [%] of the parent population CD3+ T cells are shown (mean ± standard deviation of 4 [CD3/28 beads] or 3 [TransAct] different healthy T cell donors). Abbreviations; TEMRA = T effector memory cells re-expressing CD45RA; TSCM = stem cell-like memory T cells; TEM = effector memory T cells; TCM = central memory T cells. Please click here to view a larger version of this figure.
Transient transfection of primary T cells and analysis of CAR expression
Primary T cells were transfected with mRNA by electroporation on day 7 after activation with either CD3/28 beads or TransAct. As a template, mRNA encoding for a second-generation CAR targeting chondroitin sulfate proteoglycan 4 (CSPG4) with a CD28 co-stimulatory and a CD3ζ signaling domain was used. A DYKDDDDK-tag (flag-tag) was included to enable flow-cytometric detection. T cell viability and CAR expression were assessed 3, 6, 24, and 48 h after electroporation. Staining was performed as described in protocol section 6.
Although the viability of both CD3/28 bead- and TransAct-activated T cells was low 3 h after electroporation, overall, the viability of transfected CAR T cells ranged from 51-85% and did not differ significantly between the two activation strategies (Figure 5A). The CAR was detectable already at this early point after electroporation. Although the percentage of CAR+ cells gradually decreased over time, the highest frequency of CAR+ cells was detectable within 24 h after electroporation (Figure 5B, left panel). Notably, the signal intensity was stable within the first 6 h after electroporation and gradually decreased afterwards (Figure 5B, right panel). CAR expression was almost absent after 48 h, demonstrating the transient nature of cell manipulation and the importance of choosing an early time window for downstream assays. Representative dot plots for CAR-expression of one donor are shown in Figure 5C. For both activation reagents, the CD4/CD8 ratio did not differ between CAR and MOCK-transfected cells (Figure 5D). Consistent with our previous results, T cells activated with CD3/28 beads showed a slightly higher frequency of CD8+ T cells than cells activated with TransAct. For the phenotypic analysis, one representative donor is shown due to large donor-dependent variations (Figure 5E). While both the activation reagent and CD4/CD8 state influence the T cell phenotype, CAR expression does not cause a change in phenotype compared to MOCK-transfected cells.
To assess the influence of mRNA concentration on expression levels, primary T cells were transfected with mRNA encoding for a mutant version of GFP (muGFP) using 0.1, 0.3, 1, 3 or 6 µg of mRNA. The GFP signal was measured by flow cytometry 24 h after electroporation. As expected, already as little amounts of mRNA as 0.1 µg led to a detectable GFP signal, with a gradual increase of signal intensity with increasing mRNA amounts. In our experiments, 1 µg of mRNA was already saturating, and larger amounts (3 and 6 µg of mRNA) did not lead to an increased GFP signal (Figure 5F). This highlights the possibility of using varying amounts of mRNA to titrate expression levels, which can be beneficial for testing the influence of different CAR- or even target antigen expression levels28.
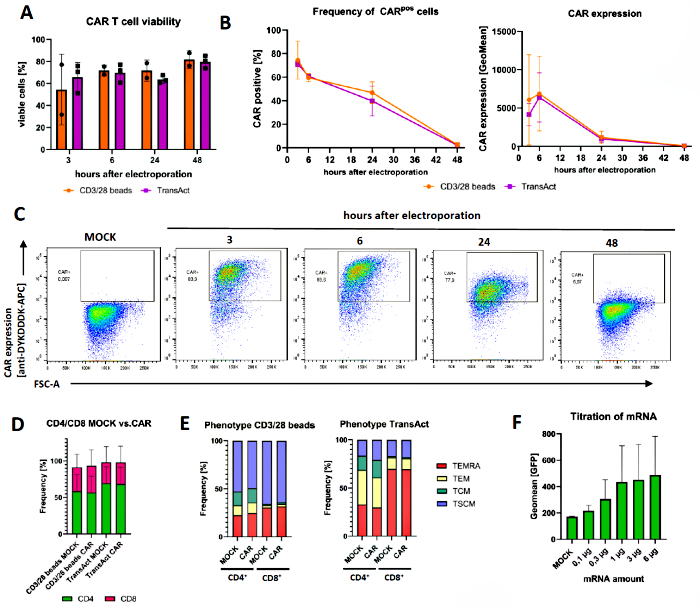
Figure 5: Expression kinetics of CARs and phenotype analysis of transfected CAR T cells. (A) Viability of CAR T cells after electroporation with CAR-encoding mRNA. 2 µL of 7-AAD in 100 µL of staining buffer was used to assess viability after 10 min incubation. n = 2-3 individual donors (B) Staining for CAR expression with an anti-DYKDDDDK antibody (conjugated with APC, 1:50 final dilution). After gating on viable cells, either the percentage of CAR-positive cells in relation to MOCK-transfected controls (left panel) or the geometric median fluorescence intensity (GeoMean, right panel) of the whole population was analyzed. Shown are averages of n = 3 individual donors ± S.D. (C) Representative dot plots of one donor from (B) demonstrating the kinetics of CAR expression over time. (D) Analysis of CD4+/CD8+ T cells and comparison of MOCK-transfected with CAR-transfected T cells and two different activation strategies 24 h after electroporation. Shown are averages of n = 3 individual donors ± S.D. (E) Phenotypic analysis of MOCK-transfected and CAR-transfected T cells shown in (B) 24 h after electroporation. Shown is one representative donor of n = 3. (F) Analysis of muGFP expression 24 h after electroporation with different amounts of mRNA. Gating for live cells was performed before the GeoMean for GFP was quantified. Shown are averages of n = 3 donors ± S.D. Abbreviations; CAR = chimeric antigen receptor; mRNA = messenger ribonucleic acid; 7-AAD = 7-aminoactinomycin; RT = room temperature; muGFP = mutant green fluorescent protein; S.D. = standard deviation. Please click here to view a larger version of this figure.
Discussion
Isolation and cultivation of primary human T cells provide the foundation for in vitro and in vivo studies. It is well-established that upon activation and in vitro expansion, T cells differentiate into an effector-like phenotype, and that the choice of cytokine supplements strongly impacts those differentiation fates9. CAR T cells cultured with IL-7 and IL-15 demonstrated improved persistence and better anti-tumor activity in mouse models compared to T cells expanded with IL-229. Therefore, the choice of both activation reagents and cytokine supplements is important to yield T cells with the desired phenotype. We compared two activation reagents (CD3/28 beads and TransAct), that differentially influence T cell expansion kinetics, yield, and the CD4/CD8 ratio, over an expansion period of three weeks. In general, T cells expanded after CD3/28 bead activation showed a higher percentage of CD8+ and lower frequencies of CD4+ cells than after TransAct activation. As CD8⁺ T cells preferentially differentiate towards an effector-like TEMRA phenotype, reagent selection is a key variable that should match the goals of the experiment. In addition to phenotypic surface markers, the upregulation of activation markers yields information about the T cell state and effector functions. Both CD25 and CD69 are sensitive activation markers and are typically upregulated at early time-points after activation. They are commonly used to assess activation of T cells, but also other cell types, such as natural killer (NK) cells30,31,32. In contrast, the activation markers CD137 and CD154 showed lower expression in expanded T cells, highlighting their potential to assess specific upregulation in CAR T cells upon co-culture with target cells. Notably, when applying the activation marker panel to assess CAR T cell activity upon co-culture with target cells (i.e., tumor cells), a careful choice of activation markers is required to avoid high background expression of those markers on T cells even in the absence of target cells.
When working with primary T cells, one should be aware that their expansion and differentiation profiles are highly donor dependent. However, storage of the initial sample at 4 °C prior to T cell isolation and a short handling time overall improve the yield and the quality of isolated cells. Cell viability is influenced by the duration of freezing and thawing steps, since the freezing medium contains cryoprotectants such as dimethyl sulfoxide (DMSO). While DMSO is crucial for preserving cellular structures upon freezing, it is toxic to cells at room temperature. Therefore, fast handling and dilution of DMSO after thawing are required. When electroporating T cells, the cells are most sensitive after the electric pulse, which aims to make the cell wall permeable for mRNA. Handling the cells with care by avoiding additional shear stress and working with pre-warmed solutions may greatly increase cell recovery and viability. It can be beneficial to add a positive control mRNA, such as a CAR of known expression or a reporter protein such as GFP, when testing a new CAR construct. It is further recommended to include at least MOCK transfected cells (i.e., cells electroporated without mRNA) as negative control. For functional assays, mRNA encoding for a CAR directed against a different target may be used to assess CAR specific activation.
Since expression kinetics may depend on the mRNA sequence, assessing the kinetics individually is a valuable tool for choosing the ideal time point for the conduction of downstream assays. This transfection method is primarily intended as a rapid, easy way to screen multiple CAR constructs in parallel. Due to the short timeframe during which the CAR is expressed on the T cell surface, long-term assays cannot be conducted. However, from preliminary transfection experiments, one can determine the best CAR design to proceed to viral transduction, if desired.
Finally, antibodies or their conjugated fluorophores may be exchanged to fit the experimental setup. However, it is crucial to consider the respective excitation and emission spectra of the fluorophores to interpret the results reliably. Moreover, single staining with one antibody at a time can be conducted in preliminary experiments to assure correct compensation of a multi-color panel. While we did not require spectral compensation for the proposed antibody panel, it might be necessary to set up a compensation matrix when the panel is changed.
The presented IVT and electroporation protocol offers a simple and flexible alternative to viral transduction for introducing CAR constructs into primary human T cells. Because it relies entirely on RNA-based delivery, it can be performed in laboratories without access to BSL-2 infrastructure, significantly lowering the barrier for CAR T cell research. Although viral transduction is very efficient and is predominantly used in the CAR field, it is accompanied by safety concerns related to genomic integration, a potential cause of secondary malignancies, as well as labor and cost-intensive production33,34. Moreover, the transient nature of CAR expression makes this approach particularly suitable for rapid, parallel screening of multiple CAR designs35, allowing researchers to compare construct performance in a high-throughput manner. The drawback of this method is the limited time of CAR expression, which typically peaks around 6-12 h after electroporation22,24,35,36. With transient transfection, long-term cultures, such as repeated stimulation assays, cannot be performed due to CAR downregulation. However, we suggest identifying the most promising CAR construct(s) with mRNA electroporation before considering moving to stable expression systems with a limited number of candidates.
Electroporation of mRNA into primary cells is a versatile technology to express proteins such as antigens in different cell types, including PBMCs, T cells, B cells, NK cells, and dendritic cells37. Notably, another possibility for transient CAR delivery are lipid nanoparticles (LNPs)36,38, which allow the delivery of CAR-encoding mRNA or DNA into T cells without viral vectors and enables integration-free CAR expression. In contrast, the Sleeping Beauty transposon system39,40,41 achieves stable integration without the requirements of viral components. The most suitable choice of T cell transfection or transduction depends on the intended application and considerations for scalability and manufacturing. mRNA-based CAR T cells have been successfully used in preclinical and clinical studies against a variety of different entities, including hematological and solid malignancies and autoimmune diseases42,43,44. Transiently expressed CARs offer advantages compared to stably expressed CARs, since the limited surface expression can prevent or reduce side effects25.
In summary, this workflow provides a straightforward, step-by-step protocol for the isolation, activation, cultivation, analysis, and transfection of primary T cells to generate CAR T cells. It is simple to implement, does not require BSL-2 laboratory facilities, and can be readily integrated into laboratories equipped with standard molecular biology and cell culture facilities.
Disclosures
The authors declare no conflict of interest.
Acknowledgements
This work was supported by the Austrian Science Fund (FWF Project ESP 465-B). We acknowledge the Medical University Core Facilities, Flow Cytometry Unit. We thank all voluntary healthy donors for their participation and sample donation, and the nursing team for their support.
Materials
| Name | Company | Catalog Number | Comments |
|---|---|---|---|
| 1.5 mL Microcentrifuge Tubes, High Performance | VWR | 525-1164 | |
| 12-well plates, flat bottom, TC-treated | VWR | 734-2324 | |
| 24-well plates, flat bottom, TC-treated | VWR | 734-2325 | |
| 6-well plates, flat bottom, TC-treated | VWR | 734-2323 | |
| 7-AAD staining solution | Miltenyi Biotec | 130-111-568 | |
| Anti-Flag DYKDDDDK Antibody, APC, REAfinity | Miltenyi Biotec | 130-119-584 | |
| BD FACSCanto II Clinical Flow Cytometry System | BD Biosciences | FACSCanto II | |
| Bovine Serum Albumin | Merck | A4503-10G | For gravity flow isolation |
| CD134 (OX40) Antibody, anti-human, REAfinity | Miltenyi Biotec | 130-126-048 | Conjugate: PE |
| CD137 (4-1BB) Antibody, anti-human, REAfinity | Miltenyi Biotec | 130-110-764 | Conjugate: APC |
| CD154 (CD40L) Antibody, anti-human, REAfinity | Miltenyi Biotec | 130-114-142 | Conjugate: PerCP-VIO 700 |
| CD25 Antibody, anti-human, REAfinity | Miltenyi Biotec | 130-114-541 | Conjugate: PE-Vio 770 |
| CD3 Antibody, anti-human, REAfinity | Miltenyi Biotec | 130-132-352 | Conjugate: PE-Vio 670 |
| CD4 Antibody, anti-human, REAfinity | Miltenyi Biotec | 130-113-223 | Conjugate: APC-Vio 770 |
| CD4 MicroBeads, human | Miltenyi Biotec | 130-045-101 | For gravity flow isolation |
| CD45 Antibody, anti-human, REAfinity | Miltenyi Biotec | 130-110-775 | Conjugate: VioBlue |
| CD45RA Antibody, anti-human, REAfinity | Miltenyi Biotec | 130-132-270 | Conjugate: Vio Bright V600 |
| CD62L Antibody, anti-human, REAfinity | Miltenyi Biotec | 130-127-499 | Conjugate: Vio Bright R720 |
| CD69 Antibody, anti-human, REAfinity | Miltenyi Biotec | 130-112-800 | Conjugate: VioGreen |
| CD8 Antibody, anti-human, REAfinity | Miltenyi Biotec | 130-110-677 | Conjugate: FITC |
| CD8 MicroBeads, human | Miltenyi Biotec | 130-045-201 | For gravity flow isolation |
| Cellstar 96 Well Suspension Culture Plate, U-bottom | Greiner Bio-one | 650 185 | |
| Centrifuge 5810 R | Eppendorf | 5811000015 | |
| CO2 incubator ICO150 | Memmert | ICO150 | |
| CoolNat Ice Machine | Ziegra Eismaschinen GmbH | ZBE 30-10 | |
| Corning CoolCell Freezer Container | Corning | CLS432000 | |
| Counting chamber, Bürker-Türk pattern, BLAUBRAND | Brand | 719520 | |
| CryoPure tubes, 2 mL, QuickSeal screw cap | Sarstedt | 72,380 | |
| CytoFLEX LX Flow Cytometer | Beckmann Coulter | C11185 | |
| Deoxynucleotide (dNTP) Solution Mix | New England Biolabs | N0447S | |
| Dimethyl sulfoxide (DMSO) Cell culture grade | AppliChem | A3672 | |
| DPBS, no calcium, no magnesium | Gibco | 14190-144 | |
| Dynabeads Human T-Activator CD3/CD28 | Gibco | 11131D | |
| Electroporation Cuvettes with 4 mm gap size, yellow cap | VWR | 732-1137 | |
| Eppendorf Research plus pipette, 0.1–2.5 µL | Eppendorf | 3123000012 | |
| Eppendorf Research plus pipette, 100–1000 µL | Eppendorf | 3123000063 | |
| Eppendorf Research plus pipette, 2–20 µL | Eppendorf | 3123000039 | |
| Eppendorf Research plus pipette, 20–200 µL | Eppendorf | 3123000055 | |
| Ethylenediaminetetraacetic acid (EDTA) | Merck | E6758-100G | For gravity flow isolation |
| Falcon 15 mL PP Centrifuge Tube, Conical Bottom | Corning | 352196 | |
| Falcon 5 mL Round Bottom Polystyrene Test Tube | Corning | 352008 | |
| Falcon 50 mL PP Centrifuge Tube, Conical Bottom | Corning | 325098 | |
| Fetal Bovine Serum, Value FBS | Gibco | A52567-01 | |
| Ficoll PM 400 | Sigma-Aldrich | F4375-10G | For density gradient isolation |
| Fisherbrand Sterile Graduated Transfer Pipets | Fisher Scientific | 13469108 | |
| Gene Pulser Xcell Total System | BioRad | 1652660 | with PC Module and CE Module |
| HiScribe T7 ARCA mRNA Kit (with tailing) | New England Biolabs | E2060S | |
| Human IL-15, research grade | Miltenyi Biotec | 130-093-955 | |
| Human IL-7, research grade | Miltenyi Biotec | 130-095-367 | |
| Integra Biosciences Corp PIPETBOY acu 2 pipet aid | Fisher Scientific | NC0085685 | |
| LE Agarose | Biozym | 840004 | |
| LS Columns | Miltenyi Biotec | 130-042-401 | For gravity flow isolation |
| Microplate, 96 well, PS, V-bottom, clear, non-binding | Greiner Bio-one | 651901 | |
| Monarch RNA Cleanup Kit (50 μg) | New England Biolabs | T2040S | |
| Monarch Spin PCR & DNA Cleanup Kit | New England Biolabs | T1130S | |
| MSC-Advantage Class II Biological Safety Cabinet | Thermo Scientific | 51028226 | |
| Olympus IMT-2 Microscope | Spach Optics | OLYMPUS-IMT2 | |
| Opti-MEM I Reduced Serum Medium, no phenol red | Gibco | 11058021 | |
| Pancoll human, Density: 1.077 g/mL | Pan Biotech | P04-60100 | For density gradient isolation |
| Penicillin-Streptomycin (10,000 U/mL) | Gibco | 15140122 | |
| Q5 High-Fidelity DNA Polymerase | New England Biolabs | M0491S | |
| QuadroMACS Separator | Miltenyi Biotec | 130-090-976 | For gravity flow isolation |
| RosetteSep Human T Cell Enrichment Cocktail | StemCell Technologies | 15021 | For density gradient isolation |
| Rotiphorese 50x TAE Buffer | Carl Roth | CL86.2 | |
| RPMI 1640 Medium, GlutaMAX Supplement | Gibco | 61870-044 | |
| RPMI 1640 Medium, no phenol red | Gibco | 11835030 | |
| SafeSeal SurPhob tips, 1000 µL, sterile | Biozym | VT0260 | |
| SafeSeal SurPhob tips, 20 µL, sterile | Biozym | VT0220 | |
| SafeSeal SurPhob tips, 200 µL, sterile | Biozym | VT0240 | |
| SafeSeal SurPhob tips,10 µL, sterile | Biozym | VT0200 | |
| Serological pipette, standard line, 10 mL | VWR | 612-3700 | |
| Serological pipette, standard line, 2 mL | VWR | 612-3704 | |
| Serological pipette, standard line, 25 mL | VWR | 612-3698 | |
| Serological pipette, standard line, 5 mL | VWR | 612-3702 | |
| Serological pipette, standard line, 50 mL | VWR | 612-3696 | |
| Sterilin Polystyrene 30 mL Containers | Thermo Fisher | 128A | |
| T Cell TransAct, human | Miltenyi Biotec | 130-111-160 | |
| UltraPure DNase/RNase-Free Distilled Water | Fisher Scientific | 11538646 | |
| VWR, Cell Culture Flasks, TC-Treated, 182 cm² | VWR | 734-2315 | |
| VWR, Cell Culture Flasks, TC-Treated, 25 cm² | VWR | 734-2311 | |
| VWR, Cell Culture Flasks, TC-Treated, 75 cm² | VWR | 734-2313 |
References
- Bartelt, R. R., Cruz-Orcutt, N., Collins, M., Houtman, J. C. Comparison of T cell receptor-induced proximal signaling and downstream functions in immortalized and primary T cells. PLoS One. 4 (5), e5430(2009).
- Smeets, R. L., et al. Molecular pathway profiling of T lymphocyte signal transduction pathways; Th1 and Th2 genomic fingerprints are defined by TCR and CD28-mediated signaling. BMC Immunol. 13 (12), (2012).
- Wilson, A., et al. Jurkat T-cell lines exhibit marked genomic instability affecting karyotype, mutational profile, gene expression, immunophenotype and function. Sci Rep. 15 (1), 22426(2025).
- Dobersberger, M., et al. An engineering strategy to target activated EGFR with CAR T cells. Cell Rep Methods. 4 (4), 100728(2024).
- Van Bruggen, J. A. C., et al. Chronic lymphocytic leukemia cells impair mitochondrial fitness in CD8+ T cells and impede CAR T-cell efficacy. Blood. 134 (1), 44-58 (2019).
- Hoffmann, J. M., et al. Differences in expansion potential of naive chimeric antigen receptor T cells from healthy donors and untreated chronic lymphocytic leukemia patients. Front Immunol. 8 (1956), (2017).
- Zhang, D. K. Y., et al. Enhancing CAR-T cell functionality in a patient-specific manner. Nat Commun. 14 (1), 506(2023).
- Li, Y., Kurlander, R. J. Comparison of anti-CD3 and anti-CD28-coated beads with soluble anti-CD3 for expanding human T cells: differing impact on CD8 T cell phenotype and responsiveness to restimulation. J Transl Med. 8 (104), (2010).
- Xu, X. J., et al. Multiparameter comparative analysis reveals differential impacts of various cytokines on CART cell phenotype and function ex vivo and in vivo. Oncotarget. 7 (50), 82354-82368 (2016).
- Cornish, G. H., Sinclair, L. V., Cantrell, D. A. Differential regulation of T-cell growth by IL-2 and IL-15. Blood. 108 (2), 600-608 (2006).
- Zhou, J., et al. Chimeric antigen receptor T (CAR-T) cells expanded with IL-7/IL-15 mediate superior antitumor effects. Protein Cell. 10 (10), 764-769 (2019).
- Foster, J. B., Barrett, D. M., Kariko, K. The emerging role of in vitro-transcribed mRNA in adoptive T cell immunotherapy. Mol Ther. 27 (4), 747-756 (2019).
- Becker, S. A., et al. Enhancing the effectiveness of gammadelta T cells by mRNA transfection of chimeric antigen receptors or bispecific T cell engagers. Mol Ther Oncolytics. 29, 145-157 (2023).
- Wiesinger, M., et al. Clinical-scale production of CAR-T cells for the treatment of melanoma patients by mRNA transfection of a CSPG4-specific CAR under full GMP compliance. Cancers (Basel). 11 (8), 1198(2019).
- Wu, J., Wu, W., Zhou, B., Li, B. Chimeric antigen receptor therapy meets mRNA technology. Trends Biotechnol. 42 (2), 228-240 (2024).
- Sahin, U., Kariko, K., Tureci, O. mRNA-based therapeutics--developing a new class of drugs. Nat Rev Drug Discov. 13 (10), 759-780 (2014).
- Underwood, S., et al. T cell activators exhibit distinct downstream effects on chimeric antigen receptor T cell phenotype and function. Immunohorizons. 8 (6), 404-414 (2024).
- Zajc, C. U., Teufl, M., Traxlmayr, M. W. Affinity and stability analysis of yeast displayed proteins. Methods Mol Biol. 2491, 155-173 (2022).
- Seigner, J., et al. Solving the mystery of the FMC63-CD19 affinity. Sci Rep. 13 (1), 23024(2023).
- Jalkanen, A. L., Coleman, S. J., Wilusz, J. Determinants and implications of mRNA poly(A) tail size--does this protein make my tail look big. Semin Cell Dev Biol. 34, 24-32 (2014).
- Foster, J. B., et al. Purification of mRNA encoding a chimeric antigen receptor is critical for the generation of a robust T-Cell response. Hum Gene Ther. 30 (2), 168-178 (2019).
- Kitte, R., et al. Optimal chimeric antigen receptor (CAR)-mRNA for transient CAR T cell generation. Int J Mol Sci. 26 (3), 965(2025).
- Kiesgen, S., Messinger, J. C., Chintala, N. K., Tano, Z., Adusumilli, P. S. Comparative analysis of assays to measure CAR T-cell-mediated cytotoxicity. Nat Protoc. 16 (3), 1331-1342 (2021).
- Hu, L., et al. A nonviral approach to generate transient chimeric antigen receptor T cells using mRNA for cancer immunotherapy. J Vis Exp. (216), e67548(2025).
- Foster, J. B., et al. Transient mRNA CAR T cells targeting GD2 provide dose-adjusted efficacy against diffuse midline glioma and high grade glioma models. Neuro Oncol. 27 (10), 2684-2696 (2025).
- Usheva, Z. I., Petersen, D. L., Barington, T., Mouritzen, P., Barnkob, M. B. Droplet-based cytotoxicity assay to assess chimeric antigen receptor T cells at the single-cell level. J Vis Exp. (217), e67657(2025).
- Subham, S., et al. Rapid in vitro cytotoxicity evaluation of Jurkat expressing chimeric antigen receptor using fluorescent imaging. J Vis Exp. (200), e65560(2023).
- Zhao, Y., et al. High-efficiency transfection of primary human and mouse T lymphocytes using RNA electroporation. Mol Ther. 13 (1), 151-159 (2006).
- Xu, Y., et al. Closely related T-memory stem cells correlate with in vivo expansion of CAR.CD19-T cells and are preserved by IL-7 and IL-15. Blood. 123 (24), 3750-3759 (2014).
- Clausen, J., et al. Functional significance of the activation-associated receptors CD25 and CD69 on human NK-cells and NK-like T-cells. Immunobiology. 207 (2), 85-93 (2003).
- Poloni, C., et al. T-cell activation-induced marker assays in health and disease. Immunol Cell Biol. 101 (6), 491-503 (2023).
- Rotta, G., et al. Protocol for flow cytometry immunophenotyping of human antigen-specific T cells by activation-induced marker and Th1 cytokine detection. STAR Protoc. 6 (1), 103343(2025).
- Elsallab, M., et al. Second primary malignancies after commercial CAR T-cell therapy: analysis of the FDA adverse events reporting system. Blood. 143 (20), 2099-2105 (2024).
- Verdun, N., Marks, P. Secondary cancers after chimeric antigen receptor T-cell therapy. N Engl J Med. 390 (7), 584-586 (2024).
- Krug, C., et al. Stability and activity of MCSP-specific chimeric antigen receptors (CARs) depend on the scFv antigen-binding domain and the protein backbone. Cancer Immunol Immunother. 64 (12), 1623-1635 (2015).
- Kitte, R., et al. Lipid nanoparticles outperform electroporation in mRNA-based CAR T cell engineering. Mol Ther Methods Clin Dev. 31, 101139(2023).
- Sauerer, T., et al. Electroporation of mRNA as a universal technology platform to transfect a variety of primary cells with antigens and functional proteins. Methods Mol Biol. 2786, 219-235 (2024).
- Bimbo, J. F., et al. T cell-specific non-viral DNA delivery and in vivo CAR-T generation using targeted lipid nanoparticles. J Immunother Cancer. 13 (7), (2025).
- Hudecek, M., et al. Going non-viral: the Sleeping Beauty transposon system breaks on through to the clinical side. Crit Rev Biochem Mol Biol. 52 (4), 355-380 (2017).
- Prommersberger, S., et al. Minicircles for CAR T cell production by sleeping beauty transposition: a technological overview. Methods Mol Biol. 2521, 25-39 (2022).
- Aronovich, E. L., McIvor, R. S., Hackett, P. B. The Sleeping Beauty transposon system: a non-viral vector for gene therapy. Hum Mol Genet. 20 (R1), R14-R20 (2011).
- Soundara Rajan, T., Gugliandolo, A., Bramanti, P., Mazzon, E. In vitro-Transcribed mRNA chimeric antigen receptor T cell (IVT mRNA CAR T) therapy in hematologic and solid tumor management: A preclinical update. Int J Mol Sci. 21 (18), (2020).
- Granit, V., et al. Safety and clinical activity of autologous RNA chimeric antigen receptor T-cell therapy in myasthenia gravis (MG-001): a prospective, multicentre, open-label, non-randomised phase 1b/2a study. Lancet Neurol. 22 (7), 578-590 (2023).
- Dagher, O. K., et al. Preclinical efficacy of multi-targeting mRNA-based CAR T cell therapy in resection models of glioblastoma. Mol Ther Nucleic Acids. 36 (3), 102676(2025).
Reprints and Permissions
