This protocol describes a method for producing and evaluating the antimicrobial activity and cytotoxicity of the cationic peptide Mel4 and peptide mimic RK758. By integrating chemical synthesis, recombinant expression, and standardized functional assays, it provides a streamlined workflow for the production and testing of peptides and small-molecule mimics.
Method Article
Production and Testing of Antimicrobial Peptides and Their Mimics
In This Article
Summary
Abstract
Antimicrobial peptides (AMPs) and their synthetic mimics are emerging as promising alternatives to conventional antibiotics, particularly in response to the growing threat of antimicrobial resistance. Naturally occurring AMPs are essential components of the innate immune system and display broad-spectrum activity against diverse microbial pathogens, while their synthetic mimics, including peptidomimetics and polymer-based analogs, are designed to enhance stability, reduce toxicity, and improve pharmacokinetics. This study aims to demonstrate the production, characterization, and biological evaluation of AMPs and small-molecule peptide mimics. AMPs are generated using recombinant expression systems or solid-phase peptide synthesis, enabling precise control over amino acid sequence and structural properties. Small-molecule peptide mimics are synthesized using chemical strategies, including an anthranilic acid (2-aminobenzoic acid) scaffold to enhance structural stability and pharmacological performance. Following synthesis, compounds are purified and chemically characterized prior to biological testing. Antimicrobial activity is evaluated using in vitro minimum inhibitory concentration (MIC) assays, and cytotoxicity is assessed against mammalian cell lines to determine selectivity. Representative results demonstrate that both AMPs and their mimics exhibit potent activity against Klebsiella pneumoniae and Escherichia coli, highlighting their broad-spectrum antibacterial potential. Overall, this protocol provides a comprehensive and reproducible framework for the development and systematic evaluation of antimicrobial peptides and their mimics as next-generation anti-infective agents.
Introduction
Antimicrobial resistance (AMR) has emerged as a major global health threat1. According to the World Health Organization (WHO), AMR was directly responsible for approximately 1.27 million deaths in 2019 and contributed to an estimated 4.95 million deaths worldwide2. The overuse and misuse of existing antibiotics have highlighted the emergence of multidrug-resistant pathogens, leaving limited treatment options against microbes like bacteria, fungi, viruses, and protozoa2,3. This AMR crisis has initiated the search for alternative antimicrobial strategies that are effective, stable, and less prone to resistance development. Among the most promising candidates are AMPs and their synthetic mimics4.
AMPs are naturally occurring molecules that play a vital role in the innate immune systems of humans, animals, and plants5. They typically exhibit broad-spectrum antimicrobial activity through mechanisms such as membrane disruption, interference with microbial metabolism, and modulation of immune responses6. For example, the human cathelicidin peptide LL-37 has demonstrated potent activity against bacteria, fungi, and viruses7. However, despite their promising potential4, the large-scale therapeutic use of natural AMPs is often restricted by their low natural abundance. Additionally, obtaining their active forms from natural sources can be challenging, as many peptides require specific post-translational modifications to become functionally active8.
To address the limitations associated with natural AMPs, researchers have developed synthetic analogs and peptide mimics. The mimics can be small, rationally designed molecules that preserve the antimicrobial efficacy of natural AMPs while offering improved stability, selectivity, and pharmacokinetic performance9.
Recent advances in peptide chemistry and molecular biology have enabled the efficient production of AMPs through methods such as solid-phase peptide synthesis (SPPS), liquid-phase peptide synthesis (LPPS), and recombinant expression systems, providing precise control over key structural parameters, such as sequence composition, charge distribution, and amphipathicity10. Recombinant expression systems are suitable for large-scale production and for longer or more complex polypeptides. Once optimized, recombinant methods-typically employing fermentation or bioreactor systems- offer a cost-effective and scalable approach for industrial production of therapeutic peptides11.
This article demonstrates complementary approaches for the production and evaluation of AMPs and their mimics. While solid-phase chemical synthesis is widely used for peptide generation, it can become inefficient and costly for longer sequences or highly cationic peptides due to aggregation, low yields, and purification challenges12. In contrast, chemical synthesis remains highly advantageous for generating short peptide mimics with precise structural modifications and non-natural residues13. Recombinant expression systems, on the other hand, enable cost-effective and scalable biosynthetic production of longer or structurally complex peptides in microbial hosts, overcoming length and yield limitations associated with purely synthetic approaches12. By integrating chemical and biological production strategies, this combined framework offers greater flexibility, scalability, and translational potential than either method alone, making it particularly suitable for mechanistic research and therapeutic development.
Following production, the biological evaluation of these compounds is performed through two key assays. The antimicrobial activity assay measures the inhibitory potential of each peptide or mimic against representative microorganisms, providing insights into their spectrum and potency. The toxicity assay assesses cytocompatibility using mammalian cell lines to ensure safety and selectivity. By integrating these experimental step-design, synthesis, and functional testing, this protocol provides a comprehensive framework for characterizing the efficacy and safety of AMPs and their synthetic analogs. Together, these methodologies establish a systematic approach to developing and validating novel antimicrobial agents to address the growing global challenge of AMR.
Protocol
1. Synthesis of the anthranilamide peptide mimic RK758
- RK758 is synthesized in-house from the key organic building blocks N-benzyl carbamate-protected L-tryptophan and 5-bromo isatoic anhydride. Several synthetic approaches have been reported; however, the reported approach below has demonstrated good scalability and overall yield, which is an improvement on the previously published synthetic protocols14,15.
- Method 1: Synthesis of benzyl (S)-(1-((2-((tert-butoxycarbonyl)amino)ethyl)amino)-3-(1H-indol-3-yl)-1-oxopropan-2-yl) carbamate (2):
- In a 250 mL single-neck flask, fitted with a magnetic stir bar, weigh out Cbz-L-tryptophan (10.0 g, 29.6 mmol) and dissolve in 30 mL of DMF and 80 mL of DCM.
CAUTION: DMF is suspected of causing birth defects; avoid handling if pregnant, and only handle in a fume hood. - Add HOBt (4.08 g, 29.6 mmol), N-Boc-ethylenediamine (4.66 mL, 29.6 mmol), and diisopropylethylamine (8.31 mL, 59.0 mmol) and stir for 15 min.
- Add EDC hydrochloride salt (11.3 g, 59 mmol). Stir at room temperature for 20 h.
CAUTION: Carbodiimides, such as EDC, are known to sensitize to anaphylactic reactions on repeated exposure; ensure appropriate gloves are worn. - Check TLC using 1:1 (v/v) DCM/Ethyl acetate to see if all Cbz-L-Trp has been consumed.
- After completion of the reaction, use a rotary evaporator to concentrate the reaction to remove dichloromethane from the mixture.
- Solvate the slurry in around 300-400 mL of ethyl acetate
NOTE: Step 1.1.1.6 yields a slurry in dimethylformamide. Use enough ethyl acetate to dissolve the suspension. - Pour the solution into a 500 mL separatory funnel along with 50 mL of water. Shake the separatory funnel.
CAUTION: Since a large volume of volatile solvent is used here, it is imperative to vent the separatory funnel intermittently. - Drain the aqueous layer, retaining the organic ethyl acetate layer.
- Repeat step 1.1.1.7-1.1.1.8 using 50 mL of water, 50 mL of saturated aqueous sodium bicarbonate, and 50 mL of saturated aqueous sodium chloride.
- Transfer the retained organic layer to a 1 L conical flask. Dry the organics by adding anhydrous sodium sulfate and swirling the flask until a free-flowing powder forms.
- Filter the mixture into a 1 L round-bottomed flask, then concentrate to dryness on a rotary evaporator (40 °C water bath using 180 mbar vacuum).
- Add 50 mL of diethyl ether and a magnetic stir bar, and stir the slurry for 45-60 min.
NOTE: It can be effective to scrape solids off the flask wall with a metal spatula. - Filter the slurry to collect the precipitated solids. Wash the filter cake twice more with 50 mL portions of diethyl ether. Dry the solids under suction to obtain compound 2 as a beige powder in 87% yield.
- In a 250 mL single-neck flask, fitted with a magnetic stir bar, weigh out Cbz-L-tryptophan (10.0 g, 29.6 mmol) and dissolve in 30 mL of DMF and 80 mL of DCM.
- Method 2: Synthesis of tert-butyl (S)-(2-(2-amino-3-(1H-indol-3-yl) propanamido) ethyl) carbamate (3)
- In a 250 mL two-neck round-bottom flask fitted with a rubber septum and glass stopper, dissolve product 2 (10.8 g, 22.3 mmol) in 100 mL of methanol using magnetic stirring
NOTE: Do not grease the glass stopper, as this may lead to contamination. - While stirring, add 10% palladium on carbon (1.07 g) through the opening with the glass stopper. Using a Schlenk manifold, bubble nitrogen gas through the mixture for at least 30 min.
NOTE: Any inert gas may be used, such as argon; however, house N2 is sufficient in this case. - Replace the glass stopper with a 2-way ground glass joint adapter, with one line connected to a hydrogen balloon and the other connected to a vacuum. Fit PTFE tape around the joint to create an airtight seal.
- Open the flask to vacuum until the methanol just starts to boil, then quickly open the flask to the hydrogen balloon. Repeat twice more.
- Monitor the reaction through thin-layer chromatography (using 1:1 ethyl acetate/dichloromethane as the eluent) by extracting small aliquots of the reaction mixture through the rubber septum using a syringe and filtering through a 40 µm PTFE membrane filter.
- On the Schlenk manifold, switch the vacuum to nitrogen. Remove the rubber septum from the flask and allow nitrogen to purge out the remaining hydrogen for around 5 min.
CAUTION: Palladium on carbon can ignite spontaneously in air when hydrogen is adsorbed onto it. It is important to handle the reaction under an inert gas blanket. - Prepare a bed of diatomaceous earth, by forming a slurry of diatomaceous earth in ethyl acetate and transferring the slurry to a medium porosity glass fritted filter funnel attached to a 500 mL round bottom flask, and pulling a light vacuum until the solvent is just above the level of diatomaceous earth
NOTE: The column of diatomaceous earth should be at least 2–4 cm high when loaded in the funnel.
CAUTION: Diatomaceous earth/crystalline silica is highly carcinogenic and is known to cause mesothelioma through respiratory exposure. It should always be handled in a fume hood or with an appropriate respirator being worn. - Using a pipette or otherwise, transfer the reaction slurry onto the top of the celite column, taking care not to disturb the top layer of celite. Repeat until only a small amount of reaction slurry (<2 mL) is left in the flask
NOTE: After enough solvent head above the bed, the contents of the flask may be poured into the filter funnel. - Intermittently pull a light vacuum on the funnel/flask until the solvent head is just above the bed, wash the contents of the flask with small amounts of ethyl acetate, and repeat 3–4 times
NOTE: The layer of palladium/carbon on top of the celite should never be exposed to air. - Keep washing the pad until all the products have been filtered through; this can be checked by dripping some of the filtered solvent onto a small piece of TLC plate and visualizing under UV-light.
- Remove all the solvent on a rotary evaporator. Add a minimal amount of dichloromethane (5 mL) to the residue and precipitate the product by adding diethyl ether (50 mL).
- Filter the mixture, retaining the precipitate which furnishes intermediate 3 in quantitative yield.
- In a 250 mL two-neck round-bottom flask fitted with a rubber septum and glass stopper, dissolve product 2 (10.8 g, 22.3 mmol) in 100 mL of methanol using magnetic stirring
- Method 3: Synthesis of tert-butyl (S)-(2-(2-(2-amino-5-bromobenzamido)-3-(1H-indol-3-yl)propanamido)ethyl) carbamate (4)
- In a 250 mL oven-dried single-neck round-bottom flask, weigh out product 3 (5.00 g, 14.5 mmol) and 5-bromoisatoic anhydride (5) (3.50 g, 14.5 mmol). Add 50 mL of anhydrous acetonitrile.
NOTE: Anhydrous acetonitrile was obtained from a solvent purification system by percolating solvent through a column of activated alumina. - Fit the flask with a water-cooled reflux condenser and drying tube filled with anhydrous calcium chloride and seal joints with PTFE tape.
- Heat the mixture to reflux (b.p. acetonitrile = 82 °C), oil bath temperature = 100 °C. Stir at reflux for 18 h or until TLC shows consumption of three. After completion, concentrate the reaction mixture to dryness under vacuum.
- To the solids, add 30 mL of acetonitrile and 50 mL of diethyl ether and filter the mixture, retaining the solid product. Collect the solid product to give the title compound 4 in 78% yield.
- In a 250 mL oven-dried single-neck round-bottom flask, weigh out product 3 (5.00 g, 14.5 mmol) and 5-bromoisatoic anhydride (5) (3.50 g, 14.5 mmol). Add 50 mL of anhydrous acetonitrile.
- Method 4: Synthesis of tert-butyl (S)-(2-(2-(2-(2-naphthamido)-5-bromobenzamido)-3-(1H-indol-3-yl)propanamido)ethyl) carbamate (6)
- In a 50 mL oven-dried single-neck round-bottom flask, dissolve 2-naphthoyl chloride (572 mg, 3.0 mmol) in 10 mL of dichloromethane. Fit the flask with a rubber septum. This flask is referred to as “flask A” hereafter.
NOTE: Naphthoyl chloride from a commercial supplier, was used in the study, but have had similar results generating it from 2-naphthoic acid using oxalyl chloride as per14). - In a separate oven-dried 100 mL single-neck round-bottom flask, weigh out product 4 (544 mg, 1.0 mmol). This flask is referred to as “Flask B” hereafter.
- Fit Flask B with a rubber septum and connect to a Schlenk manifold using a syringe needle and Luer adapter. Purge Flask B under vacuum and back fill with nitrogen, repeat twice.
- Add 20 mL of anhydrous dichloromethane via syringe to Flask B. Add triethylamine (455 µL, 3.24 mmol) via syringe to Flask B. Cool over an ice bath for 10 min.
- Draw up the contents of flask A into an appropriately sized syringe. Add the solution from the syringe to flask B dropwise with stirring.
NOTE: Production of triethylamine hydrochloride may be seen as white fumes above the solvent. Remove from the ice bath after adding the acid chloride solution. - Stir the mixture until all of compound 4 is consumed based on TLC analysis. Concentrate the mixture to near dryness on a rotary evaporator (600 mbar, 40 °C).
- Partition the mixture between water (30 mL) and ethyl acetate (70 mL). Incorporate layers by shaking in a separatory funnel and discarding the aqueous layer.
- Wash the organic mixture with saturated aqueous solutions of NaHCO3 (30 mL) and NaCl. Dry the organic layer by adding anhydrous Na2SO4 until a free-flowing powder is observed on mixing.
- Concentrate to dryness on a rotary evaporator (170 mbar, 40 °C). Triturate the crude solids with acetonitrile (15 mL) and diethyl ether (15 mL) to obtain the title compound as an off-white solid in 70% yield.
- In a 50 mL oven-dried single-neck round-bottom flask, dissolve 2-naphthoyl chloride (572 mg, 3.0 mmol) in 10 mL of dichloromethane. Fit the flask with a rubber septum. This flask is referred to as “flask A” hereafter.
- Method 5: Synthesis of (S)-N-(2-((1-((2-aminoethyl)amino)-3-(1H-indol-3-yl)-1-oxopropan-2-yl)carbamoyl)-4-bromophenyl)-2-naphthamide (7)
- Treat a suspension of intermediate 6 (1.5 g, 2.15 mmol) in dichloromethane (0.2 M final concentration) with 1,2-ethanedithiol (20% volume with respect to volume of DCM).
CAUTION: 1,2-ethanedithiol has an offensive odor that may cause nausea, even at low concentrations, Handle in a fume hood. - Cool the mixture in an ice bath, then treat with trifluoroacetic acid (same volume used as DCM). Stir the mixture at 0 °C for 2 h.
- After completion, concentrate the reaction mixture by purging with nitrogen gas
NOTE: Exhaust gases may be bubbled through a bleach trap to limit odor release. - Triturate the crude solids with diethyl ether (10 mL) and filter to collect the solids. Wash the filter cake twice with diethyl ether (10 mL each), then allow solids to dry under suction.
- Treat a suspension of intermediate 6 (1.5 g, 2.15 mmol) in dichloromethane (0.2 M final concentration) with 1,2-ethanedithiol (20% volume with respect to volume of DCM).
- Method 6: Synthesis of tert-butyl (S,Z)-(3-((1H-indol-3-yl)methyl)-1-(2-(2-naphthamido)-5-bromophenyl)-1,4-dioxo-9-(phenylimino)-2,5,8,10-tetraazadodecan-12-yl) carbamate (9)
- Charge a single-neck round-bottom flask with intermediate 7 (1.0 g, 1.4 mmol), thiourea derivative 8 (415 mg, 1.4 mmol), and triethylamine (1.01 mL, 4.2 mmol) in N, N-dimethylformamide (5 mL).
- Cool the reaction to -5 °C in a brine-ice bath and add mercury (II) chloride (760 mg, 2.8 mmol) and stir it for 16 h.
CAUTION: Mercury (II) chloride is fatal via oral, dermal, and respiratory exposure. It is also highly toxic to aquatic life. Wear chemical-resistant gloves, eye protection, and body protection. Additionally, avoid aerosolizing solutions containing mercury(II) chloride and handle them within a fume hood. Ensure that waste from this process is separated from other organic waste streams and ensure that no mercury waste enters drains. - After completion, dilute the mixture with 2-propanol and filter through a bed of celite, collecting the filtrate.
- Concentrate the filtrate to dryness on a rotary evaporator and subject the residue to flash column chromatography on silica using 3:97 methanol/dichloromethane as the eluent.
- Analyze the collected fractions using TLC and then collect pure fractions to afford the title compound.
- Method 7: Synthesis of RK758
- The method to Boc deprotects intermediate 8 to form RK758 is identical to Step 1.1.5.
- Redissolve the resulting product in 5 mL of 1:1 (v/v) acetonitrile/ultra-pure water, and transfer to a screw cap, borosilicate glass vial. Freeze the solution in a bath of liquid nitrogen and then freeze-dry to obtain the product.
NOTE: It is important to ensure the vial used is borosilicate to prevent cracking upon freezing.
CAUTION: Liquid nitrogen exposure may cause frostbite/skin damage. Ensure that appropriate gloves and eye protection are worn.
- Method 1: Synthesis of benzyl (S)-(1-((2-((tert-butoxycarbonyl)amino)ethyl)amino)-3-(1H-indol-3-yl)-1-oxopropan-2-yl) carbamate (2):
2. Recombinant production and purification of the highly cationic antimicrobial peptide Mel4 (KNKRKRRRRRRGGRR)
- Optimized protocol for production
- Gene synthesis
- Design and synthesize the gene cassette with the following components: HIS (6x/7x histidine tag for recombinant peptide isolation, Ketosteroid Isomerase (KSI) tag for inclusion body (IB) formation , and Tobacco Etch Virus (TEV) Cleavage site (ENLYFQ↓G, S, A, M, C, H), for sustainable, chemical-free excision of the KSI and His-tag from the protein motif.
- Select the amino acid right after the cut (G, S, A, M, C, H) such that it does not affect the activity of the AMP.
NOTE: Glycine offers the highest efficiency of TEV cleavage. A single amino acid positioned either at the N-or C-terminal may impact physico-chemical properties of the AMPs, hence their activity. - Synthesize the synthetic gene sequence, including flanking regions, with 5’ XbaI and 3’ XhoI restriction sites. The amino acid sequence is given in Table 1 and schematically in Figure 1.
- Cloning
- Digest the pET vector using compatible restriction enzymes.
NOTE: In this case, the p15TVL plasmid (a pET15b derivative, Ampr, T7 promoter) was digested with XbaI, XhoI, and ScaI (to cleave the unwanted fragment). - To prevent re-ligation of digested fragments, treat with calf intestinal alkaline phosphatase for 10 min at 37 °C. Digest the synthetic His-KSI-Mel4 gene with XbaI and XhoI in a 20 µL reaction.
- Purify the fragments from all restriction enzymes using QIAquick PCR Purification Kit. Alternatively, run gel electrophoresis and cut out the band associated with the desired vector fragment, then extract the fragment from the gel using a gel extraction kit.
NOTE: Ensure that purified fragments are quantified using a spectrophotometric method (NanoDrop) to optimize ligation.
- Digest the pET vector using compatible restriction enzymes.
- Ligation and transformation
- Ligate the digested synthetic gene inserted into the pET vector. Ensure that the proportion of the insert and the vector is equimolar.
- Incubate the mixture with T4 Ligase overnight at 16 °C. Transform into a chemically or electrocompetent DH5α with heat-shock or electroporation methods, respectively.
- Gently mix chemically competent DH5α cells with plasmid DNA and incubate on ice to allow DNA attachment. Then heat-shock the cells for 30 s at 42 °C to facilitate DNA uptake, then rapidly cool on ice.
- After recovery in antibiotic-free 450 µL LB Broth medium at 37 °C for an hour, plate the cells on selective agar containing the appropriate antibiotic.
NOTE: Transformed colonies typically appear after overnight incubation. For electrocompetent DH5α cells, mix a small volume of purified, salt-free plasmid DNA (typically 1–2 µL of 10–100 ng into ~50 µL cells) with cells in a chilled electroporation cuvette. - After a brief chill, deliver a single pulse (common settings: 1.8 kV for a 0.2 cm gap cuvette yielding a ~5 ms time constant; adjust for your device/cuvette), taking care to avoid arcing by using desalted DNA and ice-cold reagents.
- Immediately add ~450 µL pre-warmed LB, recover at 37 °C with shaking for an hour, then plate on selective agar.
- Culture transformants overnight in LB broth for plasmid isolation using a plasmid purification kit. Verify the final plasmid construct by PCR using the primers in Table 1 and confirm the sequence by Sanger sequencing.
- Transform the verified plasmid into the expression host (chemically or electrocompetent), E. coli BL21(DE3), as above.
- Gene synthesis
- Optimized expression and inclusion body (IB) production
- Inoculate 10 mL LB broth (100 µg/mL ampicillin) and grow at 37 °C overnight. Use this to inoculate 100 mL, and subsequently a 1 L production culture.
- Dilute in LB to optical density (OD600) of culture at time 0 = 0.1. Use LB medium supplemented with 1% glucose and 100 µg/mL ampicillin.
- Incubate at 37 °C and monitor OD to reach log phase (OD600 0.5–0.6). Induce with a low concentration of Isopropyl β-D-1-thiogalactopyranoside IPTG, typically, 0.1 mM.
Maintain at 37 °C for 16– 24 h to enhance the formation of inclusion bodies. - Continue incubation for 16 to 24 h. Harvest cells by centrifugation (5,000 x g, 4 °C) for 10 min and store pellets at -80 °C.
- Cell lysis and protein fractionation
- Thaw cell pellets on ice and resuspend in Bugbuster reagent to initiate chemical lysis. Centrifuge the lysate at 4,000 x g for 20 min at 4 °C. Collect the supernatant as the soluble protein fraction.
- Wash the remaining pellet and resuspend it in 10% (v/v) Bugbuster in MilliQ water. Subject the suspension to sonication to fully recover the insoluble protein fraction (inclusion bodies).
- Treat samples with 100 µL of SDS-PAGE sample buffer containing 5% β-mercaptoethanol. Incubate the mixture at 95 °C for 5 min to ensure complete protein denaturation.
- SDS-PAGE electrophoresis
- Load the denatured lysates onto duplicate 15% SDS-PAGE gels for standard electrophoretic separation.
- Wash one gel with water for 1 h. Stain overnight using GelCode Blue Stain Reagent. Destain with water the following day until bands are clearly visualized.
- Visualize and document (Figure 2A) the stained gel to assess total protein profiles (TCP) and fraction distribution using Biorad Gel Doc instrument with Image Lab.
- Western blotting (Immunodetection)
- Equilibrate the unstained gel, a nitrocellulose membrane, filter papers, and sponges in transfer buffer (20 mM Tris-HCl pH 7.4, 150 mM NaCl, 0.1% Tween 20). Assemble the transfer sandwich and perform the transfer at 100 V for 1 h at ambient temperature.
- Incubate the membrane in blocking buffer (5% skimmed milk in TBST) for 1 h at room temperature to prevent non-specific binding.
- Incubate the membrane with Mouse anti-HisTag primary antibody (diluted 1:1,000 in blocking buffer) overnight at 4 °C with gentle agitation.
- Wash the membrane three times with TBST for 5 min each. Incubate the membrane with HRP-conjugated anti-mouse IgG (diluted 1:5,000 in blocking buffer) for 1 h at room temperature.
- Perform a final round of three TBST washes. Apply Enhanced Chemiluminescence (ECL) substrate to the membrane for 1 min and visualize using a chemiluminescence imager or by exposure to X-ray film. Document the image (as seen in Figure 2B).
- IB isolation and affinity purification
- Resuspend the cell pellet in lysis buffer (100 mM Tris·Cl, pH 7.0, 5 mM EDTA, 5 mM DTT (770 mg/liter), 5 mM benzamidine·HCl (780 mg/liter)) and perform mechanical lysis (e.g., French press/ Sonication). Centrifuge (20,000 x g, 4 °C for 20 min) to isolate the insoluble KSI-Mel4 IB pellet.
- Wash pellet thoroughly with wash buffer (100 mM Tris·Cl, pH 7, 5 mM EDTA, 5 mM DTT, 2 M urea, 2% (w/v) Triton X-100). Solubilize the pellet in not greater than 2M urea.
NOTE: The concentration of urea used to solubilize IB should be within the working range of the TEV protease. - Quantify the isolated IB using the BCA kit following the manufacturer's instructions.
- Mix Pierce Reagent B and Reagent A in a volume-to-volume ratio of 1:50. Calculate the total volume needed based on the number of standards and samples to be run in triplicate.
- Using Bovine Serum Albumin (BSA) as the reference, prepare a series of dilutions to create a standard curve ranging from 3,000 µg/mL to 200 µg/mL.
- Using a 96-well plate, pipette 25 µL of each BSA standard and sample (including purified supernatant and resuspended precipitate) into the wells.
- Add 200 µL of the prepared BCA Working Reagent to each well containing a standard or sample. Briefly mix the plate and incubate for 1 to 2 h at 37 °C to allow for color development.
- Following incubation, measure the absorbance of the plate at 562 nm using a spectrophotometer. Plot the absorbance of the BSA standards against their known concentrations to generate a linear or quadratic standard curve.
- Determine the protein concentration of the His-KSI-Mel4 or recombinant Mel4 samples by comparing their absorbance values against the generated standard curve. The concentrations before and after TEV cleavage are shown in Figure 3.
- Enzymatic cleavage and tag removal
- Cleavage reaction: His-tag TEV Protease (recommended molar ratio 1:50 to 1:100 Protease: Fusion Protein). Incubate 16 h at 4 °C for maximum efficiency.
- Tag removal and immobilized metal affinity chromatography (IMAC) purification:
- Pass the cleavage reaction mixture over a fresh nickel-nitrilotriacetic acid (Ni-NTA) column. Equilibrate Ni-NTA resin with the binding buffer (Lysis Buffer).
- Load the cleavage reaction mixture. The His-tagged components (KSI fragment and TEV protease) bind to the resin.
- Collect the flow-through, which contains the non-tagged recombinant Mel4 peptide with residual G, S, A, M, C, and H amino acids from the TEV cleavage site.
- Ensure that this extra amino acid does not affect the activity of AMP by performing the MIC assay with chemically synthesized Mel4 as a control.
- Elute the bound KSI fragment and TEV protease using an elution buffer gradient (500 mM Imidazole, 500 mM NaCl, 20 mM Sodium phosphate buffer, pH 8).
- Perform BCA assay as outlined in Step 2.6.3.
3. Antimicrobial activity
- Media preparation
- Prepare media [Mueller Hinton Broth, cation-adjusted (CAMHB), Trypticase Soy Broth (TSB), D/E neutralizing broth, and Trypticase Soy agar (TSA)] as per manufacturer's instructions. Also, prepare 1 × phosphate-buffered saline (PBS) from 10 × concentrated PBS. Then autoclave these at 121 °C at 15 lbs/in2.
- Peptide stock preparation
- Dissolve AMP and mimics in sterile water at a high concentration, e.g., 20 mM or at least 2 mg/mL. If the peptide is insoluble, use sterile water containing a final concentration of 0.01% acetic acid16. If adsorption to plastic surfaces is expected, supplement the stock solution with 0.2% (w/v) BSA, as it acts as a blocking agent17.
NOTE: Dimethyl sulfoxide (DMSO) is also recommended for dissolving peptides or mimics that are insoluble in water. Prepare a concentrated stock solution, such as 20 mM or 2 mg/mL. - Filter-sterilize the peptide stock using a 0.22 µm syringe filter under aseptic conditions.
- Prepare aliquots of the AMP stock and store at -20 °C (or per the stability of the AMP). Prepare an identical solvent control.
- Dissolve AMP and mimics in sterile water at a high concentration, e.g., 20 mM or at least 2 mg/mL. If the peptide is insoluble, use sterile water containing a final concentration of 0.01% acetic acid16. If adsorption to plastic surfaces is expected, supplement the stock solution with 0.2% (w/v) BSA, as it acts as a blocking agent17.
- Bacterial inoculum preparation
- Streak the bacterial isolate to be tested onto a nutrient-rich medium such as TSA to obtain pure, well-isolated colonies.
- Incubate the plate aerobically at 36 ± 1 °C for 18-24 h.
- Select three to five morphologically similar, well-isolated colonies from the culture plate using a sterile inoculating loop. Transfer them into a sterile tube containing 5–10 mL of TSB or CAMHB. To achieve a uniform suspension, gently rub the loop with bacterial colonies against the inner wall of the tilted tube to obtain a homogenous suspension.
- Incubate the broth culture at 36 ± 1 °C while shaking at 180 rpm for 18 to 24 h.
- Centrifuge the overnight culture at 3,000 x g for 10 min at 25 °C and wash the bacterial pellet three times with sterile 1 × PBS.
- In a sterile container, dispense 2 mL of 1 × PBS, then add 50–100 µL of washed bacterial suspension, and vortex for 5–10 s to achieve uniformity.
- Measure the optical density at 600 nm (OD600) using a spectrophotometer. Briefly, add 200 µL of the bacterial suspension to a 96-well plate, along with the same volume of 1× PBS as a blank, and measure the OD600 to obtain an equivalent of 0.1, corresponding to approximately 1–2 × 10⁸ CFU/mL (verify by viable plate count on TSA).
- Dilute the adjusted suspension 1:100 in CAMHB to obtain a final inoculum of 106 CFU/mL.
- Plate setup
- Label a sterile, flat-bottomed 96-well plate with the bacterial strain, AMP name, date, and initials of the scientist. On the plate, mark the locations for test, blank, and control wells on the lid.
- Dispense 200 µL of AMP solution (highest concentration) into the first column of the plate. To the remaining wells, from column 2 to 12, add 100 µL of CAMHB.
- Using a multichannel pipette, perform twofold serial dilutions of the AMP from column 1 through column 10, discarding 100 µL from the tenth column.
- Add 100 µL of the prepared bacterial inoculum (106 CFU/mL) to each well except the sterility control (blank). This will yield a final bacterial concentration of approximately 5 × 10⁵ CFU/mL in the test wells. Add 100 µL of CAMHB to the blank wells to bring the final volume to 200 µL. Prepare triplicate wells for each concentration.
NOTE: For AMPs that precipitate when diluted in CAMHB, addition of acetic acid with 0.1–0.2% BSA may resolve the issue; optimization may require empirical testing16. In such cases, include solvent control wells (containing CAMHB plus acetic acid and/or BSA). - Similarly, perform MIC for AMP mimic (RK758) and comparator antibiotic (e.g., colistin).
- Cover the plate with its lid, seal with cling wrap to prevent evaporation, and incubate at 36 ± 1 °C for 18–24 h.
- Include a reference strain of E. coli (e.g., mcr-1-harboring E. coli NCTC 13846) in parallel and process similarly to the peptide or peptide mimic.
- After incubation, record the MIC.
- Determination of MIC
- Measure the OD600 of each well using a microplate reader. Calculate the percentage reduction in growth relative to the untreated growth control. The MIC is defined as the lowest concentration of the AMP that results in at least a 90% reduction in OD600 compared to the growth control18.
- Determine MIC values from at least three independent experiments performed in triplicate. Report the results as mean ± standard deviation to ensure reproducibility.
NOTE: The MIC for the control strain, E. coli NCTC 13846, should be within one two-fold dilution of the expected MIC of colistin. Confirm that solvent controls containing DMSO, acetic acid, and BSA had no inhibitory activity on their own.
- Determination of Minimum Bactericidal Concentration (MBC)
- From the wells at and above the MIC, as well as one concentration below, transfer 100 µL of the bacterial suspension into 900 µL of D/E broth to prepare serial dilutions.
- Plate 20 µL of each diluted suspension onto TSA in triplicate to determine viable bacterial counts.
- After overnight incubation at 36 ± 1 °C for 24 h, count the colonies, multiply by the respective dilution factor, and compare the viable counts with those from the growth control well, processed in the same way.
- The MBC is defined as the lowest concentration of the antimicrobial agent that results in a 99.9% (≥ 3 log10) reduction in viable bacterial count compared to the initial inoculum after 24 h of incubation (growth control) under standard conditions19.
- Reporting
- Report MIC and MBC in µg/mL and µM.
- Convert µg/mL to µM using µM = µg/mL × 1,000/ molecular weight (g/mol)
- Infectious waste disposal
- Discard all materials that have been in contact with live bacterial cultures, including 96-well microtiter plates, pipette tips, and Falcon tubes, into designated biohazard waste bags.
- Autoclave the collected biohazard waste at 121 °C for 15–20 min under 15 psi pressure to ensure complete sterilization prior to disposal, in accordance with institutional biosafety guidelines.
4. Cytotoxicity
- Cell counting and seeding for toxicity assay
- Maintain cells, such as mouse fibroblast L929 cells in a 75 cm2 flask in Dulbecco’s minimum essential medium (DMEM) containing 10% fetal bovine serum (FBS) and 1% antibiotics (streptomycin sulfate and penicillin G) at 37 °C with 5% CO2.
- Wash the cells with 1x PBS and trypsinize with 0.25% trypsin-EDTA. Count the cells by mixing 50 µL of cell suspension with 50 µL of 0.4% Trypan Blue and load 10 µL into a hemocytometer.
- Count viable (unstained) and dead (blue) cells in four corner squares and calculate the total cell number using: Total cells = (average live cell count × 104 × 2 [dilution factor]).
- Calculate viability (%) = (live / [live + dead]) × 100.
- Adjust the final cell concentration to 5 × 10⁴ cells/mL (corresponding to 5,000 cells/well in 100 µL using the DMEM medium).
- Seed 100 µL of cell suspension into each well of a sterile 96‑well plate. Incubate for 24 h at 37 °C with 5% CO2 to allow adherence.
- Preparation of Mel4 and RK758 test solutions
- Prepare working solutions of Mel4/RK758 in plain DMEM (without FBS and antibiotics) at the final target concentrations (1,000, 500, 250, 125, 62.5, 31.25, 15.6, 7.8, and 3.9 µM) using the stock solution prepared as described in Step 3.2.
- Remove culture medium from each well. Add 100 µL of the corresponding 1× Mel4/RK758 working solution directly to the wells.
- Add 100 µL of DMEM to the designated negative control (NC) wells.
- Add 100 µL of DMSO in positive control (PC) designated wells (Besides DMSO, cytotoxic agent such as Triton X-100 is recommended as positive control).
- Add 100 µL of 1 x PBS as a blank control.
NOTE: Perform all treatments and controls in triplicate. Handle DMSO with gloves and eye protection; avoid skin contact and dispose of solvent waste according to institutional procedures.
- 3-(4,5-dimethylthiazol-2-yl)-2,5-diphenyltetrazolium bromide (MTT) assay
- After 24 h of Mel4/RK758 exposure, aspirate the test media carefully without disturbing the cells.
NOTE: The treatment duration with antimicrobial compounds may vary depending on the specific experimental design. - Prepare an MTT working solution by diluting the 5 mg/mL stock solution 1:9 with plain DMEM (final concentration 0.5 mg/mL).
- Add 100 µL of the MTT working solution to each well. Cover the plate with aluminum foil to protect from light and incubate for 2 h at 37 °C until purple formazan crystals form.
NOTE: MTT is light‑sensitive and toxic. Handle gloves and dispose of waste in accordance with institutional biosafety procedures. Always turn off the light while processing with the MTT reagent.
- After 24 h of Mel4/RK758 exposure, aspirate the test media carefully without disturbing the cells.
- Formazan dissolution and absorbance measurement
- Carefully remove the MTT solution from each well. Add 100 µL of DMSO to each well to dissolve the formazan crystals.
- Place the plate on a shaker for 5 min to ensure complete dissolution. Measure the absorbance at 570 nm using a microplate reader.
- Data analysis and 50% cytotoxic concentration (IC50 or CC50) determination
- Subtract blank absorbance values (PBS) from all readings and use the blank corrected for calculation.
- Calculate cell viability (%) using the equation: Viability (%) = (Atreated/ ANC (cell)) × 100.
- Calculate the IC50 or CC50 using GraphPad Prism software.
NOTE: Repeat experiments in triplicate and report data as mean ± standard deviation.
Results
Synthesis of RK758
Analytical data up to intermediate 7 were published previously14. The analytical data for RK758 and intermediate 8–9 are as follows:
tert-butyl (2-(3-phenylthioureido)ethyl)carbamate (8):
The product 8 was obtained as an off-white solid (1.89 g, 87%); m.p. 167.4–168.3 °C; 1H NMR (300 MHz, DMSO-d6) δ 9.58 (s, 1H), 7.71 (s, 1H), 7.44–7.29 (m, 4H), 7.11 (t, J = 12.0 Hz, 1H), 6.88 (br s, 1H), 3.55-3.53 (m, 2H), 3.13 (q, J = 4.0 Hz, 2H), 1.59 (s, 9H); 13C NMR (75 MHz, DMSO-d6) δ 180.9, 156.3, 139.5, 129.1, 124.7, 123.7, 78.2, 44.3, 28.7; HRMS (ESI+): m/z calculated for C14H21N3O2SNa+ [M + Na]+: 318.1247, found: 318.1252.
tert-butyl (S,Z)-(3-((1H-indol-3-yl)methyl)-1-(2-(2-naphthamido)-5-bromophenyl)- 1,4-dioxo-9-(phenylimino)-2,5,8,10-tetraazadodecan-12-yl)carbamate (9):
The product 9 was obtained as a white solid (0.253 g, 62%); m.p. 173.4–174.9 °C; 1H NMR (400 MHz, DMSO-d6) δ 12.23 (s, 1H), 10.86 (s, 1H), 9.61 (s, 1H), 9.27 (d, J = 8.0 Hz, 1H), 8.57-8.54 (m, 2H), 8.44 (s, 1H), 8.11 (d, J = 4.0 Hz, 1H), 8.06-8.03 (m, 3H), 7.84 (dd, J = 4.0, 12.0 Hz, 1H), 7.78 (d, J = 12.0 Hz, 2H), 7.69–7.60 (m, 2H), 7.36 (t, J = 8.0 Hz, 2H), 7.27-7.23 (m, 5H), 7.01- 6.97 (m, 3H), 4.82-4.78 (m, 1H), 3.14-3.13 (m, 10H), 1.32 (s, 9H); 13C NMR (100 MHz, DMSO-d6) δ 172.3, 167.8, 165.1, 156.3, 154.4, 138.9, 136.5, 135.4, 134.9, 132.6, 131.7, 129.9, 129.1, 128.7, 128.4, 128.2, 127.6, 127.6, 126.4, 124.8, 124.1, 123.6, 122.8, 121.4, 118.9, 118.7, 115.1, 111.8, 110.9, 78.4, 55.2, 42.3, 41.9, 39.4, 38.3, 29.5, 28.6, 27.9; HRMS (ESI+): m/z calculated for C45H47BrN8O5 [M + H]+: 859.2926, found: 859.2925.
(S,E)-N-(2-((1-((2-(3-(2-aminoethyl)-2-phenylguanidino)ethyl)amino)-3-(1H-indol- 3-yl)-1-oxopropan-2-yl)carbamoyl)-4-bromophenyl)-2-naphthamide (RK758) (10):
RK758 was obtained as an off-white solid (0.039 g, 75%); m.p. 240.0–240.9 °C; 1H NMR (400 MHz, MeOD-d4): δ 8.39 (s, 1H), 8.27 (d, J = 12.0 Hz, 1H), 7.98–7.95 (m, 3H), 7.88 (d, J = 8.0 Hz, 1H), 7.79 (d, J = 4.0 Hz, 1H), 7.71-7.60 (m, 4H), 7.40 (t, J = 8.0 Hz, 1H), 7.30-7.20 (m, 4H), 7.16 (s, 1H), 7.05-6.97 (m, 2H), 4.88-4.86 (m, 1H), 3.33-3.32 (m, 3H), 3.27-3.24 (m, 5H); 13C NMR (100 MHz, MeOD-d4): δ 174.3, 168.5, 166.4, 154.6, 137.1, 136.7, 135.1, 134.7, 131.4, 132.6, 131.3, 130.8, 129.8, 128.9, 127.97, 127.8, 127.9, 127.6, 127.5, 127.2, 126.8, 125.6, 123.5, 123.24, 123.2, 118.6, 117.8, 116.1, 111.1, 109.6; HRMS (ESI+): m/z calculated for C40H39BrN8O3 [M + H]+: 759.2401, found: 759.2407.
The synthesis of RK758 was conducted with an overall yield of 17% from Cbz-L-Tryptophan in 7 steps (Figure 4). The overall yield of this process was 44% to key intermediate 7 and 19% to RK758. The 1H NMR data indicate high purity of the final compound with no major detectable impurities.
Colony PCR screening confirmed successful insertion of the Mel4 and His-KSI-Mel4 cassettes in selected transformants (Figure 5A). PCR analysis of miniprep-isolated plasmids further verified the expected amplicon size, supporting correct construct assembly prior to transformation into BL21(DE3) for expression (Figure 5B).
Recombinant Production and Purification of Highly Cationic Antimicrobial Peptide Mel4
Although Mel4 was obtained commercially from AusPep Peptide Company with a minimum purity of 90%, it was synthesized by SPPS, and a recombinant approach was also employed to produce Mel4 biologically. At the end of the protocol, Western blot analysis of the Total cell protein (TCP) from the lysed cell pellet confirmed the expression of the recombinant HIS-KSI-Mel4 fusion protein. The protein samples were separated by SDS-PAGE and visualized using a protein ladder as a molecular weight reference. A distinct band corresponding to the expected molecular weight of the HIS-KSI-Mel4 fusion protein was observed, confirming successful expression of the target protein in the host cells (Figure 5B).
From the protein sequence of the selected motif, the theoretical amino acid composition was calculated and compared with the experimental amino acid analysis results obtained from the purified HIS-KSI-TEV-Mel4 IB peptide. The comparison showed good correlation between the predicted and experimentally determined amino acid ratios, confirming the accuracy of the expressed peptide sequence and its successful isolation in the inclusion body fraction (Table 2).
Asparagine is converted to aspartic acid and glutamine to glutamic acid. Amino acid analysis method is insensitive to cysteine and tryptophan and those are not analyzed by this method. This consideration must be made in analyzing the results.
Antibacterial activity of Mel4 and RK758
The minimum inhibitory concentrations (MICs) of RK758, Mel4, and colistin were evaluated against two Gram-negative bacterial strains, K. pneumoniae JIE 2709 and E. coli NCTC 13846 (Table 3). RK758 exhibited an MIC of 16 µg/mL (21 µM) against both K. pneumoniae and E. coli. In comparison, Mel4 showed MICs of 62.5 µg/mL (26.6 µM) for K. pneumoniae and 125 µg/mL (53.2 µM) for E. coli, indicating lower potency than RK758. Colistin was used as a comparator antibiotic, demonstrating the lowest MIC of 1 µg/mL (0.87 µM) for K. pneumoniae, while the colistin-resistant E. coli reference strain exhibited an MIC of 8 µg/mL (6.9 µM).
Cytotoxicity effect of Mel4 and RK758
The cytotoxic potential of Mel4 and RK758 was assessed in L929 mouse fibroblast cells (ATCC CCL-1) using the MTT assay following 24 h exposure to serial concentrations. Both compounds exhibited typical sigmoidal dose-response curves analyzed by nonlinear regression with the “inhibitor vs. normalized response - variable slope” model in GraphPad Prism (version 9.5.1), confirming concentration-dependent inhibition of cell viability. RK758 displayed a CC50 value of 172.6 µM, whereas Mel4 showed slightly higher cytotoxic potency with a CC50 of 147.5 µM, representing approximately 1.17-fold greater cytotoxicity than RK758 (Figure 6 and Figure 7).

Figure 1: A schematic representation of the expression cassette of p15TV-L-His-KSI-Mel4. Schematic map of the p15TV-L expression construct showing the T7 promoter, ribosome binding site (RBS), 6×His purification tag, ketosteroid isomerase (KSI) fusion partner, TEV protease cleavage site, and the Mel4 peptide sequence followed by the T7 transcription terminator. Please click here to view a larger version of this figure.
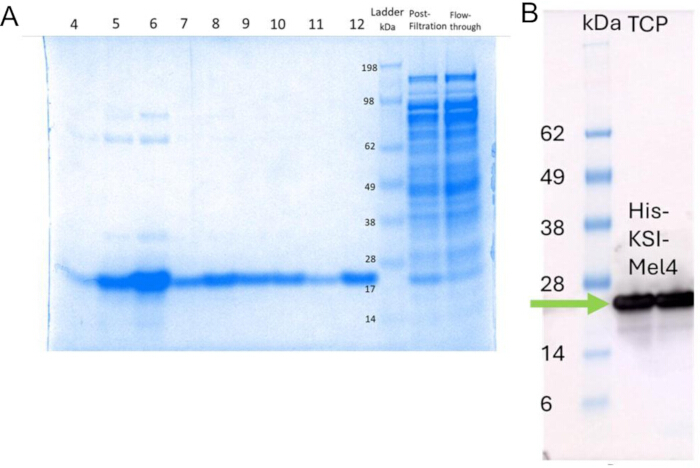
Figure 2: SDS-PAGE and western blot analysis of recombinant protein expression. (A) SDS-PAGE of inclusion bodies and total cell proteins after filtration and flow-through of crude cell lysate. (B) Western blot of total cell protein. Green arrow indicates the position of the protein of interest at the expected molecular weight. Please click here to view a larger version of this figure.
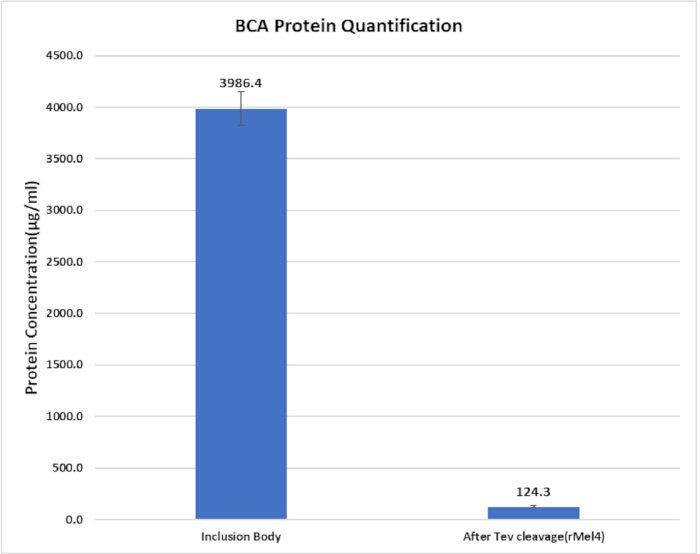
Figure 3: Quantification of recombinant protein before and after TEV cleavage. Bar graph showing protein concentrations determined by BCA assay for the isolated inclusion body fraction and the cleaved recombinant Mel4 obtained after TEV protease treatment. Error bars represent experimental variation between measurements. Please click here to view a larger version of this figure.
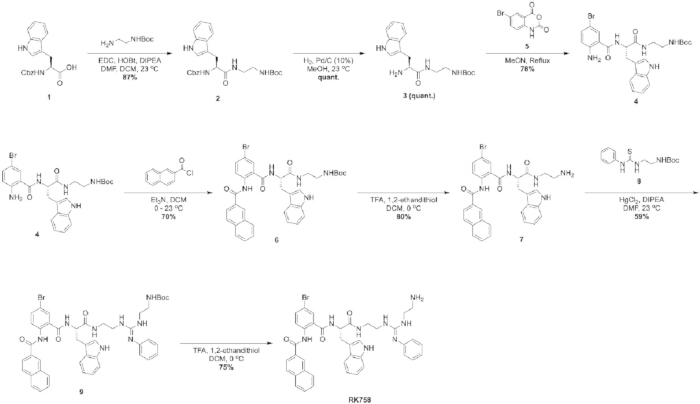
Figure 4: Overall synthetic approach to obtain RK758. Reaction scheme outlining the seven-step chemical synthesis of RK758 starting from Cbz-L-tryptophan, including intermediate formation, functional group transformations, and final deprotection to obtain the peptide mimic. Please click here to view a larger version of this figure.
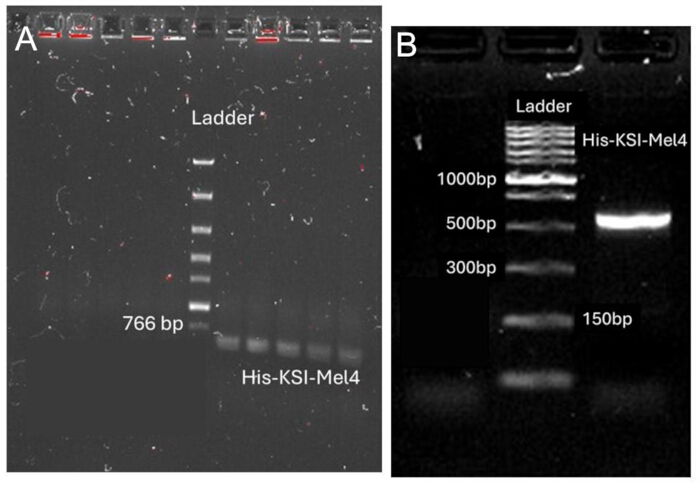
Figure 5: Agarose gel electrophoresis of recombinant plasmids. (A) Colony PCR of transformants for His-Mel4 and His-KSI-Mel4. (B) PCR confirmation of plasmids after miniprep. Please click here to view a larger version of this figure.
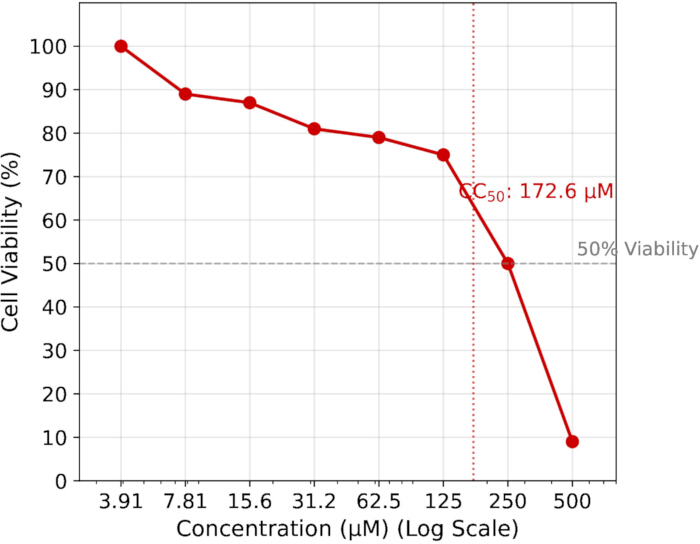
Figure 6. Cytotoxicity of RK758 against L929 fibroblast cells. Dose-response curve showing the effect of RK758 on cell viability across increasing concentrations. CC50 values were calculated by nonlinear regression using the “inhibitor vs. normalized response - variable slope” model in GraphPad Prism, confirming concentration-dependent inhibition of cell viability. Data represents the mean ± SD of three independent biological replicates. Please click here to view a larger version of this figure.
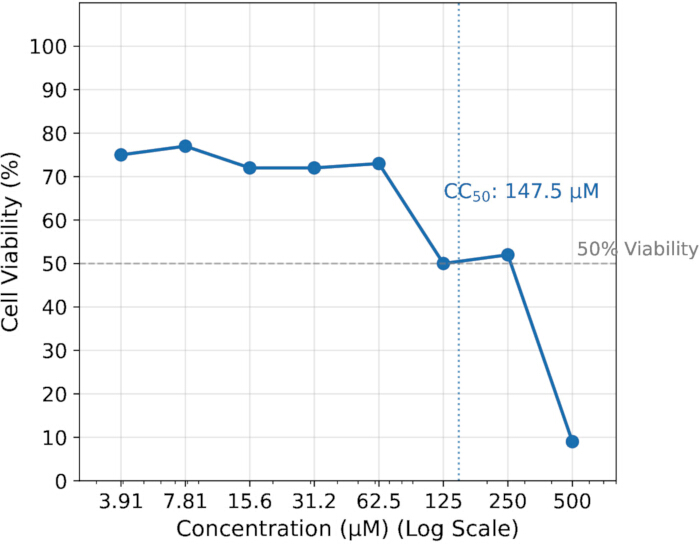
Figure 7: Cytotoxicity of Mel4 against L929 cells. Dose-response curve showing the concentration-dependent effect of Mel4 on cell viability. CC50 values were calculated by nonlinear regression using the “inhibitor vs. normalized response - variable slope” model in GraphPad Prism, confirming concentration-dependent inhibition of cell viability. Data represents the mean ± SD of three independent biological replicates. Please click here to view a larger version of this figure.
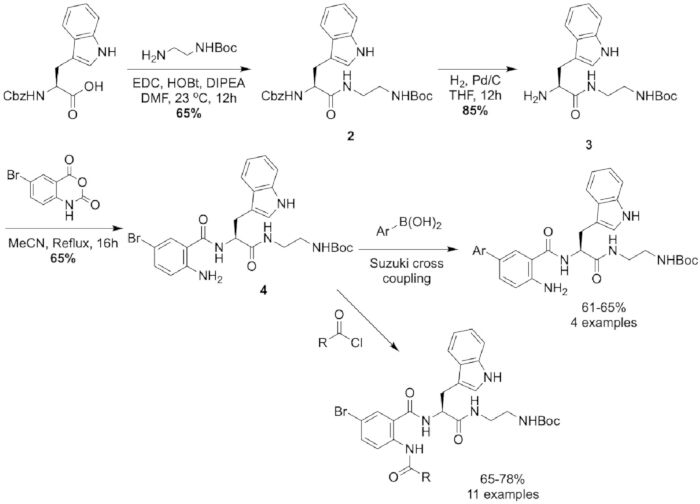
Figure 8: Modified synthetic strategy starting from Cbz-L-tryptophan. Alternative synthetic pathway illustrating the preparation of anthranilamide intermediates using Cbz-L-tryptophan and subsequent functionalization steps to enable structural diversification. Please click here to view a larger version of this figure.

Figure 9: Alkylation of thiourea followed by nucleophilic substitution with an amine substrate. Proposed reaction pathway involving alkylation of the thiourea sulfur followed by nucleophilic substitution with an amine substrate to generate guanidine-containing products. Please click here to view a larger version of this figure.
| Section | Name/Feature | Sequence | |||
| Primers | XbaI_KNRPR_Start | 5’-TAGGGGAATTGTGAGCGGATAACAATTCCCCTCTAGAAATAATT-3’ | |||
| T7_TERM_REV | 5’-CCAAGGGGTTATGCTAGTTATTGCTCA-3’ | ||||
| Gene cassette | His-KSI-Mel4 amino acid sequence | MDHHHHHHMIDETQRKATVLEYFERVNAKDLDGVVKLF ATDAVVADPVGAPPVAGEEALRAYFQRVLHEFDTHDVPGV PSGAQDGQSVALPLKATINNPQDPTGGVRLDVNLVSVFTIG EDGLISEMRAYWGLTDIAPAGASSGRENLYFQGKNKRKRRR RRRGGRRRR | |||
| DNA sequence | 5’-TAACAATTCCCCTCTAGAAATAATTTTGTTTAACTTTAAGAAGGA GATATACCATGGATCACCACCACCATCACCACATGATTGACGAGAC GCAACGTAAAGCGACGGTCTTAGAGTATTTTGAACGCGTGAATGCAA AAGACTTGGATGGCGTGGTTAAACTCTTTGCGACGGACGCCGTTGT AGCCGACCCTGTTGGTGCACCACCAGTGGCTGGTGAGGAGGCACTC CGTGCCTACTTCCAGCGCGTCTTGCATGAATTTGACACCCATGATGTCC CGGGCGTTCCATCTGGTGCTCAGGATGGCCAATCAGTCGCACTCCCAC TTAAAGCAACCATCAACAATCCTCAAGATCCAACAGGCGGGGTCCGCC TTGATGTGAACTTAGTGAGCGTATTCACGATTGGCGAAGACGGGTTAAT CTCCGAGATGCGTGCGTACTGGGGGTTGACTGATATTGCTCCGGCAGGT GCAAGCAGTGGTCGCGAGAACTTGTACTTCCAAGGTAAGAACAAGCGTA AGAGACGCCGGCGCCGCCGGGGAGGACGGAGACGTCGCTAATCGAAC TCGAGATCCGGCT-3’ | ||||
Table 1: Primer sequences used for PCR verification and full gene cassette sequence of the final plasmid construct.
| Aminoacid | Calculated | Tested |
| Histidine | 4.70% | 4.70% |
| Serine | 3.60% | 3.40% |
| Arginine | 10.70% | 9.20% |
| Glycine | 9.50% | 11% |
| Aspartic acid | 11.30% | 11.50% |
| Glutamic acid | 8.90% | 8.90% |
| Threonine | 4.70% | 4.60% |
| Alanine | 9.50% | 9.70% |
| Proline | 5.30% | 5.30% |
| Lysine | 4.10% | 4.50% |
| Tyrosine | 2.40% | 2.20% |
| Methionine | 1.80% | 1.90% |
| Isoleucine | 3.00% | 3.20% |
| Leucine | 7.10% | 7.40% |
| Phenyalanine | 3.60% | 3.60% |
| Valine | 9.50% | 8.90% |
| Tryptophan | 0.60% | - |
Table 2: Analysis of amino acid compositions.
| Bacterial strains | MIC µg/mL (µM) | ||
| RK758 | Mel4 | Colistin | |
| K. pneumoniae JIE 2709 | 16 (21) | 62.5 (26.6) | 1 (0.87) |
| E. coli NCTC 13846 | 16 (21) | 125 (53.2) | 8 (6.9) |
Table 3: MIC of RK758, Mel4, and colistin against Gram-negative bacteria.
Discussion
The protocol described here provides a comprehensive framework for the production and functional evaluation of the cationic AMP Mel4 (which can be altered for use with other AMPs) and the peptide mimic RK758. This workflow combines multi-step chemical synthesis or recombinant expression in E. coli with antimicrobial and cytotoxicity assays. The integration of these approaches provides a versatile platform for systematic AMP research, enabling direct comparisons between chemically synthesized and biologically produced peptides. Several steps in this protocol are particularly critical for successful peptide production and activity assessment.
RK758 is a synthetic peptide mimic based on an anthranilamide scaffold. During the compound screening phase for the discovery of novel AMP mimics, it is difficult to use in silico screening to plan a compound library. Therefore, it is important to base these mimics on a scaffold that allows for diversity in the library of compounds. The anthranilamide scaffold was chosen for this reason. An added benefit of an anthranilamide-based scaffold is that the RK758 metabolite, 5-Bromoanthranilic acid, has been shown to possess antimicrobial properties.
Previous works optimizing the structure and antibacterial activity of RK758 and analogs used different synthetic procedures. The original structure-optimization study investigated the effect of different cationic groups and substituents on the anthranilic phenyl group. Hence, the synthesis started with the ring-opening of Isatoic anhydride derivatives with L-tryptophan methyl ester. The product could then be modified as shown by Kuppusamy et al.15. A follow-up study investigated the structure and location of the hydrophobic group. The follow-up study showed that the Bromo-substituted scaffold tolerated a variety of hydrophobic groups at the naphthyl position and that intermediate 4 was amenable to Suzuki cross-coupling at the bromo position, as shown in Figure 8.
The current work has addressed some of the problems of the former approaches. In the approach depicted in Figure 4, despite the synthesis of intermediate 11 reporting purification via trituration with diethyl ether, attempts to replicate this result have since yielded gummy impure mixtures that require chromatographic purification. Additionally, intermediate 6 also required chromatographic purification using this approach. Overall, the original work obtained an intermediate 7 in 21% yield in six steps from L-tryptophan methyl ester hydrochloride. The second approach15, although lower yielding (14% from Cbz-L-tryptophan), produced intermediates that were easier to handle in fewer steps.
This study identified that coupling Cbz-L-Trp with N-Boc-ethylenediamine required optimization to ensure no residual DMF remained in the product, as observed during initial studies to scale up this reaction. Using a mixed solvent system with a 3:8 (v/v) ratio of DMF to DCM reduced the amount of DMF, facilitating easier removal during workup; however, substituting chlorinated solvents could raise concerns about environmental impact. This modification also improved the yield to 87% which is likely attributed to the urea byproduct from EDC precipitating in the DCM mixture, acting as a driving force for the reaction. The hydrogenation was also identified as a bottleneck, as these reactions typically yield>90%. This study found that substituting THF for methanol yielded 3 in quantitative yield, compared with 85% in previous work, and reduced the reaction time to 4 h. This could also be attributed to a purer starting material being used, since the original study likely contained residual DMF, which could have poisoned the palladium catalyst. Overall, compared with previous approaches, the yield to intermediate 7 has improved to 48% in 5 steps from Cbz-L-Tryptophan. In earlier experiments (discussed above), the overall yield was 21%, with 14% for follow-up reactions, whereas in this study, an overall yield of 48% was achieved for compound 7, demonstrating the diversity of analogs that can be synthesized from appropriately substituted isatoic anhydride derivatives.
The highly deactivated amine in anthranilamide 4 (see Figure 8) requires three equivalents of acid chloride for efficient reaction. When only stoichiometric amounts are employed, incomplete conversion of 4 to 6 occurs, complicating purification because of the similar chromatographic and solubility characteristics of intermediates 4 and 6. The authors acknowledge this is a limitation of the scaffold and are working to develop a new methodology to reduce the excess acid chloride required.
The penultimate reaction to attach thiourea 8 to amine 7 requires mercury (II) chloride, which is highly toxic and extremely harmful to the environment, potentially precluding this method for large-scale synthesis. This approach was used in the current work, since the mercury (II) mediated attachment of thioureas proceeds at room temperature. An alternative method using thiourea 8 involves alkylating the sulfur atom, followed by nucleophilic substitution with an amine substrate, as depicted in Figure 9. This type of reaction has been reported, however, in many cases, it requires elevated temperatures and basic conditions that may lead to the formation of side products with the substrates20,21. Alternatively, using a similar methylated thiourea substrate, a photocatalytic approach has been reported by Saetan et al.20. They report that this reaction occurs at ambient temperature under irradiation with light from a white LED. It was reported that this reaction occurs with a variety of primary and secondary amines, yielding products in excess of 80%. For the final reaction, trituration with diethyl ether followed by freeze-drying yields a product typically requiring no further purification (>95% pure by 1H NMR in MeOD-d4). The primary impurity is residual, high-boiling-point 1,2-ethanedithiol, which is readily detectable by its distinctive cabbage-like odor. Recombinant expression of Mel4 requires induction at an optimal optical density (OD600 0.5–0.6) and careful maintenance of induction temperature to maximize inclusion body formation while preserving bacterial viability22.
Antimicrobial and cytotoxicity assays also include steps essential for obtaining accurate, reproducible results. Precise inoculum preparation and serial dilution of peptides are required, as small variations in bacterial density or peptide solubility can significantly alter measured MIC and MBC values16. In MTT cytotoxicity assays, accurate cell counting, uniform seeding, and complete formazan dissolution are crucial to obtain reliable metabolic readouts23.
Several modifications to the protocol can address common challenges. Peptides with limited aqueous solubility can be dissolved in 0.01% acetic acid16 while peptides or mimics can also be solubilized in DMSO24 or supplemented with 0.1–0.2% BSA17 to prevent adsorption to plastic surfaces during MIC determination. Recombinant inclusion bodies can be solubilized and refolded by adjusting guanidinium chloride or urea concentrations, followed by stepwise dialysis. For MTT assays, gentle shaking and complete DMSO dissolution can reduce variability in absorbance readings.
The significance of this protocol lies in its integration of complementary production and evaluation strategies, offering advantages over standard single-method approaches. Many studies focus on a single method for peptide or mimic production, but no single approach is ideal for all compounds; selecting the appropriate method based on peptide properties ensures optimal yield and functionality. For example, chemical synthesis allows precise incorporation of non-natural amino acids and peptide mimics4, which may be challenging in recombinant systems. Conversely, recombinant expression offers cost-effective production of highly cationic peptides25 that may aggregate during chemical synthesis. By combining both methods with standardized functional assays, the protocol enables rigorous characterization of AMP activity and cytotoxicity, surpassing the scope of standard MIC assays alone26.
Compared with traditional standalone approaches, this protocol is broadly applicable to antimicrobial peptide research and therapeutic development. It can be adapted to explore structure-activity relationships, optimize peptide potency, and assess toxicity. Moreover, the methods can support high-throughput screening of peptide libraries, study of bacterial resistance mechanisms, and evaluation of combination therapies with conventional antibiotics. Beyond antibacterial applications, this workflow may also be applied to antiviral or antifungal peptide testing, surface coatings for infection control, and biomedical applications such as biofilm disruption or immunomodulation.
In conclusion, this protocol provides a versatile and reproducible workflow for the production, purification, and functional evaluation of AMPs and peptide mimics. By addressing critical methodological considerations, offering strategies for troubleshooting, and enabling diverse applications, it establishes a robust foundation for antimicrobial and biomedical research.
Disclosures
The authors have no conflicts of interest to declare.
Acknowledgements
The authors would like to acknowledge the Mark Wainwright Analytical Centre and Recombinant Product Facility (RPF) at the University of New South Wales. In particular, the Bioanalytical Mass Spectrometry Facility for HRMS analysis and the NMR facility for access to NMR instruments.
Materials
| Name | Company | Catalog Number | Comments |
|---|---|---|---|
| 1,2-ethanedithiol | Oakwood | M03555 | |
| 100X Antibiotics | Sigma Aldrich | A5955-20ML | |
| 1-Ethyl-3-(3-dimethylaminopropyl)carbodiimide Hydrochloride | Combi Blocks | SS-7536 | Referred to as EDC hereafter |
| 2-Naphthoyl chloride | Combi Blocks | OR-0173 | |
| Acetic acid | Ajax Finechem | R18401O | |
| Acetonitrile | VWR | 20060.35 | |
| Alkaline phosphatase | New England Biolabs | M0525S | |
| Bovine serum albumin (BSA) | Sigma Aldrich | A1933 | |
| Cation-adjusted Mueller-Hinton Broth (CAMHB) | Becton, Dickinson and Company | 212322 | |
| Cbz-L-Trp | Combi Blocks | QB-6691 | |
| Colistin | Sigma Aldrich | C4461 | |
| Dey-Engley (D/E) Neutralising Broth | Oxoid | R453042 | |
| Diatomaceous earth (Celite 545) | Sigma Aldrich | 102693 | 0.02-0.1 mm particle size |
| Dichloromethane (DCM) | VWR | 23366.327 | |
| Diethyl ether | Chem-Supply | EA036 | |
| Dimethyl Sulfoxide (DMSO) | Chem-Supply Pty Ltd | LCS-CHEM-0098 | |
| Dithiothreitol(DTT) | Thermo Scientific | J15397.03 | |
| DMEM culture medium | Thermo Fisher Scientific | UCS-BIO-0058 | |
| E. coli BL21(DE3) host | Sigma Aldrich | 70235-M | |
| Electroporator | Thermo Scientific | NEON1SK | |
| Ethyl acetate | Chem-Supply | EA011-2.5L-P | |
| Ethylenediaminetetraacetic acid (EDTA) | Thermo Scientific | 118432500 | |
| Fetal Bovine Serum (FBS) | Sigma Aldrich | 12003C-500ML | |
| His-tagged TEV Protease | Sigma Aldrich | T4455 | |
| Hydroxybenzotriazole Hydrate | Chem-Implex | 24755 | |
| Imidazole | Thermo Scientific | 288-32-4 | |
| Isopropyl β-D-1-thiogalactopyranoside (IPTG) | Sigma Aldrich | I6758 | |
| Luria-Bertani Broth (LB), | Thermo Scientific | 12795027 | |
| Lysis Buffer | Thermo Scientific | 89822 | |
| Mercury (II) Chloride | Sigma Aldrich | 215465 | |
| Methanol (HPLC Grage) | VWR | A452-4K | |
| MTT reagent | Sigma Aldrich | M2128-100MG | |
| N,N-Diisopropylethylamine (DIPEA) | Sigma Aldrich | 3440 | |
| N,N-Dimethyl formamide (DMF) | Chem-Supply | RP1051 | |
| NanoDrop | Thermo Scientific | ND-ONE | |
| N-Boc-ethylenediamine | Combi blocks | AM-1613 | |
| NTA Affinity Resin Column | Sigma Aldrich | 70666 | |
| Palladium on carbon | Sigma Aldrich | 205699 | 10% w/w Pd |
| Plasmid Purification kit | QIAGEN | 27104 | |
| Polypropylene microtiter tubes | SARSTEDT | 72.690.008 | |
| Silica Gel for flash column chromatography | Silicycle | R12030B | Silica Gel 60, 230-400 mesh |
| Silica gel Thin layer chromatography plate | Merk | 1055540001 | 0.2 mm layer thickness on aluminium backing with 254 nm fluorescent indicator |
| Sodium phosphate, 0.2M buffer soln | Thermo Scientific | J63816.AP | |
| Sterile flat-bottomed 96-well polypropylene microtiter plate with lid | Corning | 3599 | |
| T4 DNA Ligase | New England Biolabs | M0202S | |
| Triethylamine (Et3N) | Chem-Supply | TR02151000 | |
| Trifluoroacetic acid (TFA) | Sigma Aldrich | T6508 | |
| Tris-HCL | Thermo Scientific | J62848.AK | |
| Triton X-100 | Thermo Scientific | A16046.AE | |
| Trypan blue | MP BIOMEDICALS AUSTRALIA PTY LTD | ||
| Trypsin-EDTA (0.25%) | Sigma Aldrich | T4049-500ML | |
| Trypticase soya agar | Becton, Dickinson and Company | 211043 | |
| Urea | Thermo Scientific | 29700 | |
| Vector (T7 promoter) | - | high-copy number plasmid of choice |
References
- Naghavi, M., et al. Global burden of bacterial antimicrobial resistance 1990–2021: a systematic analysis with forecasts to 2050. Lancet. 404 (10459), 1199-1226 (2024).
- Antimicrobial resistance. , World Health Organization. Available at: https://www.who.int/news-room/fact-sheets/detail/antimicrobial-resistance (2023).
- Puri, B., Vaishya, R., Vaish, A. Antimicrobial resistance: Current challenges and future directions. Med. J. Armed Forces India. 81 (3), 247-258 (2025).
- Zhang, T., Jin, Q., Ji, J. Antimicrobial peptides and their mimetics: promising candidates of next-generation therapeutic agents combating multidrug-resistant bacteria. Adv. Biol. 9 (4), 2400461(2025).
- Pasupuleti, M., Schmidtchen, A., Malmsten, M. Antimicrobial peptides: key components of the innate immune system. Crit. Rev. Biotechnol. 32 (2), 143-171 (2012).
- Oliveira Júnior, N. G., et al. Antimicrobial peptides: structure, functions and translational applications. Nat. Rev. Microbiol. , (2025).
- Keshri, A. K., et al. LL-37, the master antimicrobial peptide, its multifaceted role from combating infections to cancer immunity. Int. J. Antimicrob. Agents. 65 (1), 107398(2025).
- Alzain, M., et al. Antimicrobial peptides: mechanisms, applications, and therapeutic potential. Infect. Drug Resist. , 4385-4426 (2025).
- Kuppusamy, R., Willcox, M., Black, D. S., Kumar, N. Short cationic peptidomimetic antimicrobials. Antibiotics. 8 (2), (2019).
- Xu, J. Peptides chemistry, manufacturing, and controls. Peptide Science: Chemical Ligation, Lead Generation, and Therapeutic Advances. , 471-508 (2025).
- Wang, Q., et al. Expression and purification of antimicrobial peptide buforin IIb in Escherichia coli. Biotechnol. Lett. 33 (11), 2121-2126 (2011).
- Cai, Z., et al. Peptide synthesis: a review of classical and emerging methods. Biofabrication. 18 (1), 012001(2026).
- Gentilucci, L., De Marco, R., Cerisoli, L. Chemical modifications designed to improve peptide stability: incorporation of non-natural amino acids, pseudo-peptide bonds, and cyclization. Curr. Pharm pseudo-peptide. Des. 16 (28), 3185-3203 (2010).
- Kuppusamy, R., et al. Tuning the anthranilamide peptidomimetic design to selectively target planktonic bacteria and biofilm. Antibiotics. 12 (3), 585(2023).
- Kuppusamy, R., et al. Guanidine functionalized anthranilamides as effective antibacterials with biofilm disruption activity. Org. Biomol. Chem. 16 (32), 5871-5888 (2018).
- Wiegand, I., Hilpert, K., Hancock, R. E. Agar and broth dilution methods to determine the minimal inhibitory concentration (MIC) of antimicrobial substances. Nat. Protoc. 3 (2), 163-175 (2008).
- Ji, S., et al. Adsorption and morphology analysis of bovine serum albumin on a micropillar-enhanced quartz crystal microbalance. J. Phys. Chem. B. 128 (41), 10247-10257 (2024).
- Yasir, M., Dutta, D., Willcox, M. D. Activity of antimicrobial peptides and ciprofloxacin against Pseudomonas aeruginosa biofilms. Molecules. 25 (17), (2020).
- Methods for the determination of susceptibility of bacteria to antimicrobial agents. terminology. Clin. Microbiol. Infect. 4 (5), 291-296 (1998).
- Saetan, T., Sukwattanasinitt, M., Wacharasindhu, S. A mild photocatalytic synthesis of guanidine from thiourea under visible light. Org. Lett. 22 (20), 7864-7869 (2020).
- Woodring, J. L., et al. Disrupting the conserved salt bridge in the trimerization of influenza A nucleoprotein. J. Med. Chem. 63 (1), 205-215 (2019).
- Terpe, K. Overview of bacterial expression systems for heterologous protein production: from molecular and biochemical fundamentals to commercial systems. Appl. Microbiol. Biotechnol. 72 (2), 211-222 (2006).
- Berridge, M. V., Herst, P. M., Tan, A. S. Tetrazolium dyes as tools in cell biology: new insights into their cellular reduction. Biotechnol. Annu. Rev. 11, 127-152 (2005).
- Deni, W. H., Gao, T., Wu, J. Protocol for reconstituting peptides/peptidomimetics from DMSO to aqueous buffers for circular dichroism analyses. STAR Protoc. 5 (1), 102850(2024).
- Lou, M., et al. Microbial production systems and optimization strategies of antimicrobial peptides: a review. World J. Microbiol. Biotechnol. 41 (2), 66(2025).
- Hancock, R. E., Sahl, H. G. Antimicrobial and host-defense peptides as new anti-infective therapeutic strategies. Nat. Biotechnol. 24 (12), 1551-1557 (2006).
Reprints and Permissions
