The current study describes a workflow for nanopore sequencing of plasmids when the chromosomal sequence is already known or of no interest. An initial plasmid DNA enrichment step ensures optimal plasmid sequence depth and maximizes the number of samples that can be sequenced per flow cell.
Method Article
Long-Read Plasmid Sequencing and Assembly Using Nanopore Sequencing-Based Workflows
* These authors contributed equally
In This Article
Summary
Abstract
The present study describes a workflow for nanopore sequencing designed to maximize plasmid DNA yield and sequencing accuracy. Researchers cover each step of the process, which includes plasmid DNA extraction, library preparation with rapid barcoding and adapter ligation, loading of the library onto a flow cell for sequencing, base calling (in real time or post-hoc), and sequence assembly using Autocycler. The authors also specify the computer requirements, which largely depend on whether basecalling is done in real time. The authors sequenced plasmids purified from ten clinical strains using this workflow. To remove host-cell strain differences as a variable, the authors also conjugated these clinical strains with a common recipient strain and sequenced the transconjugants. These experiments produced plasmid assemblies that match plasmid sizes inferred from gel mobility and that, in 2/3 of cases, also match short-read polished assemblies or are within 0.05% pairwise sequence identity. The enrichment of plasmid DNA sequences also maximizes the efficiency of plasmid sequencing, allowing parallel sequencing of up to 24 samples with optimal coverage. This protocol is adequate for plasmids ranging from 4 to 174 kb and tolerates up to 72% chromosomal contamination without affecting accuracy. This protocol is ideal for situations where the chromosomal sequence is already known or of no interest, such as for plasmid sequence verification, improving the accuracy of plasmid sequences already obtained by WGS, or sequencing plasmids captured by conjugation. The organism used to illustrate this work is Escherichia coli, which is representative of hosts used for recombinant gene expression and for plasmid capture through conjugation.
Introduction
Plasmids are self-replicating pieces of DNA found ubiquitously in bacteria. They are highly variable in size, ranging from <800 bp to 2.5 Mbp, and they typically follow a bimodal distribution, with a smaller peak corresponding to multicopy, non-conjugative plasmids and a larger peak corresponding to low-copy, often conjugative plasmids1,2. Plasmids play a key role in microbial ecology, carrying genes that help their hosts adapt to environmental challenges or access new ecological niches. Plasmids also serve as platforms for accelerated evolution, providing increased genetic plasticity and mediating horizontal gene transfer across strains, species, genera, and even families3,4. Network and comparative genomic analyses have confirmed the role of the environmental resistome as a persistent reservoir for clinically relevant antibiotic resistance genes (ARGs), thereby facilitating their maintenance and dissemination across ecological settings5. Tracking plasmids and their cargo of antibiotic resistance and virulence genes helps identify transmission routes6. Therefore, the identification and characterization of plasmids is of high interest for a variety of public health, clinical microbiology, and biotechnological applications.
The introduction of next-generation sequencing (NGS) technologies, which enable the high-throughput sequencing of unknown DNA templates, has opened the door to the genomic characterization of microbial isolates. Whole genome sequencing (WGS) enables tracking the emergence, spread, and transmission of new pathogens, drug-resistant strains, and vaccine-evading variants. It is also increasingly being used to help identify transmission routes during clinical outbreaks, potentially informing interventions for future outbreak prevention7. Finally, WGS allows the profiling of ARGs, which can inform therapeutic decisions8, although linking ARGs to qualitative and quantitative antibiotic resistance phenotypes is still a work in progress9.
However, the short-read (SR) sequencing data typically produced by WGS at scale is generally in the 400–500 bp range. This size is shorter than the size of most Mobile Genetic Elements (MGEs) and cannot therefore resolve them10. The in silico identification of plasmid sequences in WGS data is further complicated by incomplete coverage, and because of shared sequences between plasmids and between bacterial chromosomes and other plasmids10. As a consequence, assemblies are often extensively fragmented and incomplete, making their subgenomic location (chromosomal or plasmid) impossible to ascribe10.
Long-read (LR) sequencing technology generates highly contiguous assemblies spanning across more repeats, greatly facilitating the production of complete plasmid assemblies. There are essentially two types of long-read, single-molecule technologies available11,12. One of these approaches, nanopore sequencing, is becoming popular in microbial genomics due to its low cost, fast turnaround times, and suitability for resource-limited environments13,14.
Nanopore sequencing devices use flow cells containing arrays of thousands of nanopores. The DNA is loaded into the flow cell, opened up by a motor protein with helicase activity, and it goes through the nanopore driven by a current differential. As nucleotides in a given single strand pass through individual nanopores, the current is disrupted to produce a characteristic signal that is measured by an electronic sensor connected to each pore. This signal is decoded using basecalling algorithms, and the resulting data is assembled and analyzed further downstream using various bioinformatics tools.
Compared to SR-sequencing approaches, nanopore sequencing tends to produce lower read quality (lower Q-scores) and to generate insertions/deletions in homopolymer sequences during the data analysis of electrical signals (basecalling)15. It has also been noted that nearby methylation in native DNA can cause systematic base calling errors16. A commonly adopted solution has been to include short-read data for post-assembly error correction. However, this process (known as “polishing”) increases the cost and complexity overhead17. Increasing sequencing coverage can also improve accuracy, but it is not always technically achievable.
In 2024, it was shown that Oxford Nanopore Sequencing (ONT) R10.4.1 flow cells and V14 chemistry yield high-quality and contiguous assemblies for G- bacteria, while finer-scale analyses on single-nucleotide levels still benefit from SR-sequencing data18. However, the gap between LR- and SR-sequencing accuracy is gradually being closed. Various recent enhancements include a more precise data sampling process at an increased sequencing speed, the introduction of a novel basecaller tailored for native bacterial DNA and methylation, yielding increased base call accuracies19, and updated analysis tools such as new algorithms for phasing, variant calling, and star-allele calling. Note also that the latest Dorado algorithm V.0.9.0 ONT (2025) can be used for rebase calling of raw squiggle data. Indeed, some WGS studies are already reporting the generation of microbial genomes by nanopore sequencing of a quality for which short-read polishing is not expected to significantly improve the consensus sequence20,21.
Plasmids often contain the bulk of acquired resistance genes, particularly in Enterobacteriaceae isolates22. Therefore, resolving plasmid sequences allows the contextualization of AR genes, which is key for tracking AMR transmission23,24. Nanopore sequencing has already been used to examine the microevolution of blaKPC harboring plasmids25. MinION devices have also been used for real-time benchtop sequencing of plasmids and resistance gene detection in clinical isolates in hospital settings26. Having said that, plasmid interrogation is not yet part of routine infection control practice.
Despite LR-sequencing’s substantial improvement over SR-sequencing in the ability to rescue plasmids from genomic sequence27, some problems remain. Long read assemblers such as Flye28, Canu29 and Raven30 produce chromosomal assemblies of high quality but struggle to assemble plasmid sequences. This is in part due to insufficient depth of coverage because plasmid DNA is underrepresented in WGS sequencing data31. Note that due to their modular structure, abundance of secondary structures, and frequent presence of repeats, the high quality assembly for plasmid DNA sequence requires higher coverage than chromosomal DNA (50x read depth32).
Enriching the DNA samples with plasmid sequences is an effective approach to increase the depth of coverage, but isolation or enrichment of plasmid DNA before DNA sequencing is too expensive or laborious for clinical diagnostic applications and might introduce bias by enriching selected DNA sequences. In 2017, plasmid-enriched DNA was used to attempt the complete assembly of plasmid DNA in clinical samples for the detection of ARGs24. Eight isolates from six different Enterobacteriaceae species were sequenced to maximize population and plasmid structural diversity. After trying several assemblers, it was demonstrated that Canu/Canu+Pilon clearly outperformed others; this research group also tried a meta-assembly approach that achieved the resolution of additional plasmid structures, resulting in the complete assembly of 78% of all known plasmids in the sequenced samples. However, the presence of large-repeat structures and (to a lesser degree) problems with DNA extraction still posed significant problems for the detection of all single-contig plasmid assemblies24.
More recently, adaptive sampling as a complementary approach for the enrichment of low-abundance plasmid sequences has been examined by rejecting chromosomal sequences in bacterial isolate samples, although this method requires known reference sequences33.
Here, the authors describe protocols for ONT sequencing that are customized for samples enriched in plasmid DNA. Combining increased representation of plasmid DNA with up-to-date library preparation protocols, flow cell technology, and sequence assembly tools, the workflow produced assemblies that matched sizes inferred from gel mobility and, in 2/3 of the cases, either matched SR-sequencing polishing or were within 0.05% pairwise sequence identity. The enrichment of plasmid DNA sequences also maximizes the efficiency of plasmid sequencing, allowing parallel sequencing of up to 24 samples with optimal coverage. The protocols are not meant to replace standard nanopore WGS approaches, but to maximize the accuracy and efficiency of plasmid sequencing in situations where the chromosomal sequence is already known or not of interest.
The workflow includes plasmid DNA extraction, library preparation with barcoding, adapter ligation to a motor protein, checking the flow cell, loading the library onto a flow cell for sequencing, data analysis of the electrical signals (in real time or post hoc), sequence assembly using Autocycler34, and various downstream analyses (Figure 1).
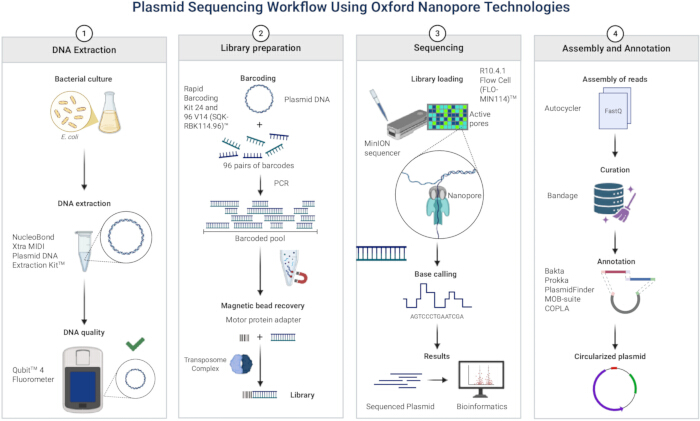
Figure 1: Plasmid sequencing workflow using Oxford Nanopore Technologies. Step 1: DNA extraction; Step 2: Library preparation; Step 3: Sequencing; Step 4: Assembly and annotation. Created in BioRender. Cortés, G. (2026) https://BioRender.com/u3b15st. Please click here to view a larger version of this figure.
Protocol
1. Plasmid DNA Extraction
NOTE: This protocol was used to extract plasmid DNA from a clinical Escherichia coli strain and its corresponding transconjugants using a commercial Plasmid DNA Extraction Kit35. Detailed protocols for conjugation can be found in36. The protocol is suitable for both high-copy and low-copy plasmids, ranging from ~3 kb up to ~200 kb. Large plasmids require special attention because they tend to have a low copy number (as few as 1–2 copies per cell), limiting DNA yield. To compensate, the protocol recommends increasing the cell mass and the volumes of lysis and neutralization buffers to ensure sufficient plasmid DNA for column binding. Plasmids up to 200 kb can still be recovered using this protocol; however, its applicability to mega plasmids (>200 kb) is limited.
- Plasmid extraction
- Day 1: Streak samples onto Luria–Bertani (LB) agar plates supplemented with the appropriate antibiotic for selecting the respective plasmid-borne resistance marker and incubate at 37 °C for 24 h.
NOTE: Add carbenicillin (or appropriate antibiotic) to LB at a final concentration of 100 µg/mL by adding 1 µL of a 100 mg/mL stock solution per mL of medium. - Day 2: Inoculate 3–5 mL of LB with the appropriate antibiotic medium with a single isolated colony from Day 1. Incubate with shaking at 37 °C for ~8 h, or until the culture reaches an OD₆₀₀ of 1–2.
NOTE: Measurement of OD600: Blank the spectrophotometer with fresh LB medium containing the appropriate antibiotic, then transfer 1 mL of culture to a clean cuvette and measure the OD at 600 nm. If the reading exceeds the linear range, dilute the sample and re-measure. - Inoculate 400 mL of LB supplemented with the appropriate antibiotic medium with 400 µL of Day 2 starter culture. Incubate with shaking at 37 °C for 8–12 h, or until the OD600 reaches 1–2 (as previously described).
NOTE: Increase culture volume beyond 400 mL if OD600 does not reach 1–2 within 12 h. To reduce the risk of plasmid loss or rearrangement, limit passage in culture as much as possible and maintain antibiotic selection throughout all growth steps. Increase culture volume only when a higher DNA yield is desired. - Day 3: Transfer the culture into centrifuge bottles appropriate for the culture volume. Centrifuge at 4200 x g for 10 min., then resuspend the pellet using the reagent volumes recommended by the manufacturer according to the following formula:

NOTE: Example: For 400 mL of a low copy bacterial culture (OD600 = 2) to be lysed, the appropriate volumes of lysis buffers RES, LYS, and NEU are 16 mL each.
![Volumetric calculation, equation: Vol.[mL]=400[mL]×(2/50)=16mL, dilution process, chemistry analysis.](/files/ftp_upload/70202/70202eq2.jpg "figure-protocol-2")
NOTE: if reagent volumes for resuspension, lysis, or neutralization are not properly scaled to the total culture biomass (OD600 × Volume, or ODV), lysis may be incomplete, neutralization inefficient, and precipitate formation excessive. This can lead to lower plasmid yield, reduced purity, and potential clogging of purification columns. Scaling buffer volumes proportionally, using the manufacturer’s formula (step 1.1.4.), ensures efficient lysis, complete neutralization, and consistent recovery of high-quality plasmid DNA. - Perform cell lysis, filter wetting using the appropriate buffer, and neutralization as instructed by the kit.
NOTE: Stack two filters if the precipitate volume is large, adjusting the buffer proportionally. Perform additional centrifugation steps if the supernatant remains opaque. Following neutralization, the high volume of precipitate may require additional centrifugation steps. This is the case for most clinical samples of E. coli, possibly because they tend to form biofilm in culture37, which involves the secretion of a thick matrix38. Excessive precipitate in the lysate can clog the column, prolong drain time, and potentially contaminate the sample with proteins. If the supernatant is clear, these extra steps may not be necessary. - Centrifuge the lysate at 4200 x g for 30 min. Transfer the supernatant to a new tube and centrifuge again for 30 min. If the supernatant remains opaque after these spins (Figure 2), perform an extra centrifugation at 4200 x g.
NOTE: Transferring the lysate to a 50 mL culture tube during centrifugation may facilitate supernatant removal, as precipitate can sometimes fail to pellet properly and become trapped near the tube top. Due to the large volumes processed, a single column may become saturated and unable to accommodate additional samples. To increase filtration speed or maximize DNA yield, the lysate can be split between two columns. - Perform EQU, WASH, and ELU steps according to kit instructions.
- Precipitate DNA using isopropanol.
NOTE: Incubate at -20 °C for ~10 min if pellet is not visible. However, it is generally best to carefully remove the supernatant, trusting that the pellet remains adhered to the tube walls, even if it is not visible. - Wash DNA with ethanol as instructed. Perform additional wash if protein precipitate persists.
- Dry DNA at room temperature (~20 °C) for 15–30 min.
- Resuspend DNA in 100 µL of nuclease-free water; this small volume helps maximize concentration for Nanopore library preparation.
NOTE: This is a convenient stopping point. Plasmid DNA can be stored for several months at –20 °C. The extraction kit used in this protocol is engineered to minimize contamination from chromosomal (genomic) DNA through optimized buffer chemistry, gentle lysis, and lysate clarification steps, although substantial chromosomal DNA contamination cannot be excluded, and the authors found it in the preps (see results).
- Day 1: Streak samples onto Luria–Bertani (LB) agar plates supplemented with the appropriate antibiotic for selecting the respective plasmid-borne resistance marker and incubate at 37 °C for 24 h.
- DNA yield and quality control
Quantify DNA and assess its quality using fluorescent dyes, which offer greater specificity and sensitivity for low DNA concentrations compared to UV absorbance methods. In this protocol, use a Fluorometer device to accurately and conveniently quantify DNA, RNA, or protein samples39.- Fluorometer workflow
- Bring DNA samples to room temperature. Prepare tubes for standards and samples.
NOTE: Calculate the appropriate volumes of dye and buffer to include in the working solution based on the number of samples. For each standard and sample, 200 µL of working solution should be prepared by diluting the dye in the buffer in a 1:200 ratio. The device has a built-in Reagent Calculator that can also be used for these calculations. - Prepare the assay tubes according to Table 1.
- Vortex each tube for a few seconds before incubating for 2 min at room temperature.
- Calibrate the Fluorometer using the standards. Insert sample tubes and record readings. For detailed instructions, refer to the Fluorometer manual39.
NOTE: For typical plasmid Midi preparations, DNA yields are expected to range from ~50 to 150 µg per 100–400 mL culture, depending on plasmid size, copy number, and growth conditions. Typical nanopore read lengths range from ~2 kb to 20 kb, with median reads often around 5–10 kb for standard plasmids. Ligation-based kits can produce longer reads (>20 kb median) for larger plasmids, but the rapid kit provides faster preparation at the cost of slightly shorter reads.
- Bring DNA samples to room temperature. Prepare tubes for standards and samples.
- Fluorometer workflow
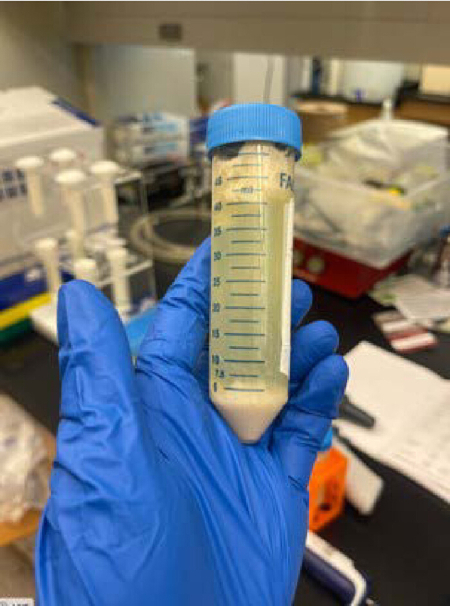
Figure 2: Cloudy lysate supernatant following one centrifugation step. Serial centrifugation is needed until the supernatant is clear to avoid clogging of the filtration column. Please click here to view a larger version of this figure.
| Standard assay tubes | User sample assay tubes | |
| Working solution (dye and buffer, 1:200) | 190 µL | 180–199 µL |
| Standard (from kit) | 10 µL | – |
| User sample | – | 1–20 µL |
| Total Volume in each assay tube | 200 µL | 200 µL |
Table 1: Reagent volumes and amounts for fluorometer. Amounts are shown for a single sample; a pool can be prepared based on the number of samples to be analyzed.
2. Method 2: Library preparation
NOTE: Considerations. Library preparation for sequencing the extracted plasmids was performed according to the instructions provided with the Barcoding Kit40. This protocol uses a kit that employs a transposase-based approach to simultaneously fragment and barcode DNA, providing a fast and streamlined workflow that reduces hands-on time and simplifies library preparation.
- DNA preparation
- Day 1: Program a thermal cycler: 30 °C for 2 min, then 80 °C for 2 min.
- Thaw kit components at room temperature, spin down, and mix per Table 2.
NOTE: If using a centrifuge, spin down at a slow speed not exceeding 330 x g. - Preparation of DNA in nuclease-free water: Transfer 200 ng DNA to 0.2 mL PCR tubes and add an appropriate volume of nuclease-free water to each sample in order to bring the final volume to 10 µL. Mix by pipetting gently 10–15 times. Briefly spin down in a microfuge or centrifuge at 330 x g to facilitate easier pipetting in the following steps.
- Prepare mixtures in PCR tubes as outlined in Table 3.
- Mix by pipetting, then spin down briefly.
- Incubate PCR tubes using the thermal cycle program from Step 1. Place tubes on ice to cool.
- Spin down briefly.
- Native barcode ligation
- Pool barcoded samples in a clean 1.5 mL Eppendorf tube. Ensure the total volume does not exceed 1000 µL.
- Resuspend the Beads by vortexing. Add an equal volume of Beads to the pooled barcoded samples and mix by flicking.
- Incubate tubes for 10 min at room temperature on a Hula mixer.
- Prepare 2 mL of 80% ethanol in nuclease-free water.
- Spin down the sample and pellet by holding the tube against a magnet. Keeping the tube on the magnet, pipette off the supernatant as waste.
NOTE: Any magnet of appropriate strength and size, including Neodymium magnets, can serve as an effective alternative to using an expensive magnet rack. Magnets with a holding force of approximately 5–12 lb and a diameter of 0.3–1 inch are typically suitable for standard 0.2–1.5 mL tubes, allowing clean removal of supernatant during bead-based cleanup steps. - Wash beads with 1 mL 80% ethanol while on the magnet. Remove ethanol. Repeat wash.
NOTE: Changing the position of the tube with respect to the magnet may improve the ease of removing ethanol. Utilize an additional low-speed spin to ensure complete bead pelleting if the pellet is accidentally disturbed. - Briefly spin down and place the tube back on the magnet. Pipette off any residual ethanol. Dry for 30 seconds, but do not dry the pellet to the point of cracking.
- Remove the magnet and resuspend beads in elution buffer. See Table 4 for the appropriate volumes of EB to be used depending on the number of barcodes in use.
- Incubate the tube for 10 min at room temperature.
- Return the tube to the magnet until the eluate is clear.
- Quantify the DNA concentration using 1 µL of the eluted sample on the Fluorometer to ensure library prep has been executed successfully and avoid wasting a Flow Cell on a failed library.
- Adapter ligation
- Transfer 11 µL of the DNA library into a new tube and label.
NOTE: Store extra DNA at -20 °C for future sequencing runs if needed. - Dilute the thawed Rapid Adapter in a new tube according to Table 5 and pipette up and down to mix.
- Add 1 µL diluted RA to the 11 µL DNA library.
- Flick the tube to mix, spin down briefly to ensure the complete volume accumulates at the bottom of the tube.
- Incubate for 5 min on the bench.
- Transfer 11 µL of the DNA library into a new tube and label.
| Reagent | Thaw at room temp | Spin down | Mix by pipetting |
| Rapid Barcodes | Not Frozen | ✓ | ✓ |
| Rapid Adapter | Not Frozen | ✓ | ✓ |
| AMPure XP beads | ✓ | ✓ | Mix by pipetting or vortexing immediately before use |
| Elution Buffer | ✓ | ✓ | ✓ |
| Adapter Buffer | ✓ | ✓ | Mix by vortexing |
Table 2: Reagent volumes and amounts for nanopore library preparation. Actions to be performed with each reagent are marked (✓).
| Reagent | Volume/sample |
| 10 µL Template DNA (200 ng from previous step) | 10 µL |
| 1.5 µL Rapid Barcodes, one for each sample | 1.5 µL |
| Total volume | 11.5 µL |
Table 3: Reagents and volumes for rapid barcoding. Volumes are shown per DNA sample; a pooled mix can be prepared, and the DNA added separately.
| 1-24 barcodes | 48 barcodes | 72 barcodes | 96 barcodes | |
| Volume of Elution Buffer | 15 µL | 30 µL | 45 µL | 60 µL |
Table 4: Elution buffer volumes used for every 24 barcodes. Volumes are indicated according to the number of barcodes.
| Reagent | Volume |
| Rapid Adapter (RA) | 1.5 µL |
| Adapter Buffer (ADB) | 3.5 µL |
| Total Volume | 5µL |
Table 5: Reagents and amounts for adapter. Volumes can be adjusted depending on the number of samples.
3. Flow cell run
NOTE: Choose a standard-output flow cell when sequencing a small number of plasmids with moderate coverage needs. Nanopore recommends performing a flow cell check to determine active pore count; nanopore devices' flow cells should have at least 800 active pores as defined by the warranty criteria. A single MinION flow cell provides sufficient output for sequencing of multiple DNA samples enriched in plasmid DNA (see more details on multiplexing in the discussion section) while offering lower cost and greater flexibility than a GRIDion or Promethean flow cell.
- Priming and loading the flow cell
NOTE: R10.4.1 flow cells (released in 2022) were used to develop this protocol. These flow cells have longer pores with a double reader head, resulting in improved homopolymer sequencing20,21. This sequencing protocol and the Barcoding Kit are not compatible with other flow cells. Opt for a high-output flow cell when performing large-scale multiplexing, aiming for high coverage, or working with larger plasmids or genomes. Consider the number of samples and target depth to balance cost, throughput, and sequencing quality.- Remove reagents from cold storage, including sequencing buffer (SB), library beads (LIB) or library solution (LIS), bovine serum albumin (BSA), flow cell tether (FCT), and flow cell flush (FCF). Thaw on ice at room temperature. Once reagents have thawed, vortex to mix, quick-spin, and store on ice.
- Prepare the flow cell priming by mixing a fresh DNA tube using the reagents listed in Table 6. Mix by inversion and pipetting.
- Lift the lid of the device and insert the flow cell. Apply gentle pressure to ensure proper placement.
- Expose the priming port by nudging the cover aside.
- Check for air bubbles within or adjacent to the priming port. Draw back 20–30 µL of fluid to remove bubbles.
NOTE: Do not remove more than 20–30 µL of buffer. Pores must remain submerged in the buffer at all times. Pores exposed to air may be rendered unusable. Ensure that the buffer is continuous throughout the visible channel. - Draw up 800 µL of priming mix and dispense into the priming port. Avoid introducing air bubbles. Let the device sit for 5 min.
- Resuspend the lib by pipetting up and down.
NOTE: Resuspend immediately before use, as the lib settles quickly. - Mix the DNA library with the appropriate volume of library beads in a new tube, as indicated in Table 7.
NOTE: The Rapid Barcoding kit the authors use employs a transposase-based approach to fragment DNA and attach barcodes without intentional size selection, so read lengths mainly reflect the original input DNA. Unlike ligation-based kits such as the Native Barcoding Kits, the Rapid Barcoding kit does not include separate short- or long-fragment buffers. While longer DNA can still generate long reads, the distribution is more variable and generally shorter than with ligation-based libraries that use Long Fragment Buffer to enrich long fragments. The absence of buffers simplifies the workflow and reduces hands-on time but offers less control over library size distribution, which can impact assembly quality. Ligation-based kits, by selectively enriching large fragments and removing short ones, typically yield higher median read lengths and improved assembly continuity, especially for de novo assemblies and complex genomes. - Adjust the sample port cover to reveal the port. Load 200 µL of priming mix into the flow cell priming port.
- Mix the prepared DNA library gently before loading.
- Dispense 75 µL of the DNA library with beads into the sample port, one drop at a time, allowing each drop to absorb before adding the next.
- Reapply the sample port cover and close the priming port.
- Add the light shield to the flow cell by lining the leading edge of the light shield up with the clip and then lowering the rest of it to cover the flow cell. Do not attempt to place the light shield under the clip. The light shield should sit around the cover, protecting the entire top section of the flow cell from exposure to light.
NOTE: Install the light shield on the flow cell as soon as the library has been loaded for optimal sequencing output. Leave it on during any subsequent steps until the library has been removed from the flow cell. The light shield is not securely fastened to the device; handle with care to avoid displacing it. - Secure the device lid closed and begin the sequencing run.
- Starting the sequencing run-computational requirements:
Minimum: 8-thread CPU, 16 GB of RAM, 1070 NVIDIA GPU, 500 GB SSD
Recommended: 16-thread CPU, 32 GB RAM, 2070 NVIDIA GPU, 1 TB SSD
NOTE: Make sure both the software and the computer are up to date and have at least 500 GB of free storage to accommodate new files. Software updates and other programs may interfere with the sequencing run. Ensure to run the software on either a Windows or an Ubuntu operating system.- Set the run time-limit: depending on how many plasmids are being multiplexed, set the run limit. The default is 48 h, a max time of 72 h can be run. For detailed instructions, refer to the manual.
NOTE: run time depends on multiplexing and plasmid size rather than plasmid number. The number of samples or plasmids that can be multiplexed depends on the desired sequencing depth and the flow cell’s output. For typical plasmid sequencing, multiplexing 20–24 samples per standard nanopore flow cell usually provides sufficient coverage for accurate assembly and variant detection, assuming plasmid sizes under ~200 kb. Larger plasmids or higher coverage requirements may require fewer samples per flow cell. Higher-output flow cells can support many more samples (up to 96 or more) per run, making them suitable for high-throughput plasmid sequencing or projects requiring very deep coverage. Users should balance the number of barcodes, plasmid size, and target depth to ensure each plasmid receives adequate reads for complete assembly. - Enable barcode trimming if performing demultiplexing during sequencing.
NOTE: Monitor reads per barcode and stop the run when sufficient coverage is achieved to preserve flow cell life. - Select super-accurate basecalling mode.
NOTE: Do not select adaptive sampling/barcode balancing. This option heavily reduces the read-output and degrades pores at a faster rate. If you don’t have a GPU, it is better to hold off on basecalling after the end of the run. - Select the appropriate rapid-barcode kit (24 or 96).
- Ensure the device is level and start the sequencing run on default settings (min Q score 10)
NOTE: This is a convenient stopping point. The device can be run overnight. - Post-hoc basecalling (in case the computer does not have enough capacity for live basecalling or to improve the accuracy of basecalling, reanalyzing the raw data with improved analytical tools): open the completed sequencing run in the software
NOTE: The next steps only apply if you did not select live basecalling. - Select Basecalling and choose the super-accuracy (SUP) model.
- Select the raw FAST5/POD5 data and set an output directory.
- Start basecalling.
- Set the run time-limit: depending on how many plasmids are being multiplexed, set the run limit. The default is 48 h, a max time of 72 h can be run. For detailed instructions, refer to the manual.
| Reagents | Volume per flow cell |
| Flow Cell Flush (FCF) | 1,170 μL |
| Bovine Serum Albumin (BSA) at 50 mg/mL | 5 μL |
| Flow Cell Tether (FCT) | 30 μL |
| Final total volume in tube | 1,205 μL |
Table 6: Reagents and volumes for priming and loading the flow cell. Volumes of reagents are indicated per flow cell.
| Reagents | Volume per flow cell |
| Sequencing buffer (SB) | 37.5 μL |
| Library beads (LIB) or library solution (LIS), if using | 25.5 μL |
| DNA library | 12 μL |
| Total | 75 μL |
Table 7: Reagents and volumes for loading the library. Volumes are shown for the DNA library; library beads (bid) should be mixed immediately before use.
4. Method 4: assembly using an autocycler
NOTE: There are many options for assembly of reads into contigs. Each assembler has its positives and its biases. This protocol recommends using Autocycler, which uses many different assemblies and combines them into one assembly. This is more labor-intensive, and you can use a single assembler to save time. Please have Conda installed in the terminal to download appropriate software. The supplementary commands document contains a link to an environmental file to set up the system.
- Assess run quality: Check the quality of the run from the Minknow software or from the run report .html file to note quality metrics (yield, Q-scores, length, distribution). Optionally, assess FASTQ files using NanoPlot to confirm read length distribution, N50, and quality score profiles for each barcode. Proceed only if sequencing yield and read length distributions are consistent with the expected plasmid sizes.
- Remove barcodes: Determine whether barcode trimming was enabled during the sequencing run. If barcodes were not removed, trim FASTQ files using Porechop (v0.2.4) and verify successful removal of barcode adapter sequences prior to downstream analysis.
- Trim reads: Trim long reads using Filtlong (v0.3.1), removing approximately 5–10% of the lowest-quality reads while retaining ~90% of total yield. Generate a filtered FASTQ file for assembly. If subsequent assemblies produce chimeric contigs, increase filtering stringency by enforcing a minimum read length threshold of ≥3,000 bp and regenerate filtered reads.
- Subsample and assemble readsubsets: Subsample reads using Autocycler according to recommended settings and assemble each read subset using Raven (v1.8.3), Flye (v2.9.6), Canu (v2.3.0), miniasm (v0.3.0), Myloasm (v0.2.0), NECAT (v0.0.1), Plassembler (v1.8.1), and any other assemblies of choice. Note contig lengths and circularization status for each assembly. Assemblers that report circularization (Raven, Flye, miniasm, Myloasm, and Plassembler) should be prioritized for plasmid reconstruction. For Canu and NECAT assemblies, identify candidate plasmid contigs based on expected plasmid size from circular contigs in previous assemblies.
- Inspect and curate assemblies: Visualize each assembly graph file (.gfa) using Bandage (v0.9.0) and evaluate contigs for circularity, size consistency across assemblers, and evidence of chimeric joins. Remove linear contigs lacking support across multiple assemblers and retain circular contigs with consistent size estimates. If many assemblies contain chimeric joins, return to step 4.3 and increase the minimum read length threshold (recommended ≥3,000 bp). In cases where major plasmids are circularized but smaller unsupported contigs remain, remove minor contigs prior to consensus generation. Proceed to Consensus generation and polishing steps may be executed in batch, following manual curation.
- Generate consensus and final assembly: After manual curation, proceed with Autocycler consensus generation using the curated assemblies. Execute the remaining Autocycler commands to produce the final consensus plasmid sequence. Detailed command-line instructions and parameter settings are provided in the Supplementary Material.
- Polishing: Once you have a complete assembly has been generated, polish the assembly using the trimmed long reads with Medaka (v2.1.1) to significantly improve consensus accuracy.
NOTE: While extra polishing rounds can help with consensus accuracy, they can also introduce errors. It is best practice to use a program like DNAapler to rotate the new contig before polishing; commands can be found in the supplementary commands section.
5. Method 5: Annotation
NOTE: There are many effective annotation tools for bacteria. The following programs are recommended for a thorough annotation.
- Bakta is great for proteomic analyses because it is currently actively maintained and serves as the spiritual successor to Prokka41,42.
- For replicon typing, plasmid mobility typing, and conjugation typing, MOB-suite is reliable6. MOB-suite can infer plasmid phylogeny using mash distancing and can identify insertion sequence (IS) elements43.
- COPLA is also a useful tool for plasmid taxonomy. Copla’s unique approach, which classifies plasmids into plasmid taxonomic units, is recommended in the field44.
NOTE: Plasmid phylogeny has historically posed significant challenges because plasmid modular structure and high frequency of recombination make sequence alignments difficult. COPLA addresses these challenges by computing average nucleotide identities (ANI).
Results
Clinical E. coli strains
To illustrate the use of ONT for the sequencing of plasmids from clinical strains, the authors sequenced 10 strains, which were a generous gift from Dr. Stephen Salipante at the University of Washington. These strains were part of a collection of 312 blood- or urine-derived isolates of Extraintestinal Pathogenic E. coli (ExPEC), obtained during the course of routine clinical care at the University of Washington Medical Center45.
Plasmid conjugation and characterization by gel mobility assay
Researchers also performed a conjugation assay using E. coli strain LMB100 as a recipient. Conjugation is a process that leads to the transfer of a plasmid present in a cell (the donor) to another cell (called the recipient)46. The transfer requires physical contact between the two cells and is typically detected using markers indicating the presence of the conjugative plasmid in the recipient cells. This allowed authors to eliminate differences in host strain as a variable and to illustrate the use of the protocol for the sequencing of plasmids obtained by plasmid capture (a method used to profile plasmids from a given ecological niche). All the conjugation assays produced transconjugants, confirming the presence of a conjugative plasmid in the donors. The protocol that the authors followed is described in36. The group identified the plasmids present in the donor and recipient strains and estimated their mobility by pulse-field gel electrophoresis (PFGE). A list of ten representative donor strains is shown in Table 8, and the estimated sizes of the plasmids present in them are listed in the third column. Plasmids outside the resolution range of the PFGE gel are excluded from this table, but the researchers were able to assemble several smaller plasmids around ~4kb (not shown).
| Donor Strain | Plasmid | Estimated PFGE Size | Assembly Length | Mean Depth | bp Zero Depth | Coverage % | Positions Changed | Pre-SR Accuracy % |
| blood_08 _0081 | pblood_08_ 0081_1 | 170000 | 171829 | 100 | 99.941803 | 54 | 0.0314 | 99.9686 |
| blood_08 _0081 | pBlood_08_ 0081_2 | 82000 | 85576 | 46.9 | 0 | 100 | 2 | 99.9977 |
| blood_d-08 _0094 | pBlood_d-08 _0094 | 179000 | 173334 | 382.6 | 3121 | 98.19943 | 2,347 | 98.646 |
| blood_08 _1447 | pBlood_08 _1447 | 97000 | 99624 | 36.2 | 0 | 100 | 0 | 100 |
| blood_10 _0913 | pBlood_10 _0913_1 | 70000 | 71788 | 49 | 4 | 99.994428 | 188 | 99.7381 |
| blood_10 _0913 | pBlood_10 _0913_2 | 112000 | 118727 | 41.2 | 126 | 99.893874 | 276 | 99.7675 |
| blood_1 1_184 | pBlood_11 _184_1 | 150000 | 146583 | 65.1 | 287 | 99.804206 | 134 | 99.9086 |
| blood_11_184 | pBlood_11 _184_2 | 75000 | 74263 | 82.1 | 0 | 100 | 32 | 99.9569 |
| blood_2011 _0238 | pBlood_ 2011_0238 | 170000 | 167286 | 110.9 | 0 | 100 | 0 | 100 |
| upec_108 | pUPEC_108 | 130500 | 131039 | 103.9 | 0 | 100 | 0 | 100 |
| upec_134 | pUPEC_134 | 160500 | 157829 | 169 | 0 | 100 | 0 | 100 |
| upec_271 | pUPEC_271 | 145500 | 144519 | 86 | 33311 | 76.950436 | 1,557 | 98.9226 |
| upec_90 | pUPEC_90 | 70000 | 74624 | 139.8 | 0 | 100 | 6 | 99.992 |
Table 8: Plasmid size estimates and sequencing accuracy metrics for a panel of 10 donor strains. Plasmid size estimates based on PFGE or assembled ONT donor plasmid sequences are listed. The pairwise comparisons of ONT–only and SR-sequence polished plasmid assemblies are also shown as an indicator of accuracy. Metrics include: assembly length, mean depth, zero-depth regions, percentage of coverage, positions changed, and percentage of pre-SR accuracy.
ONT-based plasmid sequencing output metrics
The sequencing run was set for 24 h. A total of 24 samples were multiplexed. The technical data for each sample, including quality score (Q), length, and coverage, are listed in Table 9. Nanopore sequencing produced sufficient read output and quality for all samples analyzed. Across all libraries, sequencing generated an average of 134,115 reads per sample, corresponding to a mean yield of 576.2 Mb. Reads had a mean length of 8,797 bp with a mean N50 of 3,693 bp, providing sufficient read continuity for plasmid assembly. The mean read quality score was Q16.0 with a median of Q16.6, and individual runs ranged from Q13.7 to Q18.0.
| Sequenced strain | Reads (kb) | Bases (Mb) | Mean Length | Max length | Min Length | N50 | Median Length | Mean Q | Median Q | |
| Blood_08_0081 donor | 109.8 | 261 | 5713 | 508418 | 78 | 2377 | 1351 | 14.5 | 15 | |
| Blood_08_0094 donor | 89.3 | 229 | 4177 | 114948 | 81 | 2565 | 1065 | 13.7 | 14 | |
| Blood_08_1447 donor | 87.5 | 246 | 5041 | 135147 | 75 | 2816 | 1609 | 15.1 | 15.7 | |
| Bblood_10_0913 donor | 247.7 | 1026 | 9260 | 174231 | 70 | 4143 | 1661 | 15.5 | 16.1 | |
| Blood_11_154 donor | 51.5 | 110 | 4172 | 91148 | 73 | 2127 | 1387 | 16.1 | 16.5 | |
| Blood_2011_0238 donor | 16.8 | 42 | 6707 | 104848 | 62 | 2534 | 845 | 15.3 | 15.2 | |
| UPEC_108 donor | 50.6 | 77 | 1915 | 90234 | 67 | 1525 | 1103 | 15.8 | 16.2 | |
| UPEC_134 donor | 50 | 143 | 7110 | 158393 | 72 | 2865 | 1133 | 16 | 16.2 | |
| UPEC_217 donor | 64 | 236 | 7512 | 144275 | 78 | 3678 | 1895 | 17.4 | 17.9 | |
| UPEC_90 donor | 52.9 | 157 | 5666 | 95944 | 72 | 2969 | 1593 | 16.8 | 17.2 | |
| Blood_08_0081 LMB100 transconjugant | 53.5 | 119 | 5162 | 225856 | 1 | 2232 | 1009 | 16 | 16.8 | |
| Blood_08_0094 LMB100 transconjugant | 160 | 442 | 7257 | 252176 | 1 | 2761 | 1083 | 17.3 | 18.2 | |
| Blood_08_1447 LMB100 transconjugant | 238 | 1029 | 10249 | 209221 | 1 | 4320 | 1857 | 17.7 | 18.7 | |
| Blood_10_0913 LMB100 transconjugant | 792.3 | 4341 | 11508 | 474325 | 1 | 5479 | 2731 | 17.7 | 18.8 | |
| Blood_11_184 LMB100 transconjugant | 42.5 | 281 | 17931 | 146626 | 87 | 6615 | 2448 | 16 | 16.7 | |
| Blood_2011_0238 LMB100 transconjugant | 147.7 | 585 | 9000 | 344203 | 1 | 3962 | 1781 | 18 | 18.9 | |
| UPEC_108 LMB100 transconjugant | 173.4 | 778 | 10127 | 168756 | 80 | 4485 | 2079 | 15.3 | 16.1 | |
| UPEC_134 LMB100 transconjugant | 105.4 | 667 | 17568 | 349230 | 71 | 6323 | 2232 | 15.5 | 16.3 | |
| UPEC_271 LMB100 transconjugant | 74.2 | 336 | 14521 | 342195 | 83 | 4520 | 1306 | 14.6 | 14.8 | |
| UPEC_90 LMB100 transconjugant | 75.2 | 418 | 15348 | 225661 | 83 | 5561 | 2016 | 15.7 | 16.4 | |
Table 9: NanoQ report of sequencing output metrics for a panel of 10 donor strains. The sequencing output metrics are listed. These include reads, bases, length (mean, median, max, and min), lengths, N50, and Q (mean and median) values from donors and transconjugants.
Plasmid assembly and accuracy
Plasmid sequences were assembled using Autocycler34. The sizes of the assembled plasmid sequences for 10 of the samples are listed in Table 8, fourth column, and they were in all cases congruent with estimates based on PFGE mobility (listed in the third column). The accuracy was assessed by comparing Medaka-polished long-read assemblies to Medaka (v2.2.0) plus polypolish (v0.6.1) assemblies. Sequence identity was calculated using dnadiff from MUMmer (v3.2.4) (Table 8). Across all plasmids analyzed (n = 12), assemblies had a mean length of 120.4 kb and were supported by an average sequencing depth of 109x, with a coverage averaging 97.9% across plasmid sequences. Prior to polishing, assemblies exhibited a mean sequence identity of 99.74% relative to the SR-sequence polished assembly.
Estimating chromosomal contamination
To estimate plasmid coverage and chromosomal contamination, reads were mapped to assembled plasmid sequences and to the E. coli LMB100 chromosomal sequence. Basecalled Nanopore reads were aligned using minimap2 (v2.2.6). Resulting alignments were processed using SAMtools (v1.1.7) to generate sorted BAM files and calculate mapping statistics. Plasmid coverage and mean depth were estimated using SAMtools coverage. Plasmid sequencing depth varied between samples but remained well above the minimum coverage required for accurate assembly (50–70 x). A fraction of reads mapped to the chromosome, indicating carryover of host DNA during plasmid extraction (Table 10).
| Plasmids | Total Reads | chromosomal reads | % Chromosomal Reads | Mean Chromosomal Coverage | Mean Plasmid Coverage | P:C Ratio |
| pBlood_08_0081_2 | 53491 | 20116 | 37.61% | 5 | 1068 | 236 |
| pBlood_d-08_0094 | 160024 | 74827 | 46.76% | 37 | 1618 | 44 |
| pBlood_08_1447 | 238031 | 127967 | 53.76% | 62 | 7842 | 127 |
| pBlood_10_0913_1 | 792263 | 221610 | 27.97% | 87 | 7801 | 90 |
| pBlood_10_0913_2 | 792263 | 221610 | 27.97% | 87 | 7772 | 89 |
| pBlood_11_184_1 | 42494 | 15919 | 37.46% | 7 | 1637 | 250 |
| pBlood_11_184_2 | 42494 | 15919 | 37.46% | 7 | 2188 | 335 |
| pBlood_2011_0238 | 147680 | 80526 | 54.53% | 56 | 2965 | 53 |
| pUPEC_108 | 173409 | 107884 | 62.21% | 61 | 4008 | 65 |
| pUPEC_134 | 105418 | 68645 | 65.12% | 29 | 3640 | 127 |
| pUPEC_271 | 74232 | 53554 | 72.14% | 34 | 1202 | 35 |
| pUPEC_90 | 75193 | 30052 | 39.97% | 16 | 4488 | 278 |
Table 10: Estimates of chromosomal DNA contamination. Chromosomal contamination in plasmids purified from recipient strains was quantified as the proportion of reads mapping to the LMB100 chromosomal sequence relative to plasmid reads. For each plasmid, plasmid reads, total reads, chromosomal reads, mean chromosomal coverage, mean plasmid coverage, and P:C Ratio are listed. Note that pBlood_08_0081_1 is absent because it could not be recovered in the recipient, and these estimations were performed on recipients because of their uniform chromosomal background.
Chromosomal contamination was quantified as the proportion of reads mapping to the assembled LMB100 chromosomal sequence relative to plasmid reads. Chromosomal contamination rates ranged between 72.1% and 28.0%, with an average of 46.9% (Table 10). The method is likely to overestimate chromosomal contamination because reads mapping to both the plasmid and the chromosome are counted as chromosomal-only, but it still indicates substantial chromosomal carryover. Despite this chromosomal carryover, the assembly workflow successfully reconstructed complete plasmid sequences, which were still consistent with the size predicted from PFGE mobility across all samples (Table 8, third and fourth columns).
Representative donor-recipient pairs of conjugative plasmids
Strain upec271 was isolated from a urinary sample between 2011 and 2013 and was assigned to phylogroup B2 and sequence type ST131. PFGE analysis revealed the presence of a band corresponding to a plasmid of approximately 145 kb [Figure 3A, (Donor)]. Short-read sequence analysis identified the presence of an IncF replicon.
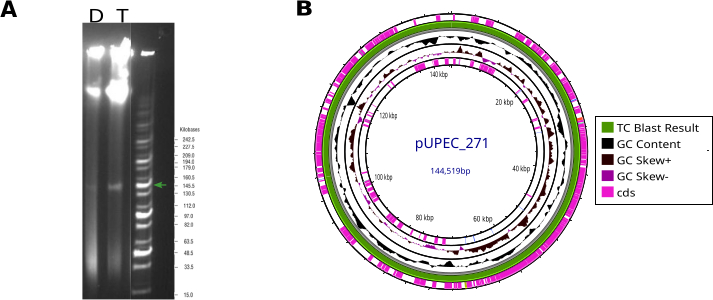
Figure 3: Characterization of pUPEC271. (A) PFGE of donor and transconjugant. The PFGE bands for the donor (D) and the transconjugant (T) are shown; the green arrows indicate the plasmid band corresponding to pUPEC271. The protocol used for PFGE is described in a study36. (B) Map of pUPEC271. The transconjugant was blasted against the donor, and the consensus (which is 100% identical) is shown as the green ring. This representation was generated using Proksee48. The outermost ring shows the location of CDS, two inner rings show the GC content and skew, and the innermost ring shows the location of tRNA genes. Please click here to view a larger version of this figure.
The transfer of this plasmid, which the authors called pUPEC271, was further confirmed by PFGE analysis using the protocol previously described in36 [Figure 3A, T(transconjugant)]. Plasmid DNA purified from the donor upec271 strain (pUPEC271_donor) was sequenced using nanopore. Consistent with the size of its band on the PFGE gel, the pUPEC271_donor sequence revealed a plasmid of 144,519 bp in size (Figure 3B). This plasmid had an IncF-type replicon and harbored resistance genes to six distinct classes of antibiotics (see Supplementary Table 1). The authors also purified DNA from one of the transconjugants (pUPEC271_TC) and obtained a sequence identical to that of the donor. The final assembly, compared against pUPEC271_donor, is plotted in Figure 3B. This confirmed that the conjugative plasmid present in the donor was transferred to the transconjugant strain. The technical data are shown in Table 9.
Strain Blood_10_0913 is an example of a strain with more than one plasmid. This sample was collected from blood between 2008 and 2013, and short-read sequencing indicated the presence of two replicons, an IncF and an IncY replicon. PFGE analysis of this strain identified two plasmids of approximately 70 and 110kb, respectively (Figure 4A). This was confirmed by nanopore sequencing, which produced two assemblies, 71,182 bp and 111,226 bp in size, respectively. The authors named these two plasmids pBlood_10_0913_1 and pBlood_10_0913_2 (Figure 4B). However, the assemblies initially failed to circularize because of the extensive sequence homology in the section of the plasmids bearing the conjugation machinery (the section of extensive homology is highlighted in Figure 4B). The failed assembly diagram, generated using Bandage47 is shown in Figure 4C. The complete assembly of the two plasmids was only possible after aggressive read culling of shorter-read (< 3000 bp) sequences.
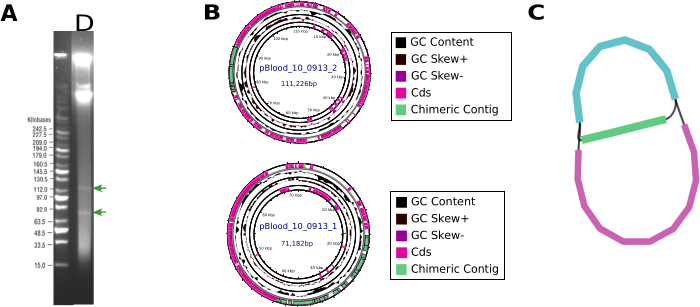
Figure 4: Identification and assembly of Blood_10_0913 strain’s plasmids. (A) PFGE. The green arrows indicate plasmid bands. The protocol used for PFGE is described in36 (B) Sequence assembly. Assembly of the two smaller plasmids present in the pBlood_10_0913 sample, pBlood_10_0913_2 and pBlood_10_0913_2. (C) Failed assembly. Representation of assembly failure due to the presence of a shared sequence between two distinct assemblies. This representation was generated using Bandage47. Please click here to view a larger version of this figure.
Supplementary Table 1: Resistance genes carried by pUPEC271. The plasmid size, replicons, and resistance genes associated with pUPEC271 are shown.Please click here to download this file.
Supplementary Commands. Please click here to download this file.
Discussion
The identification and characterization of plasmids is of high interest for public health, clinical microbiology, and microbial ecology, as they facilitate the maintenance and dissemination of adaptive genes across ecological settings1,5 and serve as platforms for accelerated evolution4. The introduction of NGS technologies allowed the high-throughput sequencing of genomes of microbial isolates and of populations, although the post-assembly identification of complete plasmids or of plasmid-derived contigs generally requires long-read sequences because short-read sequencing data is unable to resolve repeat regions larger than the size of the reads. ONT has become a very popular long-read sequencing approach, with applications that go beyond whole genome sequencing and metagenomics and that include plasmid sequence verification, detection and characterization of epigenetic modifications, RNA sequencing, and the evaluation of the intrinsic instability of tandem gene arrays (reviewed in12,49).
Here, the researchers present a workflow for ONT sequencing of plasmids designed for situations where the chromosomal sequence is already known or of no interest. The reason is that plasmid extraction is labor-intensive, costly, and time-consuming (since the host population needs to be grown in culture and processed), and sequencing the whole genome using nanopore technology is often sufficient to obtain complete plasmid assemblies while providing their genomic context. Examples where the protocol is helpful include the verification of a plasmid sequence in the context of plasmid genetic engineering50,51, improving the accuracy of plasmid sequences already obtained by WGS24, or the characterization of plasmids that have been captured from clinical or environmental samples by conjugation.
DNA extraction from clinical and environmental samples may need some customization. Here, the authors report that some of the clinical strains they used produced a biofilm matrix that clogged the filters, requiring multiple pelleting steps and sometimes necessitating the addition of two filters. Also, to sequence conjugative plasmids, a larger volume of culture is needed relative to sequencing multicopy plasmids, as naturally-occurring medium- and large-sized plasmids tend to have a low plasmid copy number2.
The protocol has allowed the sequencing of plasmids between 4 kb and 173 kb in size. This range falls squarely within the manufacturer’s specifications (between 2 and 200 kb). Recently, a study looked at 23,000 plasmid sequences deposited in NCBI and found significant size differences depending on the source, with plasmids of human origin having the smallest median size (76 kb), and soil and plant plasmids the largest (215 and 427 kb, respectively); plasmids from all other sources had a median size between 79 and 147 kb, so this protocol should cover most plasmids, which the possible exception of megaplasmids52 and plasmids of soil or plant origin3.
The authors include a plasmid DNA enrichment step to improve the accuracy of plasmid DNA assemblies. The presence of large amounts of chromosomal DNA floods cell pores on the sequencing flow cell with non-target reads, substantially reducing plasmid DNA depth. A plasmid DNA enrichment step was already implemented to attempt the complete assembly of plasmid DNA in clinical samples for the detection of ARGs24. This showed substantial improvements in the effectiveness of completing plasmid assembly with nanopore-only sequence (78% complete assemblies relative to benchmark). Other examples followed50,53,54.
To improve read accuracy, two of these studies used a technique developed by nanopore called “paired basecalling on pseudopaired reads”50,53. This approach involves aligning the raw electrical signals from sense and antisense strands of the same DNA molecule, resulting in an improvement in accuracy of about an order of magnitude. Paired basecalling on pseudopaired reads is compatible with multiplexing, so long as the strategy allows for the identification of the forward and reverse strands of the same molecule. Thus, it cannot be used in plasmids purified from samples of unknown plasmid complement or containing a mix of plasmids. Note that the number of plasmids in a genome typically ranges between 0 and 7 plasmids (particularly in clinical isolates)2,55.
The researchers noticed a high level of chromosomal contamination in the samples (Table 10). The level of contamination of 10 samples analyzed ranged between 28 and 72% based on read mapping. However, when the researchers normalized this sequence to the size of the chromosome relative to that of the plasmid or plasmids present, it was found that plasmid sequences were on average 144–fold more abundant than chromosomal ones. Translating this number to the level of plasmid DNA enrichment would require knowing the plasmid copy number of the plasmids in each sample.
MinION flow cells typically produce a sequencing output of ~30 GB, theoretically enabling the sequencing of well over 96 plasmids per run. In practice, multiplexing is also constrained by the 96-barcode limit, making 96 plasmids the practical upper bound per flow cell. However, chromosomal DNA contamination and natural barcode imbalance reduce the effective read depth per sample. To ensure sufficient read depth for each sample, a more conservative approach is to multiplex approximately 24 plasmids per flow cell. The recommended depth for the accurate assembly of the plasmid sequence is between 50 and 70x32,56. In the illustrative examples presented in this article, the authors ran 21 multiplexed samples in one flow cell and obtained a mean depth (109x), which aligns well with the recommended sample optimum per flow cell.
Note that, with excess read depth, pass/fail read partitions are less informative for assessing overall read quality. Instead, metrics derived from the length distribution provide a clearer representation of dataset quality. One such metric is the N50, defined as the read length at which reads of that length or longer account for 50% of the total bases. This value is highly sensitive to quality-control steps. For example, filtering low-quality or short reads with tools such as Filtlong removes a substantial fraction of the shorter tail of the distribution, thereby inflating the N50. This effect is evident in Table 9.
The authors used ONT’s Rapid Barcode kit, which uses a transposome to fragment plasmid DNA, and thus it does not require prior knowledge of the plasmid’s restriction pattern. An earlier study found that for small plasmids (<20 kb), enzymatic fragmentation is necessary because small plasmids remain circularized during most DNA extractions, and therefore contain no free ends for adapter ligation54. That study did not use barcodes, which generate additional free ends through PCR amplification, so in this case, this is likely a moot point. OnRamp, one of the advanced procedures for routine plasmid validation, avoids the use of barcodes by leveraging full-length plasmid reads for assembly, simplifying sample preparation54. In this case, the authors preferred barcodes for three reasons. The first one is to build an assembly regardless of the plasmid length. The second is to tolerate chromosomal DNA contamination. The third one is that this opens the possibility of multiplexing several samples, as stated above.
An earlier study noted that the aggregation of different assemblers improved the final outcome by cancelling out biases built into individual assembly platforms24. This meta-analysis is a feature that has been incorporated into the assembly program that the authors use, Autocycler34. Relative to its earlier version, named Trycycler57, Autocycler is a bit more automated; it uses several subsets of the reads, and (as mentioned before) it performs assemblies with multiple assemblers to create a more accurate consensus assembly. However, most assemblers, even the best, such as Flye28, Canu29, and Raven30, have difficulty with the presence of plasmids with extensive sequence homology, erroneously merging plasmid sequences, or generating multiple copies of a single plasmid, and are prone to missing small plasmids58,59 (see also Figure 4C). When this occurs, cutting out lower-quality reads and removing short reads can lead to solving chimeric contigs.
To establish the overall accuracy of the sequencing protocols, the authors compared the ONT-only assemblies with assemblies polished by combining long-read and short-reads, which (short of PacBio data) is the current gold standard. The authors also had gel data showing the number of plasmids present and their estimated sizes (Table 8, third column). The researchers successfully assembled all 13 plasmids found in the 10 samples and obtained sizes consistent with the assembled sequences. This is quite a success, as LR-sequence assemblers often fail to assemble plasmids with structurally complex sequences. At a more granular level, pairwise comparisons between the two sets of sequences indicated a variable level of accuracy (Table 8). Five of the plasmid assemblies had areas without coverage in the ONT assemblies, presumably the result of sequence artifactually added during the ONT-only sequence assembly. Of the other seven, three showed single-nucleotide polymorphisms, with pairwise differences ranging between 0.0023 and 0.05%, and four showed perfect concordance. The level of accuracy does not seem to correlate with the level of plasmid DNA enrichment or sequencing depth, but the presence of more than one plasmid in a given sample does, possibly because having more than one plasmid tends to amplify the level of sequence complexity (Table 8). In sum, the workflow is designed to optimize plasmid sequence yield and accuracy. While it is able to assemble plasmid sequences, it produces a variable level of accuracy at the nucleotide level. The protocol can be used to sequence plasmids of a wide range of sizes, tolerates at least 72% chromosomal DNA contamination, and can accommodate (depending on plasmid size and flow cell state) at least 24 plasmids in a single flow cell.
Disclosures
The authors have nothing to disclose.
Acknowledgements
We are very grateful to Steve Salipante (University of Washington) for generously sharing a set of clinical E. coli strains published in45. This work was partially supported by research support funds for a Directorship in Innovation and Entrepreneurial Development Appointment from UCSC to MC and by the University of California Alianza MX grant “Genomic profiling of Tuberculosis isolates Among High-Burden and Vulnerable Populations in Mexico: insights into transmission and drug resistance” to MC.
Materials
| Name | Company | Catalog Number | Comments |
|---|---|---|---|
| 1.5 mL Eppendorf DNA LoBind tube | Sigma Aldrich | EP022431081 | It can be replaced for another brand |
| 1.5 mL tube racks | Thermo Fisher Scientific | 22-313630 | It can be replaced for another brand |
| 15 mL conical tubes | FALCON | 352096 | It can be replaced for another brand |
| 15 mL tube racks | Thermo Fisher Scientific | 8850 | It can be replaced for another brand |
| 2.0 mL microcentrifuge tubes | Fisherbrand | 05-408-138 | It can be replaced for another brand |
| 250 mL sterile flasks | PYREX | 5320 | It can be replaced for another brand |
| Carbenicillin | GOLD BIOTECHNOLOGY | C-103-50 | It can be replaced for another brand |
| Centrifuge | Eppendorf | 5424R-PR-R | It can be replaced for another brand |
| Centrifuge | Eppendorf | 5810R-P-R | It can be replaced for another brand |
| Centrifuge bottles | Sigma Aldrich | B1283-4EA | It can be replaced for another brand |
| Disposable Inoculating Loops: 1 µL | Fisherbrand | 22-363-595 | It can be replaced for another brand |
| Electronic Digital Scale | Denver Instrument | APX-2001 | It can be replaced for another brand |
| Ethanol | Fisher Scientific | 04-355-720 | It can be replaced for another brand |
| Ethanol-resistant markers | Sharpie | 37001; 37002; 37003 | It can be replaced for another brand |
| Flow cell (R10.4.1) | Oxford Nanopore Technologies | FLO-MIN114 | |
| Flow Cell Wash Kit | Oxford Nanopore Technologies | EXP-WSH004 | |
| Gloves | X-GEN | 44-100M | Any nitrile gloves brand works |
| Ice bucket | Thermo Fisher Scientific | 432128 | It can be replaced for another brand |
| Isopropanol | Fisher Scientific | BP26184 | It can be replaced for another brand |
| MinION Sequencing Device | Oxford Nanopore Technologies | MIN-101B | |
| Native Barcoding Kit 96 V14 | Oxford Nanopore Technologies | SQK-NBD114.96 | |
| NucleoBond Xtra MIDI Plasmid DNA Extraction Kit | Takara | 740410.5 | |
| PCR tube racks | AXYGEN | R96PCRFSP | It can be replaced for another brand |
| PCR tubes: (0.2 mL) | AXYGEN | PCR-02-C | It can be replaced for another brand |
| Program autocycler v0.5.2 | Ryan Wick / University of Melbourne | ||
| Program bcftools v1.22 | Wellcome Sanger Institute (HTSlib / Samtools team) | ||
| Program bwa v0.7.19 | Heng Li, originally at the Broad Institute | ||
| Program canu v2.3 | University of California, Davis & Pacific Biosciences collaborators | ||
| Program flye v2.9.6 | University of California, San Diego (Pavel Pevzner lab) | ||
| Program medaka v2.1.1 | Oxford Nanopore Technologies | ||
| Program metamdbg v1.2 | INRIA | ||
| Program miniasm v0.3 | Heng Li | ||
| Program minimap2 v2.28 | Heng Li | ||
| Program minipolish v0.2.0 | Ryan Wick / University of Melbourne | ||
| Program porechop v0.2.4 | Ryan Wick / University of Melbourne | ||
| Program racon v1.5.0 | Genome Institute of Singapore | ||
| Program samtools v1.22.1 | Wellcome Sanger Institute (HTSlib / Samtools project) | ||
| Qubit™ 4 Fluorometer | Invitrogen | Q33226 | |
| Qubit™ Assay Tubes | Invitrogen | Q32856 | |
| Rapid Barcoding Kit 24 and 96 V14 | Oxford Nanopore Technologies | SQK-RBK114.96 | |
| Set of micropipettes that dispense between 1 – 10 μL (P10), 2 – 20 μL (P20), 20 – 200 μL (P200) and 200 – 1000 μL (P1000) | RAININ | 17008648; 17008650; 17008652; 17008653 | Micropipettes should be calibrated |
| Spectrophotometer | Thermo Scientific | 335905P | It can be replaced for another brand |
| Sterilized tips for 10 μL, 200 μL and 1000 μL | Eclipse | 1011-260-000-9; 1018-260-000; 1019-260-000-9 | |
| Thermal cycler C1000 Touch | Bio-Rad | 1851196 | It can be replaced for another brand |
| Water bath | Thermo Scientific | 51221052 | It can be replaced for another brand |
References
- Finks, S. S., Martiny, J. B. H. Plasmid-encoded traits vary across environments. mBio. 14 (1), e0319122(2023).
- Ramiro-Martinez, P., de Quinto, I., Lanza, V. F., Gama, J. A., Rodriguez-Beltran, J. Universal rules govern plasmid copy number. Nat Commun. 16 (1), 6022(2025).
- Redondo-Salvo, S., et al. Pathways for horizontal gene transfer in bacteria revealed by a global map of their plasmids. Nat Commun. 11 (1), 3602(2020).
- Rodriguez-Beltran, J., DelaFuente, J., Leon-Sampedro, R., MacLean, R. C., San Millan, A. Beyond horizontal gene transfer: the role of plasmids in bacterial evolution. Nat Rev Microbiol. 19 (6), 347-359 (2021).
- Castaneda-Barba, S., Top, E. M., Stalder, T. Plasmids, a molecular cornerstone of antimicrobial resistance in the one health era. Nat Rev Microbiol. 22 (1), 18-32 (2024).
- Robertson, J., Bessonov, K., Schonfeld, J., Nash, J. H. E. Universal whole-sequence-based plasmid typing and its utility to prediction of host range and epidemiological surveillance. Microb Genom. 6 (10), (2020).
- Conlan, S., et al. Single-molecule sequencing to track plasmid diversity of hospital-associated carbapenemase-producing Enterobacteriaceae. Sci Transl Med. 6 (254), 254ra126(2014).
- Zankari, E., et al. Identification of acquired antimicrobial resistance genes. J Antimicrob Chemother. 67 (11), 2640-2644 (2012).
- Eyre, D. W., et al. WGS to predict antibiotic MICs for Neisseria gonorrhoeae. J Antimicrob Chemother. 72 (7), 1937-1947 (2017).
- Arredondo-Alonso, S., Willems, R. J., van Schaik, W., Schurch, A. C. On the (im)possibility of reconstructing plasmids from whole-genome short-read sequencing data. Microb Genom. 3 (10), e000128(2017).
- Rhoads, A., Au, K. F. PacBio sequencing and its applications. Genomics Proteomics Bioinformatics. 13 (5), 278-289 (2015).
- Zhang, T., et al. Nanopore sequencing: flourishing in its teenage years. J Genet Genomics. 51 (12), 1361-1374 (2024).
- González, A., Fullaondo, A., Odriozola, A. Why are long-read sequencing methods revolutionizing microbiome analysis? Microorganisms. 13 (8), (2025).
- Wick, R. R., Holt, K. E. Polypolish: Short-read polishing of long-read bacterial genome assemblies. PLoS Comput Biol. 18 (1), e1009802(2022).
- Delahaye, C., Nicolas, J. Sequencing DNA with nanopores: Troubles and biases. PLoS One. 16 (10), e0257521(2021).
- Watson, M., Warr, A. Errors in long-read assemblies can critically affect protein prediction. Nat Biotechnol. 37 (2), 124-126 (2019).
- De Maio, N., et al. Comparison of long-read sequencing technologies in the hybrid assembly of complex bacterial genomes. Microb Genom. 5 (9), (2019).
- Lerminiaux, N., Fakharuddin, K., Mulvey, M. R., Mataseje, L. Do we still need Illumina sequencing data? Evaluating Oxford Nanopore Technologies R10.4.1 flow cells and the Rapid v14 library prep kit for Gram-negative bacteria whole genome assemblies. Can J Microbiol. 70 (5), 178-189 (2024).
- Dabernig-Heinz, J., et al. A multicenter study on accuracy and reproducibility of nanopore sequencing-based genotyping of bacterial pathogens. J Clin Microbiol. 62 (9), e0062824(2024).
- Sereika, M., et al. Oxford Nanopore R10.4 long-read sequencing enables the generation of near-finished bacterial genomes from pure cultures and metagenomes without short-read or reference polishing. Nat Methods. 19 (7), 823-826 (2022).
- Wick, R. R., Judd, L. M., Holt, K. E. Assembling the perfect bacterial genome using Oxford Nanopore and Illumina sequencing. PLoS Comput Biol. 19 (3), e1010905(2023).
- Paterson, D. L. Resistance in gram-negative bacteria: enterobacteriaceae. Am J Med. 119 (1), discussion S62-70 S20-S28 (2006).
- Peter, S., et al. Tracking of antibiotic resistance transfer and rapid plasmid evolution in a hospital setting by nanopore sequencing. mSphere. 5 (4), (2020).
- George, S., et al. Resolving plasmid structures in Enterobacteriaceae using the MinION nanopore sequencer: assessment of MinION and MinION/Illumina hybrid data assembly approaches. Microb Genom. 3 (8), e000118(2017).
- Dong, N., Yang, X., Zhang, R., Chan, E. W., Chen, S. Tracking microevolution events among ST11 carbapenemase-producing hypervirulent Klebsiella pneumoniae outbreak strains. Emerg Microbes Infect. 7 (1), 146(2018).
- Lemon, J. K., Khil, P. P., Frank, K. M., Dekker, J. P. Rapid nanopore sequencing of plasmids and resistance gene detection in clinical isolates. J Clin Microbiol. 55 (12), 3530-3543 (2017).
- Linde, J., et al. Comparison of Illumina and Oxford Nanopore Technology for genome analysis of Francisella tularensis, Bacillus anthracis, and Brucella suis. BMC Genomics. 24 (1), 258(2023).
- Bickhart, D. M., et al. Generating lineage-resolved, complete metagenome-assembled genomes from complex microbial communities. Nat Biotechnol. 40 (5), 711-719 (2022).
- Koren, S., et al. Canu: scalable and accurate long-read assembly via adaptive k-mer weighting and repeat separation. Genome Res. 27 (5), 722-736 (2017).
- Vaser, R., Sikic, M. Time-and memory-efficient genome assembly with Raven. Nat Comput Sci. 1 (5), 332-336 (2021).
- Lynch, M. D., Neufeld, J. D. Ecology and exploration of the rare biosphere. Nat Rev Microbiol. 13 (4), 217-229 (2015).
- Kruasuwan, W., et al. Comparative evaluation of commercial DNA isolation approaches for nanopore-only bacterial genome assembly and plasmid recovery. Sci Rep. 14 (1), 27672(2024).
- Ulrich, J. U., et al. Nanopore adaptive sampling effectively enriches bacterial plasmids. mSystems. 9 (3), e0094523(2024).
- Wick, R. R., Howden, B. P., Stinear, T. P. Autocycler: long-read consensus assembly for bacterial genomes. Bioinformatics. 41 (9), (2025).
- NucleoBond Xtra Plasmid DNA Purification User Manual. , Takara Bio USA. Available from: https://www.takarabio.com/documents/User%20Manual/NucleoBond%20Xtra%20Plasmid%20DNA%20Purification%20User%20Manual_Rev_15.pdf?srsltid=AfmBOorkdYVlr34yclNUgmBCn4imrn-gbvTafmkD2Yrnnch6fH-K_VwZ (2019).
- Mota-Bravo, L., et al. Detection of horizontal gene transfer mediated by natural conjugative plasmids in E. coli. J Vis Exp. (193), (2023).
- Hancock, V., Witso, I. L., Klemm, P. Biofilm formation as a function of adhesin, growth medium, substratum, and strain type. Int J Med Microbiol. 301 (7), 570-576 (2011).
- Hung, C., et al. Escherichia coli biofilms have an organized and complex extracellular matrix structure. mBio. 4 (5), e00645-e00713 (2013).
- Qubit 4 assays quick reference (Pub. No. MAN0017210 C.0). , Thermo Fisher Scientific. (2025).
- Rapid barcoding sequencing kit 96 v14. , Oxford Nanopore Technologies. Available from: https://store.nanoporetech.com/us/rapid-barcoding-sequencing-kit-96-v14.html (2026).
- Schwengers, O., et al. Bakta: rapid and standardized annotation of bacterial genomes via alignment-free sequence identification. Microb Genom. 7 (11), (2021).
- Seemann, T. Prokka: rapid prokaryotic genome annotation. Bioinformatics. 30 (14), 2068-2069 (2014).
- Singh, H., et al. Integrons: the hidden architects of bacterial adaptation, evolution, and the challenges of antimicrobial resistance. Antonie Van Leeuwenhoek. 118 (7), 90(2025).
- Redondo-Salvo, S., et al. COPLA, a taxonomic classifier of plasmids. BMC Bioinformatics. 22 (1), 390(2021).
- Salipante, S. J., et al. Large-scale genomic sequencing of extraintestinal pathogenic Escherichia coli strains. Genome Res. 25 (1), 119-128 (2015).
- Couturier, A., et al. Real-time visualisation of the intracellular dynamics of conjugative plasmid transfer. Nat Commun. 14 (1), 294(2023).
- Wick, R. R., Schultz, M. B., Zobel, J., Holt, K. E. Bandage: interactive visualization of de novo genome assemblies. Bioinformatics. 31 (20), 3350-3352 (2015).
- Grant, J. R., et al. Proksee: in-depth characterization and visualization of bacterial genomes. Nucleic Acids Res. 51 (W1), W484-W492 (2023).
- MacKenzie, M., Argyropoulos, C. An Introduction to nanopore sequencing: past, present, and future considerations. Micromachines (Basel). 14 (2), (2023).
- Emiliani, F. E., Hsu, I., McKenna, A. Multiplexed assembly and annotation of synthetic biology constructs using long-read nanopore sequencing. ACS Synth Biol. 11 (7), 2238-2246 (2022).
- Brown, S. D., Dreolini, L., Wilson, J. F., Balasundaram, M., Holt, R. A. Complete sequence verification of plasmid DNA using the Oxford Nanopore Technologies' MinION device. BMC Bioinformatics. 24 (1), 116(2023).
- Hall, J. P. J., Botelho, J., Cazares, A., Baltrus, D. A. What makes a megaplasmid? Philos Trans R Soc Lond B Biol Sci. 377 (1842), 20200472(2022).
- Brown Kav, A., Benhar, I., Mizrahi, I. A method for purifying high-quality and high-yield plasmid DNA for metagenomic and deep sequencing approaches. J Microbiol Methods. 95 (2), 272-279 (2013).
- Mumm, C., et al. Multiplexed long-read plasmid validation and analysis using OnRamp. Genome Res. 33 (5), 741-749 (2023).
- Balbuena-Alonso, M. G., et al. Genomic analysis of plasmid content in food isolates of E. coli strongly supports its role as a reservoir for the horizontal transfer of virulence and antibiotic resistance genes. Plasmid. 123-124, 102650(2022).
- Zhao, W., et al. Oxford nanopore long-read sequencing enables the generation of complete bacterial and plasmid genomes without short-read sequencing. Front Microbiol. 14, 1179966(2023).
- Wick, R. R., et al. Trycycler: consensus long-read assemblies for bacterial genomes. Genome Biol. 22 (1), 266(2021).
- Johnson, J., Soehnlen, M., Blankenship, H. M. Long read genome assemblers struggle with small plasmids. Microb Genom. 9 (5), (2023).
- Boostrom, I., Portal, E. A. R., Spiller, O. B., Walsh, T. R., Sands, K. Comparing long-read assemblers to explore the potential of a sustainable low-cost, low-infrastructure approach to sequence antimicrobial resistant bacteria with Oxford Nanopore sequencing. Front Microbiol. 13, 796465(2022).
Reprints and Permissions
