We demonstrate validated and standardized bedside techniques to quantify inspiratory effort and guide ventilator management.
A subscription to JoVE is required to view this content. Sign in or start your free trial.
Method Article
Measuring Inspiratory Effort In Mechanically Ventilated Children
* These authors contributed equally
In This Article
Summary
Abstract
An accurate assessment of inspiratory effort in mechanically ventilated children is essential for optimizing ventilator support and avoiding lung- and diaphragmatic injury. Over-assistance leads to diaphragmatic disuse and atrophy, whereas under-assistance may result in fatigue, diaphragm weakness and patient self-inflicted lung injury (P-SILI). This manuscript demonstrates validated bedside techniques to quantify inspiratory effort. We describe the reference standard for respiratory muscle effort quantification, esophageal manometry, and present alternative approaches for routine clinical practice, given its practical limitations. We distinguish between respiratory drive, tidal inspiratory effort, and maximal inspiratory effort. Indirect parameters of effort include diaphragm electrical activity (EAdi), airway occlusion maneuvers (P0.1, Pocc, PMI) and diaphragm ultrasound parameters. The maximal inspiratory pressure (MIP) is discussed as a measure of maximal effort. Representative pediatric data are provided where available. Although reference values are included for selected parameters, evidence defining safe thresholds in children remains limited. Combined monitoring using these techniques allows individualized titration of mechanical ventilation and supports lung- and diaphragm-protective strategies in the pediatric ICU.
Introduction
During mechanical ventilation (MV) both excessive and insufficient inspiratory efforts may occur, each potentially harmful for the respiratory muscles1,2,3. Insufficient effort can lead to diaphragm weakening. Diaphragmatic atrophy secondary to prolonged muscle relaxation was first described in a cohort of neonates back in 19884. Subsequent evidence, predominantly from adult studies, has demonstrated that even short-term MV can disrupt the fibrous architecture of the diaphragm and reduce its contractility, collectively described as ventilator-induced diaphragmatic dysfunction (VIDD)2,5,6. VIDD encompasses four trauma mechanisms: over-assistance myotrauma, under-assistance myotrauma, eccentric myotrauma and expiratory myotrauma7. While under-assistance myotrauma (disuse diaphragmatic atrophy) has been reported in children8,9, over-assistance myotrauma as well as eccentric and expiratory myotrauma remain poorly characterized in the pediatric population.
Excessive inspiratory effort has also been linked to a distinct type of lung injury named patient self-inflicted lung injury (P-SILI), caused by high transpulmonary driving pressures generated by excessive patient efforts and potentially amplified by ventilator support10. Furthermore, excessive effort increases the work of breathing (WOB) and may precipitate respiratory muscle fatigue. During the weaning phase, elevated WOB remains a major factor preventing successful liberation from mechanical ventilation11. These findings highlight the importance of preventing both over- and under-assistance and titrating MV support accordingly. Consequently, precise assessment of inspiratory effort is a fundamental, yet still underused, component of contemporary pediatric intensive care. Despite some recent advances, evidence defining safe thresholds in inspiratory drive and effort in children remains limited.
Currently, clinicians still often rely on clinical assessment of accessory respiratory muscle use, subcostal retractions, and patient comfort to titrate ventilatory support and evaluate readiness for extubation12. Although invaluable and irreplaceable, these observations are inherently subjective. Objective physiology-based measurements of inspiratory effort can complement bedside examinations to refine ventilator titration and may facilitate timely successful liberation from mechanical ventilation13.
When measuring inspiratory activity, it is important to understand the physiological background and difference between inspiratory drive, tidal breathing effort, and maximal effort (function). Inspiratory drive represents the neural commands originating from the brainstem respiratory centers that stimulate respiratory muscles, primarily the diaphragm. Although this neural output cannot be measured directly, it can be inferred from the diaphragm’s electrical activity (EAdi) or from the pressure-derived P0.114. Inspiratory effort represents the mechanical response of the inspiratory muscles to these neural commands. It reflects the pressure generated by the inspiratory muscles (Pmus), predominantly the diaphragm, to produce airflow. When diaphragmatic load increases, accessory muscles such as the intercostal, sternocleidomastoid, and scalene muscles are recruited to assist inspiration. The combined contraction of the respiratory muscles during spontaneous inspiration produces a decrease in pleural pressure (Ppl), which can be estimated by measuring esophageal pressure (Pes) with esophageal manometry, the current gold standard for quantifying respiratory effort. Measurement of Pes also enables calculation of advanced integrated effort indices, including the Pressure Time Product (PTP), Pressure Rate Product (PRP), and Work-of-Breathing (WOB), reflecting the total respiratory workload and energy expenditure.
Several non-invasive surrogates can complement or substitute for Pes measurements. These include occlusion pressure (Pocc)15, pressure muscle index (PMI)16 and diaphragm ultrasound assessment17. Respiratory muscle function refers to the maximal effort that can be generated by the muscles. The maximal inspiratory pressure (MIP) is a marker of function in ventilated children with spontaneous breathing activity, and the diaphragm thickness evolution over the time course of ventilation could be a marker for function as well18. Together, this protocol provides a spectrum of bedside measurement techniques to quantify inspiratory drive, effort, and respiratory muscle function. This will allow the clinician to measure the impact of mechanical ventilation on respiratory muscle activity and function, and optimally titrate respiratory support and sedation to allow for lung- and diaphragm protective ventilation.
Access restricted. Please log in or start a trial to view this content.
Protocol
1. Esophageal manometry
NOTE: Use an appropriate pediatric esophageal balloon catheter based on age and weight (see Table 1). Use a 1–10 mL syringe depending on the choice of esophageal balloon (see Table 2). Use rigid tubing and a ventilator or a dedicated monitor with a pressure transducer. Include integrated or external analysis software for optional pressure-time-product/pressure-rate-product (PTP/PRP) computation.
- Prepare materials – Choose the balloon size based on age and weight (see Table 2). Prepare the pressure transducer of the selected ventilator or monitor and zero it to atmospheric pressure. Check the esophageal balloon for leaks.
- Estimate insertion depth – Measure the Nose–Ear–Xiphoid (NEX) distance to determine the desired placement depth. Aim for the lower third of the esophagus.
- Insert the catheter – Lubricate the catheter with a water-soluble lubricant. Advance the catheter slightly beyond the measured NEX distance. Connect the catheter to the pressure transducer and inflate the balloon minimally (see Table 2) to monitor pressure deflections.
- Verify catheter positioning – Apply gentle pressure to the abdomen. A positive esophageal pressure (Pes) deflection indicates distal esophageal placement. Then slowly withdraw the catheter until cardiac oscillations appear on the Pes tracing (Figure 1). This ensures that the catheter is positioned in the lower third of the esophagus.
- Initial balloon inflation – Aspirate all air from the balloon. Zero the system to atmospheric pressure. Inflate the balloon to the manufacturer-recommended initial volume.
- Optimize balloon volume –Deflate the balloon to 0.1 mL and inflate stepwise to find the optimal filling volume defined as the smallest volume at which the maximal ΔPes occurs (Vbest). Alternatively, start with a deflated balloon, let it equilibrate to ambient pressure, and then inflate with 0.1 mL increments. After each increment, deflate the balloon and subsequently allow it to re-equilibrate with atmospheric pressure for 10 s19, before proceeding to the next step.
NOTE: This is a critical step, and we highly recommend reading detailed instructions by Hotz et al.19, Mojoli et al.20, and Rudolph et al.21. A detailed summary of recommended fill volumes and volume increments can be found in Table 2. - Perform an occlusion test – Push the end-expiratory hold button on the ventilator. In a passive patient, apply a slow, deep bilateral thoracic compression during the occlusion and measure the increases in both airway pressure (Paw) and Pes. In patients with spontaneous breathing activity, measure the decrease in both Paw and Pes during the next inspiratory effort in the expiratory hold (Baydur maneuver). (Figure 1C).
- Verify calibration – Measure the ΔPes / ΔPaw ratio and accept the balloon calibration and position if this value lies between 0.8 and 1.2 (usual range in adults) or 0.7 and 1.3, the acceptable range in children21.
- Start monitoring Pes – open the ventilator screen that displays continuous recordings of Pes and transpulmonary driving pressures. The primary variable, ΔPes, is defined as the difference between end-expiratory and end-inspiratory esophageal pressure.
NOTE: If ΔPes/ΔPaw is not in range, the catheter volume and depth might not be correct22. Reassess the balloon filling volume and adjust in 0.2–0.5mL increments or modify catheter depth by ±1–2 cm as needed. Repeat the occlusion test after each adjustment until the ratio stabilizes within the target range.
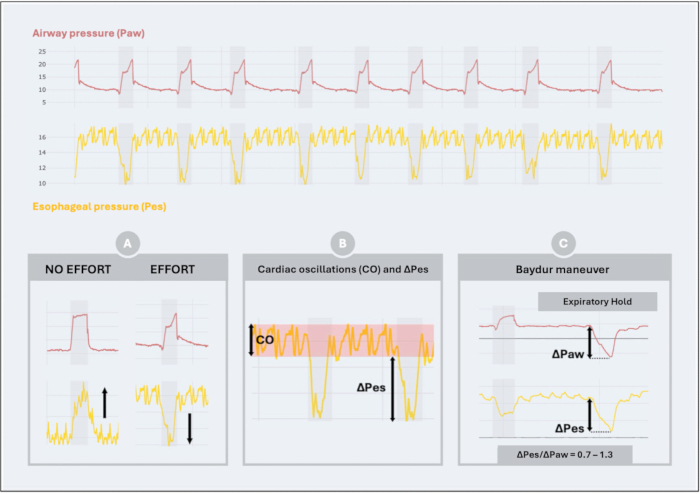
Figure 1: Esophageal pressure (Pes) waveform interpretation and validation during measurements. The figure illustrates characteristic airway pressure (Paw, red) and esophageal pressure (Pes, yellow) waveforms obtained during Pes catheter placement and calibration (A): Comparison of Pes and Paw during breaths with no inspiratory effort and with active effort. A downward Pes deflection during inspiration indicates patient-generated inspiratory effort. (B): Identification of cardiac oscillations (CO) superimposed on the Pes tracing and measurement of ΔPes. Recognizing and distinguishing CO from true respiratory swings is essential for accurate signal interpretation. (C) The Baydur maneuver is used to validate correct catheter positioning and balloon filling. During an expiratory hold, simultaneous pressure changes in Paw (ΔPaw) and Pes (ΔPes) are compared. A ratio of ΔPes/ΔPaw between 0.7 and 1.3 (or 0.8–1.2, see manuscript) confirms adequate calibration and correct balloon placement in children. Please click here to view a larger version of this figure.
2. Clinical Assessment of Respiratory Effort
- Prepare the patient - Ensure good visibility of the thorax and abdomen. Correct reversible factors such as airway obstruction, fever, or agitation.
- Observe the breathing pattern - Assess rhythm, depth, paradoxical movements, and synchrony with the ventilator during several consecutive breaths.
- Inspect accessory muscle use – During inspiration, look for intercostal, subcostal, or suprasternal retractions (inward movements of the skin), stridor (audible high-pitched noise), nasal flaring (outward movement of the nostrils), and neck muscle activation.
- Grade effort – Classify retractions as mild, moderate, or severe subjectively and stridors as mild (when agitated) or severe (at rest).
- Reassess and document – Repeat this assessment regularly
NOTE: Optionally use the validated Effort of Breathing Score, which incorporates retractions, stridor, and pulsus paradoxus23.
3. Electrical Activity of the Diaphragm (EAdi)
- Preparations – Estimate initial catheter insertion depth using the modified NEX (nose-ear-xiphoid) formula, applying the specific equations and reference table for oral or nasal placement provided with each catheter size.
NOTE: you will need an EAdi catheter and a compatible ventilator with EAdi monitoring capability. - Insert and position the catheter – Place the nasogastric or orogastric EAdi catheter into the esophagus. Observe the EAdi amplitude in the ventilator. Advance or withdraw the catheter until a maximal EAdi amplitude is acquired.
- Verify proper positioning – Open the ventilator’s catheter positioning tool. Move the catheter up or down until the highest amplitudes of the diaphragm electromyography (EMG) signals (purple color on the tracings) are displayed on the two middle tracings.
- Record the signal – Allow several minutes of stable spontaneous breathing. Continuously record the EAdi waveform during the episode of mechanical ventilation.
- Analyze parameters – Evaluate the EAdi amplitude. Open the trend screen and display the averages over a selected period, typically 30 min to 4 h. Draw a virtual line through the peak EAdi amplitudes over the selected timeframe and use that as the average peak EAdi value for that period.
NOTE: The ventilator does not calculate averages, so no formal average peak EAdi values are available. Analysis can be done offline for research purposes. - Estimate NeuroMuscular Efficiency (NME) – Perform an end-expiratory occlusion maneuver. Calculate the NME by dividing the airway pressure drop (ΔPaw) by the change in electrical activity (ΔEAdi) during the same effort (NME = ΔPaw/ΔEAdi). Perform a screen recording and measure the ΔEAdi as the difference between peak and baseline. Measure the ΔPaw as the difference in peak airway pressure and positive end-expiratory pressure (PEEP). The ratio must be calculated by the clinician and is not calculated automatically.
- Measure the difference in milliseconds between the time between the start of the EAdi rise and peak amplitude (dt) and calculate the difference in microvolts of the EAdi between these two time points. Calculate the rate of rise of EAdi as EAdi/dt. This value indicates how rapidly neural activation increases at the onset of inspiration.
4. P0.1
- Confirm spontaneous breathing – Verify that the patient is triggering breaths (indicated by the ventilator as a different color on the flow or pressure curve) or that inspiratory efforts are visible on the pressure or flow waveform by a negative deflection prior to circuit pressurization.
- If uncertain, perform an expiratory occlusion maneuver by pushing the expiratory hold button on the ventilator and check for any negative deflections on the airway pressure waveform. True negative deflections are U-shaped.
- Perform an expiratory occlusion – Activate the expiratory hold by pushing the expiratory hold button on the ventilator for at least 250 ms to block airflow. Ensure that a spontaneous inspiratory effort is captured during the occlusion.
- Measure P0.1 – Identify the initial airway pressure deflection. Determine the difference between PEEP and the negative pressure measured 100 ms after inspiratory onset. Repeat for three breaths and average the results.
NOTE: Most ventilators will display this variable automatically or when prompted. We refer to the discussion about the interpretation of the values.
5. Occlusion Pressure (Pocc)
- Confirm spontaneous breathing – Verify that the patient is triggering breaths and that inspiratory efforts are visible on the pressure or flow waveform. If uncertain, perform an expiratory occlusion maneuver and check for any negative deflections on the pressure waveform
- Start recording ventilator waveforms
- Perform an expiratory occlusion – Initiate the expiratory hold by pushing the expiratory hold button on the ventilator to block airflow. Visually confirm that a spontaneous inspiratory effort is captured during the occlusion by looking for a negative deflection on the airway pressure curve. Avoid coaching the patient verbally or tactilely since the goal is to capture a respiratory effort representative of the patient’s baseline effort.
- Analyze the recording – Identify the lowest airway pressure reached during the first respiratory effort after the initiation of the occlusion maneuver (Pmin). Calculate Pocc = PEEP – Pmin.
- Repeat the measurement – Repeat three times to ensure reproducibility and average the results to account for physiological variation.
- Estimate ΔPes – Use the validated conversion ΔPes = (2/3) x Pocc24
NOTE: Perform occlusion maneuvers only in hemodynamically stable patients. Avoid in case of severe hypoxemia, air-trapping, high intracranial pressure, or when patient–ventilator asynchrony is pronounced. Keep the occlusion short and abort immediately if desaturation, bradycardia, or distress occurs. Continuous cardiorespiratory monitoring is mandatory.
6. Pressure Muscle Index (PMI)
- Confirm spontaneous breathing – Verify that the patient is triggering breaths and that inspiratory efforts are visible on the pressure or flow waveform. If uncertain, perform an expiratory occlusion maneuver and check for any negative deflections on the pressure waveform.
- Start recording ventilator waveforms
- Perform the inspiratory hold – Initiate a brief inspiratory airway occlusion (≤ 2–3s) during a patient-triggered breath. Observe for a rise in airway pressure above PIP followed by a steady plateau (Pplat). Avoid maintaining the hold for longer than 3s to prevent activation of expiratory or abdominal muscles.
- Assess maneuver validity – A valid PMI tracing shows a rapid transition from PIP to Pplat, followed by a steady plateau phase lasting at least 1–2 s. If the plateau remains below PIP, the maneuver suggests inspiratory effort is low or not consistently present throughout inspiration, and PMI = 0. If the maneuver does not achieve a visible plateau, it is considered invalid. Cardiac oscillations are often observed throughout the hold maneuver.
- Calculate PMI and repeat – Calculate PMI using the formula: PMI = Pplat – PIP. Repeat the maneuver at least three times and report the mean of technically acceptable trials (Figure 2).
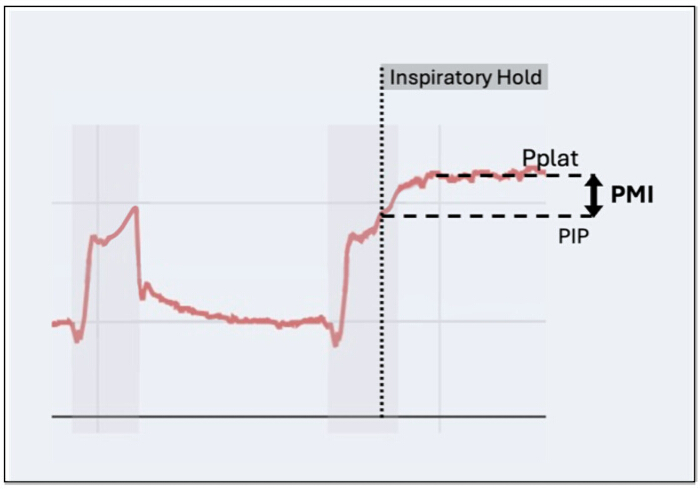
Figure 2: Measurement of the Pressure Muscle Index (PMI). The figure illustrates the PMI measurement, which quantifies inspiratory muscle effort during assisted or spontaneous ventilation. When the inspiratory hold is initiated, the airway pressure (Paw) waveform rises above the peak inspiratory pressure (PIP) and eventually reaches a new plateau (Pplat). When spontaneous inspiratory effort is present, this rise is caused by the relaxation of the respiratory muscles. Please click here to view a larger version of this figure.
7. Maximal Inspiratory Pressure (MIP)
- Confirm spontaneous breathing – Verify that the patient is triggering breaths and that inspiratory efforts are visible on the pressure or flow waveform. If uncertain, perform an expiratory occlusion maneuver and check for any negative deflections on the pressure waveform.
- Start recording ventilator waveforms
- Prepare the patient and ventilator or monitor – Confirm that the patient is hemodynamically stable and adequately oxygenated by monitoring the vital signs. If a standalone monitor is used, make sure the pressure transducer is zeroed at ambient pressure. Start recording the airway pressure.
- Cooperative patients – Initiate an airway occlusion maneuver by pushing the expiratory hold button on the ventilator. Instruct the patient to perform a maximal, forceful inspiration during this maneuver. Maintain the occlusion until the effort plateaus. Provide verbal encouragement to ensure a maximal effort is produced.
- Non-cooperative or sedated patients – Initiate a prolonged expiratory hold (up to 8 spontaneous efforts or a maximum of 12 s25. Observe for negative deflections in the airway pressure waveform corresponding to spontaneous inspiratory efforts (see above).
- Measure and repeat – Record the largest negative pressure achieved during the maneuver. In contrast to Pocc, this value does not necessarily correspond to the first inspiratory effort after occlusion initiation, as subsequent efforts within the same hold may reach greater amplitudes. Repeat at least three times, allowing brief recovery between maneuvers, and report the highest reproducible value as the patient’s MIP (Figure 3).
NOTE: MIP is also referred to as PiMax or Negative Inspiratory Force (NIF)
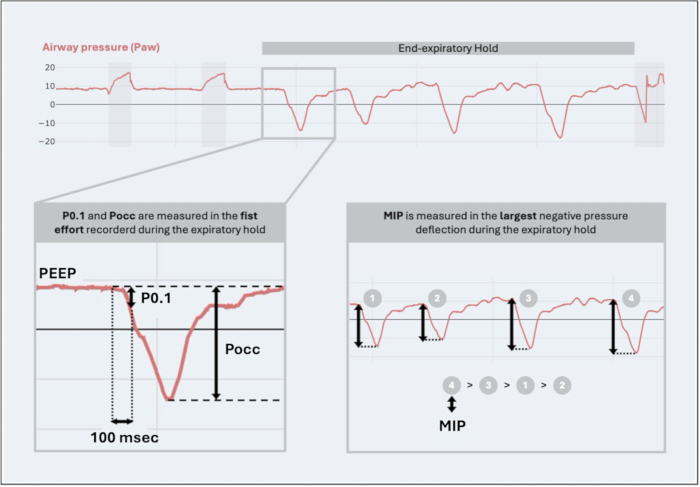
Figure 3: Measurement of P0.1, Pocc, and MIP during an end-expiratory hold. The airway pressure (Paw) waveform is shown during an end-expiratory hold. (Left) P0.1 and Pocc are measured during the first inspiratory effort of the hold. P0.1 represents the airway pressure drop 100 ms after the onset of inspiratory effort, and Pocc is the maximal negative pressure reached during that same effort. (Right) MIP (maximum inspiratory pressure) is identified as the largest negative pressure deflection among all inspiratory efforts recorded during the expiratory hold. Note the slight increase in expiratory pressure that occurs after the second occluded breath, as this could be the result of activation of expiratory muscles. If expiratory muscle activity is clinically suspected or confirmed to be present, each MIP calculation should keep the PEEP value as baseline expiratory pressure to which the change in pressure is calculated. Please click here to view a larger version of this figure.
8. Diaphragm Ultrasound26
NOTE: Special equipment is needed: An ultrasound system with M-mode capability, a high-resolution linear probe (6–13 MHz) for diaphragm thickness measurements, and a low-frequency curvilinear or phased-array probe (2–5 MHz) for excursion assessment.
- Identify the diaphragm - Position the patient supine or semi-recumbent. Apply gel and place the linear probe at the right zone of apposition (9th–10th intercostal space, midaxillary line) with the orientation marker pointing cranially. Rotate the probe parallel to the ribs (with the orientation marker towards the back of the patient) and slide caudally until the liver is visualized. Move one intercostal space cranially to locate the diaphragm between the pleural and peritoneal lines.
- Optimize image – Adjust depth, focus, and gain to maximize visualization of the pleura and peritoneum. Place the probe perpendicular to the chest wall to minimize angle error. Mark the probe position on the skin to maintain consistency during serial measurements.
- Measure diaphragm thickness (DT) – Freeze a 2D image at end-expiration. Measure the end-expiratory diaphragm thickness (DTee) perpendicular to the pleural and peritoneal lines, excluding the lines themselves, so that the measured distance is similar to what is shown in Figure 4. Record the value in millimeters.
- Measure diaphragm thickening fraction (DTF) – Applicable only in spontaneously breathing patients. Activate M-mode at a slow sweep speed and align the M-mode line over the diaphragm. Record several breaths, freeze the image, and measure end-expiratory (DTee) and end-inspiratory (DTei) thicknesses so that the measured distances are similar to what is shown in Figure 5. Calculate DTF (%) = [(DTei – DTee) / DTee] x 100.
- Measure diaphragm excursion (DE) – Switch to a curvilinear or phased-array probe. Place the probe subcostal in the midclavicular line with the orientation marker pointing cranially and visualize the diaphragm using B-mode. Enable M-mode and place the M-mode line along the path of diaphragm motion. Measure the vertical excursion from baseline at end-expiration to the peak at end-inspiration in millimeters.
NOTE: excursion is only valuable as a parameter when the patient is (temporarily) unsupported and breathing spontaneously, as passive insufflation of the lungs will likely result in caudal movement of the diaphragm as well.
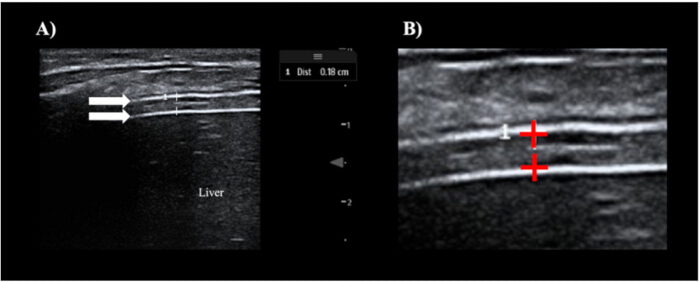
Figure 4: Ultrasound measurement of diaphragm thickness (DT) at end-expiration. (A) B-mode ultrasound image of the right hemidiaphragm at end-expiration. The diaphragm is visualized as a layered structure between the pleural and peritoneal membranes (upper and lower white arrows, respectively). The distance between the two echogenic lines represents the diaphragm thickness (DT). (B) Magnified view of the same region i.e. the right hemidiaphragm at end-expiration, highlighting the correct positioning of the measurement calipers (red). The calipers should be placed within the bright echogenic boundaries of the pleural and peritoneal layers to ensure accurate measurements. DT = diaphragm thickness; Please click here to view a larger version of this figure.
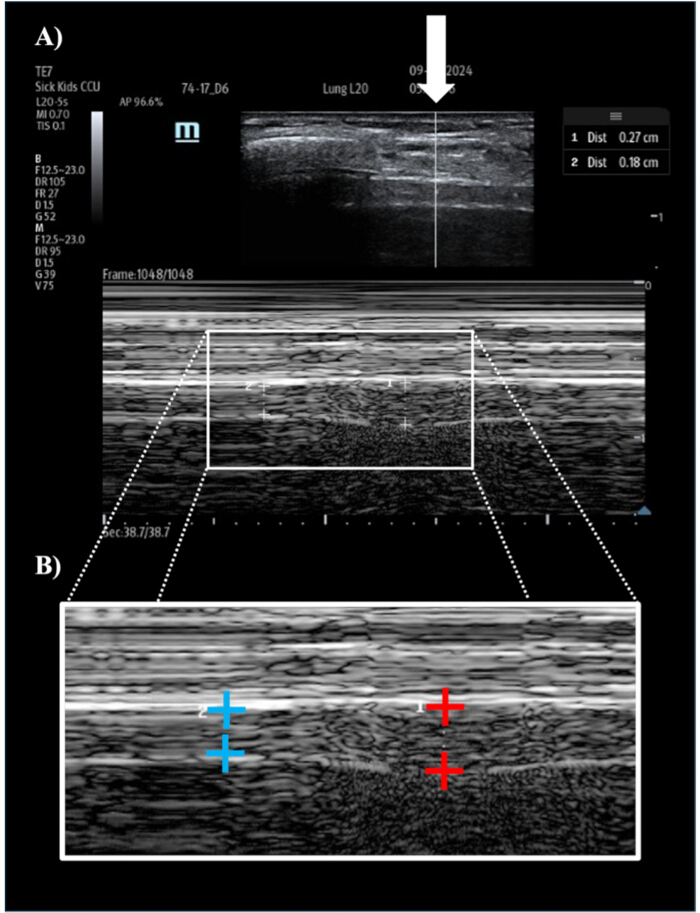
Figure 5: M-mode ultrasound assessment of diaphragm thickening fraction (DTF). (A) B-mode image showing the right hemidiaphragm. The vertical line (indicated by the white arrow) represents the M-mode cursor positioned perpendicularly over the diaphragm. The section underneath displays the corresponding M-mode tracing, where the diaphragm’s movement and variation in thickness throughout the respiratory cycle are visualized in real time. (B) Magnified view of the M-mode tracing highlighting diaphragm thickness at end-expiration (blue calipers) and at end-inspiration (red calipers). DTF = diaphragm thickening fraction. Please click here to view a larger version of this figure.
Access restricted. Please log in or start a trial to view this content.
Results
Pes
In children, typical ΔPes values during assisted ventilation range between 4–18 cmH₂O. ΔPes < 4–5 cmH₂O suggests low inspiratory effort or potential over-assistance, whilst ΔPes > 14–18 cmH₂O suggests excessive effort or patient–ventilator asynchrony27,28.
Accurate placement is confirmed by the presence of cardiac oscillations on the esophageal pressure (Pes) tracing and stable, br...
Access restricted. Please log in or start a trial to view this content.
Discussion
Recent evidence has demonstrated the potential to mitigate diaphragm dysfunction in mechanically ventilated children through titration of inspiratory effort. As a result, the clinician needs easy-to-use and accurate tools to quantify effort and make informed decisions. Even though a structured clinical bedside approach to visually evaluate inspiratory effort in ventilated children is possible, it does not provide quantitative parameters and should only be used to complement the objective physiological measure...
Access restricted. Please log in or start a trial to view this content.
Disclosures
All authors report no conflict of interest
Acknowledgements
Funding: Dr. Tom Schepens is supported by Research Foundation Flanders
Access restricted. Please log in or start a trial to view this content.
Materials
| Name | Company | Catalog Number | Comments |
|---|---|---|---|
| NAVA catheter | Getinge | Electrical Activity of the Diaphragm | |
| NaCl 0,9% | Any | Electrical Activity of the Diaphragm | NAVA catheter is immersed in normal saline prior to insertion |
| EAdi data recording software | Getinge | Electrical Activity of the Diaphragm | ServoTracker software can be provided by Getinge |
| NAVA-enabled ventilator | Getinge | Electrical Activity of the Diaphragm | |
| 14fr NutriVent catheter | SIDAM | Esophageal manometry | Only for larger children |
| 6fr, 7fr, 8fr esophageal catheter | Avea | Esophageal manometry | |
| 5fr esophageal catheter | Cooper | Esophageal manometry | |
| Pressure transducer | Any | Esophageal manometry | Can be integrated into regular monitor or standalone device (E.g. FluxMed, MBMed, Argentina) |
| 3-way luer lock connector | Any | Esophageal manometry | |
| Sterile gel | Any | Esophageal manometry | Lubrification of esophageal balloon prior to insertion |
| Syringes for balloon inflation | Any | Esophageal manometry | Historically, glass syringes were used. Nowadays conventional plastic disposable syringes are used. Small volume (2-3 ml) is preferred for pediatric balloons. For adults use 10 ml syringe. |
| Data analysis software | Any | Esophageal manometry | E.g. FluxView (MBMed, Argentina) |
| Rigid luer-lock extension set | Any | Esophageal manometry | |
| Ultrasound machine | Any | Diaphragm ultrasound | M-mode capabilities are needed |
| High-resolution linear probe (6–13 MHz) | Any | Diaphragm ultrasound | |
| Low-frequency curvilinear or phased-array probe (2–5 MHz) | Any | Diaphragm ultrasound |
References
- Brochard, L., Slutsky, A., Pesenti, A. Mechanical ventilation to minimize progression of lung injury in acute respiratory failure. Am J Respir Crit Care Med. 195, 438-442 (2017).
- Goligher, E. C., et al. Evolution of diaphragm thickness during mechanical ventilation: impact of inspiratory effort. Am J Respir Crit Care Med. 192, 1080-1088 (2015).
- Goligher, E. C., et al. Lung- and diaphragm-protective ventilation. Am J Respir Crit Care Med. 202, 950-961 (2020).
- Knisely, A. S., Leal, S. M., Singer, D. B. Abnormalities of diaphragmatic muscle in neonates with ventilated lungs. J Pediatr. 113, 1074-1077 (1988).
- Heunks, L., Doorduin, J., van der Hoeven, J. G. Monitoring and preventing diaphragm injury. Curr Opin Crit Care. 21, 34-41 (2015).
- Hooijman, P. E., et al. Diaphragm muscle fiber weakness and ubiquitin-proteasome activation in critically ill patients. Am J Respir Crit Care Med. 191, 1126-1138 (2015).
- Goligher, E. C. Myotrauma in mechanically ventilated patients. Intensive Care Med. 45, 881-884 (2019).
- Valverde Montoro, D., et al. Ultrasound assessment of ventilator-induced diaphragmatic dysfunction in mechanically ventilated pediatric patients. Paediatr Respir Rev. 40, 58-64 (2021).
- Yao, Y., et al. Association of diaphragmatic dysfunction with duration of mechanical ventilation in pediatric intensive care: a prospective cohort study. BMC Pediatr. 24, 607 (2024).
- Yoshida, T., Grieco, D. L., Brochard, L., Fujino, Y. Patient self-inflicted lung injury and positive end-expiratory pressure for safe spontaneous breathing. Curr Opin Crit Care. 26 (1), 59-65 (2020).
- Khemani, R. G., et al. Risk Factors for Pediatric Extubation Failure: The Importance of Respiratory Muscle Strength. Crit Care Med. 45 (8), e798-e805 (2017).
- Abu-Sultaneh, S., et al. Executive SHORT ABSTRACT: International Clinical Practice Guidelines for Pediatric Ventilator Liberation, A Pediatric Acute Lung Injury and Sepsis Investigators (PALISI) Network Document. Am J Respir Crit Care Med. 207 (1), 17-28 (2023).
- Khemani, R. G., et al. Randomized Trial of Lung and Diaphragm Protective Ventilation in Children. NEJM Evid. 4 (6), EVIDoa2400360 (2025).
- Telias, I., et al. Airway occlusion pressure as an estimate of respiratory drive and inspiratory effort during assisted ventilation. Am J Respir Crit Care Med. 201, 1086-1098 (2020).
- Rudolph, M. W., et al. Airway occlusion pressure and P0.1 to estimate inspiratory effort and respiratory drive in ventilated children. Pediatr Crit Care Med. 26, e498-e506 (2025).
- Natalini, G., et al. Non-invasive assessment of respiratory muscle activity during pressure support ventilation. J Clin Monit Comput. 35, 913-921 (2021).
- De Meyer, G. R., et al. Relationship between esophageal pressure and diaphragm thickening fraction in sedated children. Pediatr Crit Care Med. 24, 652-661 (2023).
- Khemani, R. G., et al. Risk factors for pediatric extubation failure: The importance of respiratory muscle strength. Crit Care Med. 45 (8), e798-e805 (2017).
- Hotz, J. C., Sodetani, C. T., Van Steenbergen, J. V., Khemani, R. G., Deakers, T. W., et al. Measurements obtained from esophageal balloon catheters are affected by the esophageal balloon filling volume in children with ARDS. Respir Care. 63 (2), 177-186 (2018).
- Mojoli, F., Iotti, G. A., Torriglia, F., et al. In vivo calibration of esophageal pressure in the mechanically ventilated patient makes measurements reliable. Crit Care. 20 (1), (2016).
- Rudolph, M. W., Koopman, A. A., Blokpoel, R. G. T., Kneyber, M. C. J. Evaluation of Optimal Esophageal Catheter Balloon Inflation Volume in Mechanically Ventilated Children. Respir Care. 69 (3), 325-332 (2024).
- Sun, X. M., et al. Use of esophageal balloon pressure-volume curve analysis to determine esophageal wall elastance and calibrate raw esophageal pressure: a bench experiment and clinical study. BMC Anesthesiol. 18 (1), 21 (2018).
- Shein, S. L., Hotz, J., Khemani, R. G. Derivation and Validation of an Objective Effort of Breathing Score in Critically Ill Children. Pediatric Critical Care Medicine. 20 (1), E15-E22 (2019).
- Ito, Y., et al. Estimation of inspiratory effort using airway occlusion maneuvers in ventilated children: a secondary analysis of an ongoing randomized trial testing a lung and diaphragm protective ventilation strategy. Crit Care. 27 (1), 466 (2023).
- Harikumar, G., Moxham, J., Greenough, A., Rafferty, G. F. Measurement of maximal inspiratory pressure in ventilated children. Pediatr Pulmonol. 43 (11), 1085-1091 (2008).
- Bellissimo, C. A., Morris, I. S., Wong, J., Goligher, E. C. Measuring Diaphragm Thickness and Function Using Point-of-Care Ultrasound. J Vis Exp. (201), e65431 (2023).
- Vaporidi, K., et al. Esophageal and transdiaphragmatic pressure swings as indices of inspiratory effort. Respir Physiol Neurobiol. 284, 103561 (2021).
- Carteaux, G., et al. Bedside adjustment of proportional assist ventilation to target a predefined range of respiratory effort. Crit Care Med. 41 (9), 2125-2132 (2013).
- Khemani, R. G., et al. Pediatric extubation readiness tests should not use pressure support. Intensive Care Med. 42 (8), 1214-1222 (2016).
- Willis, B. C., et al. Pressure-rate products and phase angles in children on minimal support ventilation and after extubation. Intensive Care Med. 31, 1700-1705 (2005).
- Eachempati, S. R. Minimally invasive and noninvasive diagnosis and therapy in critically ill and injured patients. Arch Surg. 134, 1189 (1999).
- Tonelli, R., et al. Assessing inspiratory drive and effort in critically ill patients at the bedside. Crit Care. 29, 339 (2025).
- Emeriaud, G., et al. Evolution of inspiratory diaphragm activity in children over the course of the PICU stay. Intensive Care Med. 40, 1718-1726 (2014).
- Kallio, M., et al. Electrical activity of the diaphragm during neurally adjusted ventilatory assist in pediatric patients. Pediatr Pulmonol. 50, 925-931 (2015).
- Plante, V., et al. Elevated diaphragmatic tonic activity in PICU patients. Pediatr Crit Care Med. 24, 447-457 (2023).
- Kyogoku, M., et al. Direction and magnitude of change in plateau pressure during inspiratory holds. Crit Care Med. 49, 517-526 (2021).
- Pavez, N., Damiani, L. F. Inspiratory and expiratory pause during pressure support ventilation. Med Intensiva. 46, 213-216 (2022).
- Duyndam, A., et al. Reference values of diaphragmatic dimensions in healthy children aged 0-8 years. Eur J Pediatr. 182, 2577-2589 (2023).
- Johnson, R. W., et al. Muscle atrophy in mechanically ventilated critically ill children. PLoS One. 13, e0207720 (2018).
- Gao, Y., et al. Accuracy of lung and diaphragm ultrasound in predicting infant weaning outcomes. Front Pediatr. 11, 1211306 (2023).
- Shimatani, T., et al. Fundamental concepts and latest evidence for esophageal pressure monitoring. J Intensive Care. 11, 22 (2023).
- Sinderby, C., et al. Neural control of mechanical ventilation in respiratory failure. Nat Med. 5, 1433-1436 (1999).
- Barwing, J., et al. Evaluation of catheter positioning for neurally adjusted ventilatory assist. Intensive Care Med. 35, 1809-1814 (2009).
- Bellani, G., et al. Estimation of patient inspiratory effort from diaphragm electrical activity. Crit Care Med. 41, 1483-1491 (2013).
- Essouri, S., et al. Relationship between diaphragmatic electrical activity and esophageal pressure monitoring in children. Pediatr Crit Care Med. 20, e319-e325 (2019).
- Crulli, B., et al. Evolution of inspiratory muscle function in children during mechanical ventilation. Crit Care. 25, 1-10 (2021).
- Koopman, A. A., et al. Surface electromyography to quantify neuro-respiratory drive in mechanically ventilated children. Respir Res. 24, 77 (2023).
- Manczur, T. I., et al. Assessment of respiratory drive and muscle function in the pediatric intensive care unit. Pediatr Crit Care Med. 1, 124-126 (2000).
- Eito, Y., et al. Estimation of inspiratory effort using airway occlusion maneuvers in ventilated children: a secondary analysis of an ongoing randomized trial testing a lung and diaphragm protective ventilation strategy. Crit Care. 27 (1), 466 (2023).
- Foti, G., et al. End-inspiratory airway occlusion method to assess inspiratory muscle pressure. Am J Respir Crit Care Med. 156, 1210-1216 (1997).
- DiNino, E., et al. Diaphragm ultrasound as a predictor of successful extubation. Thorax. 69, 431-435 (2014).
- Sanchez De Toledo, J., et al. Diagnosis of abnormal diaphragm motion after cardiothoracic surgery. Congenit Heart Dis. 5, 565-572 (2010).
- Kopp, W., et al. Impact of preintubation noninvasive ventilation in pediatric ARDS. Crit Care Med. 49, 816-827 (2021).
Access restricted. Please log in or start a trial to view this content.