Self-assembling human cardiac organoids (hCOs) are an emerging system for modeling human cardiac development and disease. Here, a methodology for generating and injuring hCOs with hypoxia-reoxygenation and details of expected histological and functional outcomes after injury are provided.
A subscription to JoVE is required to view this content. Sign in or start your free trial.
Method Article
A Hypoxia-Reoxygenation Injury Model in Self-Assembling Human Cardioids
In This Article
Summary
Abstract
Without rapid revascularization, ischemic heart disease leads to irreversible loss of cardiomyocytes, scar formation, and decreased cardiac function. The ability to model hypoxia-reoxygenation injuries and evaluate potential therapeutic interventions in human tissues is an unmet need. Human cardiac organoids (hCOs) are an emerging model system, but beginning work with hCOs can be challenging due to their small size, requirements for suspension culture, and variability in differentiation efficiency. This protocol offers a user-friendly guide for generating and maintaining human iPSC-derived self-assembling hCOs; methods to process and histologically analyze hCOs; and an approach to injure hCOs with hypoxia-reoxygenation that mimics the fibrosis and apoptosis seen with human ischemia/reperfusion. This protocol provides guidance for using hCOs as a complement to animal models of ischemia-reperfusion injury and could be used to identify and test factors that may boost human myocardial recovery.
Introduction
Ischemic heart disease is a leading cause of morbidity and mortality worldwide, affecting at least 20.5 million people in the United States alone1,2,3. Without adequate perfusion, prolonged hypoxia results in cardiomyocyte (CM) death and myocardial dysfunction. Myocardial ischemia is primarily treated with revascularization via percutaneous intervention, thrombolytic therapy, or coronary artery bypass grafting. However, revascularization is a double-edged sword and can cause additional injury via the release of reactive oxygen species4,5. While reperfusion strategies have been immensely successful, approaches to limit CM loss during ischemic insults or after reperfusion have been more elusive. Though many attempts to salvage infarcted tissue prove effective in animal models of ischemia-reperfusion, these same therapies have largely been unable to achieve significant benefit in human trials, raising a need for human models to evaluate CM-sparing or replenishing therapeutics6,7,8,9,10,11,12.
Human platforms used to model cardiac injury include primary tissues and human induced pluripotent stem cell (hiPSC)-derived systems13,14. Because primary tissues are constrained by sample availability, hiPSC systems have emerged as the dominant human platform for cardiac disease modeling, with the distinct advantages of being genetically tractable and scalable15,16,17,18,19. Traditional 2D hiPSC-derived cardiomyocyte (hiPSC-CM) cultures are limited by the immaturity of the resulting CMs, the absence of complex tissue architecture, and an inability to reproduce the full cellular diversity found in the human heart15,20. To address these shortcomings, engineered 3D heart tissues (EHTs) have become increasingly adopted20,21,22,23,24,25,26. EHT approaches include mixing pre-differentiated cardiac cells into spheroids24 or seeding differentiated cardiac cells into scaffolds or molds21,22,27. Although EHTs can better model heterotypic cellular interactions and have relatively more maturity than 2D cultures, the requirements for custom scaffolds or bioreactors to create and maintain EHTs currently limit their scalability21,27,28.
Self-assembling cardiac organoids (hCOs), or cardioids, are a new and powerful in vitro human model system20,25,26,29. hCOs have several advantages. First, they can include multiple cell types, including endothelial cells, fibroblasts, and epicardial cells, without the need for multiple specialized differentiation protocols26,29,30. Second, most of their differentiation occurs in 3D suspension culture, obviating the requirements for specialized molds or tissue matrix25,26,29,30. Finally, hCOs have a stereotypical spherical morphology with a central cavity, enabling morphological analyses. Thus, hCOs have scalability similar to 2D culture systems while retaining some of the tissue complexity of EHTs. hCOs have been used for drug toxicity testing, patient-specific disease modeling, and to model aspects of cardiac development20,26,30,31,32,33,34,35,36,37,38,39. While promising, hCOs have several limitations compared to EHTs, including an inability to directly measure force output. Further, there is no native immune cell population in the described hCO models, though it is possible to populate hCOs with macrophages. Nevertheless, hCOs are an emerging and rapidly evolving human model system20,26,30,31,32,33,34,35,36,37,38,39.
To date, modeling cardiac injury with hCOs has been limited. A cryoinjury model has been described, but injuries are highly variable, and the need to individually injure hCOs limits scalability29. This manuscript describes a user-friendly protocol for generating and injuring self-assembling hCOs with hypoxia-reoxygenation (H/R) injury. Compared to other protocols for generating hCOs, this protocol uses a simplified differentiation medium and incorporates the 2D-3D mesoderm differentiation strategy described by Hofbauer et al.29. The protocol for H/R injury can be performed any time after hCOs begin beating, which typically occurs around differentiation day 8 (D8) to D11. H/R duration can be titrated between 6 h and 24 h to achieve the desired level of injury, ranging from minimal to near complete CM loss. Additionally, hCOs stereotypically develop a collagenous core with Vimentin+ cells after H/R injury that also scales in severity with H/R duration. This high-throughput, scalable hCO model of H/R injury potentially addresses the need for human models to develop and test new therapeutic avenues for promoting CM recovery or regeneration after injury.
Access restricted. Please log in or start a trial to view this content.
Protocol
All procedures for handling human cell lines should follow local biosafety protocols. All experiments were performed using the iPSC cell line DU11, which is derived from healthy newborn male fibroblasts by the iPSC core facility at Duke University.
1. Generation of hCOs
NOTE: This section describes a standard protocol for generating hCOs from iPSCs (Figure 1). All steps detailed in this protocol should be performed in a laminar flow hood to ensure sterility. Refer to Table 1 for differentiation media recipes.
| Day | Stock Concentration | Working Concentration | Dilution Factor | Base Media |
| D0 | 10 mM CHIR99021 | 10 µM CHIR99021 | 1:1000 | RPMI-1640, 2% B27 Minus Insulin |
| 100 mg/mL Ascorbic Acid | 50 µg/mL Ascorbic Acid | 1:2000 | ||
| 10 mg/mL Activin A | 60 ng/mL Activin A | 1:167 | ||
| D1 | 5 mM IWP2 | 5 µM IWP2 | 1:1000 | RPMI-1640, 2% B27 Minus Insulin |
| 100 mg/mL Ascorbic Acid | 50 µg/mL Ascorbic Acid | 1:2000 | ||
| D2 | 5 mM IWP2 | 5 µM IWP2 | 1:1000 | RPMI-1640, 2% B27 Minus Insulin |
| 100 mg/mL Ascorbic Acid | 50 µg/mL Ascorbic Acid | 1:2000 | ||
| 10 mM Thiazovivin | 2 µM Thiazovivin | 1:5000 | ||
| D3 | 5 mM IWP2 | 5 µM IWP2 | 1:1000 | RPMI-1640, 2% B27 Minus Insulin |
| 100 mg/mL Ascorbic Acid | 50 µg/mL Ascorbic Acid | 1:2000 | ||
| D4 | 5mM IWP2 | 5 µM IWP2 | 1:1000 | RPMI-1640, 2% B27 Minus Insulin |
| D6+ | N/A | N/A | RPMI-1640, 2% B27 Plus Insulin |
Table 1: Differentiation media table. Stock concentrations, working concentrations, and dilution factor for each differentiation factor through differentiation days 0-6. Prepare all working solutions fresh at the time of feed.
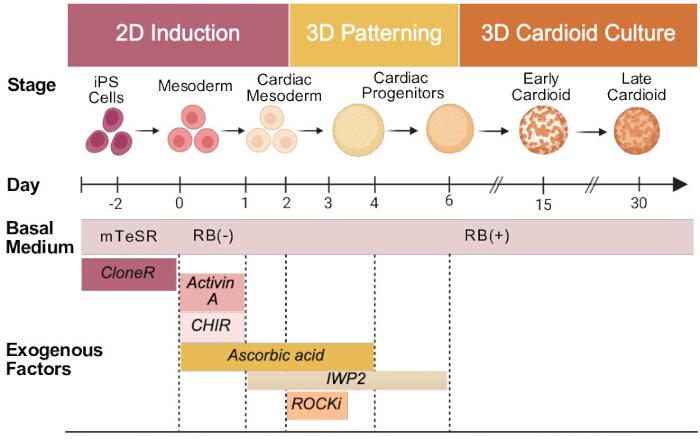
Figure 1: Schematic of hCO differentiation. Please click here to view a larger version of this figure.
- iPSC maintenance
- Fully cover the bottom of each well of a 12-well plate with basement membrane matrix at a 1:100 ratio, diluted in cold DMEM/F12 media. Incubate treated plates at 37 °C for 1 h to allow polymerization. If not using immediately, plates can be sealed with a film and stored at 4 °C for up to 2 weeks and incubated for at least 60 min at 37 °C prior to use.
- Differentiation day -3 (D-3): plating iPSCs for subsequent differentiation
- Prepare basement membrane matrix-coated plates as described in step 1.1.1.
- Aspirate maintenance media from iPSC culture and add enough cell detachment solution to entirely cover cells (~500 μL per well of a 12-well plate or 1 mL per well of a 6-well plate). Incubate at 37 °C for 5 min.
- Add an equal volume of iPSC maintenance media to each well and gently tap the plate to help detach cells. Tilt the plate towards yourself and gently pipette up and down across the bottom of the well to further detach adherent cells, no more than 3 times. Use a pipette to move the cell suspension to a 15 mL conical tube.
- Pellet cells by centrifugation at 300 x g for 3 min at room temperature in a swinging bucket centrifuge. Aspirate supernatant and gently resuspend cells in 1 mL of iPSC maintenance media.
- Move 10 μL of the cell suspension to a new 1.5 mL microcentrifuge tube. Add 10 μL of Trypan blue and pipette to mix. Add 10 µL of the iPSC/Trypan blue mixture to hemocytometer and count live cells.
- Dilute the cell suspension to a final concentration of 100,000-200,000 cells/mL in iPSC maintenance media with ROCK inhibitor (ROCKi). Add 1 mL/well of the cell suspension to each well of a 12-well plate coated with basement membrane matrix.
NOTE: Plating density prior to differentiation depends on the growth rate of a given cell line. Plating density may need to be adjusted for each iPSC line. ROCKi concentration may need to be titrated depending on the brand/formulation used.
- Differentiation D-2: Exchanging media to remove ROCKi
- Exchange media for 1 mL of fresh iPSC maintenance media, without ROCKi. Cells should begin to form small colonies. Colonies should look flat (Figure 2A). If cells appear to look cobblestone-like, spindly, or elongated, this is a sign of spontaneous differentiation, and differentiation efficiency may be impacted.
- Differentiation D-1: Continue to incubate cells without treatment.
- Differentiation D0: Starting of differentiation and mesoderm induction
- Using a microscope, check the cell density to ensure 70%-90% confluency (Figure 2B) at the time of differentiation. If sub-confluent, feed cells with iPSC maintenance media and wait for 24 h. If the cells are too confluent, split the cells as in step 1.2
- Prepare 12 mL per 12-well plate of D0 mesoderm induction media (10 µM CHIR99021, 50 µg/mL Ascorbic Acid, 60 ng/mL Activin A in RPMI-1640 with 2% B27 Supplement Minus Insulin (RB-)).
- Remove existing media and replace with 1 mL/well of D0 mesoderm induction media. Note the time of media exchange.
- Differentiation D1: Cardiac mesoderm specification
- Exactly 24 h after the addition of D0 mesoderm induction media, exchange media for D1 cardiac mesoderm specification media (5 µM IWP2, 50 µg/mL Ascorbic Acid in RB).
- Differentiation D2: hCO formation
- Add enough cell dissociation reagent to cover the cells and incubate at 37 °C for 5 min (Figure 2C). Add an equal volume of D2 cardiac mesoderm media to each well and gently pipette up and down to release adherent cells. Transfer the cell suspension to a 15 mL conical tube.
- Pellet cells by centrifugation at 300 x g for 3 min at room temperature. Resuspend in 1 mL of D2 cardiac mesoderm specification media (5 µM IWP2, 50 µg/mL Ascorbic Acid in RB-).
- Take 10 µL of the cell suspension and add to it 10 µL of Trypan blue. Count cells with any preferred method. Dilute cells to a concentration of 100,000 cells/mL in D2 cardiac mesoderm specification media, with 2 µM thiazovivin. Use 10 mL of the cell suspension per 96-well ultra-low attachment plate.
- Transfer the cell suspension to an appropriately sized reagent reservoir and use a multichannel pipette to transfer 100 µL to each well of an ultra-low attachment 96-well plate, for a final concentration of 10,000 cells/well.
- To induce hCO formation in suspension culture, centrifuge plates at 500 x g for 5 min at room temperature. After centrifugation, there will be a large pellet of cells (Figure 2D)- if this pellet is not circumscribed, repeat centrifugation.
NOTE: Not all cells will incorporate into the hCO, which will appear as a circumscribed cell pellet, with individual cells visible on brightfield microscopy. Some single-cell debris in the plate surrounding the hCO is normal.
- Differentiation D3: Addition of media to dilute ROCKi
- Prepare 10 mL of D3 media (5 µM IWP2, 50 µg/mL Ascorbic Acid in RB-) per plate. Using a multichannel pipette, add 100 µL of D3 media to each well, without removing any media.
NOTE: At this stage, hCOs will have condensed into a dark, well-circumscribed spheroid. Individual cells will not be visible (Figure 2E).
- Prepare 10 mL of D3 media (5 µM IWP2, 50 µg/mL Ascorbic Acid in RB-) per plate. Using a multichannel pipette, add 100 µL of D3 media to each well, without removing any media.
- Differentiation D4: Exchanging to D4 media
- Remove 100 µL of D3 media and replace with 100 µL of D4 media (5 µM IWP2 in RB-). To reduce the risk of aspiration, tilt the plate towards yourself to a roughly 45° angle and hold a multichannel pipette at a roughly 90° angle relative to the side wall of the plate. Place the multichannel pipette firmly on the side wall of the well and slowly aspirate 100 µL of media, intermittently checking the pipette tips for aspirated hCOs.
NOTE: hCOs are in suspension culture, and aspirating hCOs during media removal is common. To reduce risk of aspiration, tilt plate towards yourself to a roughly 45° angle and hold a multichannel pipette at a roughly 90° angle relative to the side wall of the plate. Place the multichannel pipette firmly on the side wall of the well and slowly aspirate 100 μL of media, intermittently checking pipette tips for aspirated hCOs. - Replace with 100 µL of D4 media.
- Remove 100 µL of D3 media and replace with 100 µL of D4 media (5 µM IWP2 in RB-). To reduce the risk of aspiration, tilt the plate towards yourself to a roughly 45° angle and hold a multichannel pipette at a roughly 90° angle relative to the side wall of the plate. Place the multichannel pipette firmly on the side wall of the well and slowly aspirate 100 µL of media, intermittently checking the pipette tips for aspirated hCOs.
- Differentiation D6: hCO maintenance media
- Remove 100 µL of the D4 media and replace with 100 µL of D6+ media (RPMI-1640 with 2% B27 Supplement (RB+)).
- Differentiation D8
- Continue to exchange media every 2 days by removing 100 µL and replacing with 100 µL of fresh D6+ media. hCOs should grow larger, retain smooth edges, and start beating around D6-11 if successfully differentiated (Figure 2F). hCOs will still appear as dark, well-circumscribed spheroids, and individual cells will not be visible.
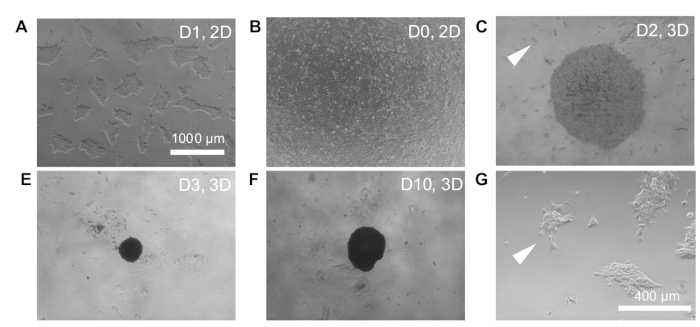
Figure 2: Timeline of hCO Differentiation. Timeline of Organoid Differentiation. (A) iPSC colonies at 1 day before differentiation initiation (D-1). Note distinct, flat appearing colonies. (B) iPSCs at day of differentiation initiation (D0) at ~90% confluency. (C) Organoid at differentiation D2 immediately after organoid formation in a 96-well ultra-low attachment plate. Arrow denotes an example of needle-shaped IWP2 crystals. (D) Organoids at differentiation D3. Note significant organoid compaction due to cell-cell junction formation; some unincorporated cell debris is normal at this stage. (E) Organoids at differentiation D10. (F) Arrow indicates iPSC colony with elongated, spindly cells with a cobblestone appearance, indicating potential spontaneous differentiation. Scale bar = 1000 µm for panels A-E, scale bar = 400 µm for panel F. Please click here to view a larger version of this figure.
2. Collecting and fixing hCOs for immunostaining
- Using a 1000 µL pipette with the tip cut off, transfer hCOs to a 1.7 mL microcentrifuge tube. Once all hCOs are transferred, wait for the hCOs to sink to the bottom of the tube and gently remove excess media. Wash hCOs 1x with PBS, wait a few seconds for hCOs to sink to the bottom of the tube, and gently remove excess PBS.
- Fix hCOs with 4% PFA for 30 min at room temperature.
NOTE: Some antibodies may require acetone or methanol fixation for optimal performance. Refer to manufacturer guidelines.
3. Whole-mount immunostaining
- Transfer the desired number of fixed hCOs to a 1.7 mL microcentrifuge tube. Remove fixative solution and wash with PBS containing 0.1% Tween-20 (PBS-T).
- To wash hCOs, remove as much of the excess fixative as possible. Be careful not to disturb the hCOs at the bottom of the tube. Add ~1 mL of PBS-T and wait a few seconds for the hCOs to sink to the bottom of the tube before moving on to the next step.
- Dilute the primary antibody to a desired concentration in staining solution (10% neonatal calf serum, 1% DMSO in 0.1% PBS-T). Add 50-100 µL of primary antibody solution per microcentrifuge tube (or enough volume to cover all hCOs in each tube).
- Incubate for 24 h at 4 °C on a shaker/rocker. Remove excess primary antibody and then perform three, 1 h washes in PBS-T at room temperature. Perform a final wash overnight in PBS-T at 4 °C to be sure any excess antibody is removed.
- Dilute secondary antibody to a desired concentration in staining solution and add 50-100 µL of antibody solution per microcentrifuge tube (or enough volume to cover all hCOs in each tube).
- Incubate hCOs with the secondary antibody for 24 h at 4 °C on a shaking platform. Remove excess secondary antibody and then perform three, 1 h washes in PBS-T at room temperature. Perform a final wash overnight in PBS-T at 4 °C to be sure all excess antibody is removed.
- For whole mount imaging, transfer hCOs using a 1000 µL pipette with the tip cut off to a positively charged glass slide. Remove excess PBS-T and add a few drops of mounting media to cover the hCOs. Carefully place a cover slip to flatten the hCOs.
NOTE: To preserve the 3D architecture of the hCO, use a rubber gasket or double-sided tape around the edges of the slide to raise the height of the cover slip. Using a clearing mounting media can be helpful to improve imaging through the hCO, especially if hCOs are not flattened.
4. Sectioning and embedding
- After fixation, cover hCOs in 30% sucrose overnight at 4 °C for cryoprotection. Using a 1000 µL pipette with tip cut off, transfer the desired number of hCOs to a 12 mm x 12 mm plastic mold. Carefully remove excess sucrose solution, taking care not to aspirate hCOs.
NOTE: It is helpful to pipette 30% sucrose up and down in the pipette tip before transferring to prevent hCOs from sticking to the side of the tip. - Add a small drop of OCT, just enough to cover the hCOs. Using a pair of fine tweezers or a pipette tip, gently reposition hCOs in OCT such that hCOs are not clumped together and no hCOs are near the edges of the mold. Ensure all hCOs are as close to the bottom of the mold as possible with the goal of maximizing the number of hCOs found in a single cryosection.
- Freeze this initial layer of OCT by placing the mold in a Styrofoam cooler with a layer of dry ice at the bottom. Wait a few minutes for the OCT to harden and then move the mold from dry ice to the benchtop. Add additional OCT until the mold is filled. Wait for the first layer of OCT to fully melt before moving back to dry ice.
- Store frozen, embedded hCOs at -80 °C until ready to cryosection.
- When ready to section, align the hCO block as best as possible and start trimming the block. Periodically place a section on a charged slide and visually inspect each section for hCOs. When hCOs are visualized, change to 6 µm sections.
NOTE: The attrition rate of hCOs during embedding and sectioning is at least 10%. Plan accordingly.
5. TUNEL and immunostaining tissue sections
- Use a pap pen to draw a hydrophobic border around tissue sections that need to be stained. Wash slides once in PBS 0.1% Tween (PBS-T) to dissolve OCT.
- Add blocking buffer (10% neonatal calf serum, 1% DMSO, in PBS-T) for 1 h at room temperature.
- Prepare primary antibody solution. Begin with the manufacturer-recommended concentration for immunofluorescence, but the concentration may need to be titrated empirically.
NOTE: Alternatively, TUNEL staining can be performed at this time following the manufacturer's protocol. - Remove blocking buffer from slide. Add enough primary antibody solution to cover hCO sections. Incubate primary antibody overnight at 4 °C or 3 h at 37 °C. Wash slides 3 times for 5 min each in a Coplin Jar filled with PBS-T at room temperature.
- Prepare secondary antibody staining solution in blocking buffer, including DAPI or another pan-nuclear marker. Add enough secondary antibody staining solution to cover hCO sections. Incubate protected from light for 1 h at room temperature.
- Wash slides 3 times for 5 min in a Coplin Jar filled with PBS-T at room temperature. Mount with a coverslip with the desired mounting media.
6. Quantification of nuclear colocalization with CardioCount
NOTE: CardioCount is a deep-learning-based method for scoring CM nuclei from microscopy images40. Originally developed to assess CM cycling, CardioCount performs well for multiple nuclear stains, including TUNEL40.
- To use CardioCount, download the CardioCount package from GitHub or import it to Google Colab (https://github.com/karraresearchgroup/CardioCount.git, https://drive.google.com/file/d/13iwp9JoHPhs2ONSFkZTGxbEXCGwBFVYx/, https://drive.google.com/drive/folders/1-f9h7MvCBsiCngJnV8-f_lplAJpUeeE3). CardioCount Version 1 runs on a Python 3 environment.
- Export images for quantification as individual 512 x 512 pixel .tif files with red, blue, and green channels merged, where the red channel is a CM nuclear marker, blue is a general nuclear marker, and green is a cycling nuclear marker (i.e., Ki67) or apoptotic marker (i.e., TUNEL). Create a parent folder in Google Drive for this experiment and upload merged tiffs as a subfolder.
NOTE: CardioCount was trained on nuclear stains that fill the nucleus. Cycling markers that are more punctate, such as Aurora B or PH3, may not be compatible with CardioCount. - Open CardioCount Notebook in Google CoLab. Run Cell 1.1 to check for graphics processing unit (GPU) access. Run Cell 1.2 to connect CoLab Notebook to Google Drive.
- Run Cell 1.3 to load CardioCount and Dependencies in Google Colab. Edit kfile to read the pathname to where the PRODUCTION_LVADMLPaper_Colab_Libraries folder was saved when downloaded.
- In Cell 2.0, edit base_folder to read pathname to parent folder that contains the subfolder of images to analyze. Run Cell 2.0 to link this folder to CoLab.
- In Cell 2.1.1, edit orig_image_folder to match the name of the folder containing images for analysis. Edit channel_to_remove to read green and edit new_image_folder to name the subfolder under base_folder where all images with the green channel removed (red/blue) will be saved. Repeat this step to remove the red channel, making sure to edit new_image_folder to distinguish the subfolder that contains images with the red channel removed (green/blue).
- In Cell 2.1.2, crop images to 512 x 512 images for the red/blue images. Ensure the uncropped_image_folder matches the new_image_folder name created in step 6.6. for red/blue images. Name destination_image_folder to designate the subfolder where cropped, red/blue images will be saved. Repeat this step to crop the green/blue images. Finally, repeat this step to crop the original 3-channel, merged tiffs housed in base_folder.
- Run Cell 2.2 to generate probability maps. Name data_specific_folder the name of the red/blue and green/blue images generated in destination_image_folder from Cell 2.1.2. For model_dir, input filepath to a folder that contains segmentation models. To segment red nuclei, use model erg_rb_opt, and input 200 for epoch. Rename probmap_directory_name to designate the folder where red/blue probability maps will be saved. Repeat this step for green/blue images. To segment green nuclei, use model edu_mouse_bg_opt, and input 100 for epoch.
- In Cell 2.3.1, object maps will be created based on the probability maps generated in step 6.8. The input_folder will be named after the destination_image_folder from Cell 2.1.2 that contains red/blue probability map images generated in Cell 2.1.2. Name the output_folder where thresholded red/blue images will be stored. Set threshold for level of confidence for nuclear segmentation (Range of 0.0-1.0). Run Cell 2.3.1. Repeat this step for green/blue images.
NOTE: Thresholds for the level of confidence about nuclei will be dataset dependent. Start with a threshold of 0.9 and adjust higher if too lenient and lower if too strict, based on random inspection of probability maps. - In Cell 2.3.2, the number of cells in object maps generated in step 6.10 will be counted and exported to a .csv file. The count_folder will be named after the output_folder from Cell 2.3.1 where thresholded red/blue images are saved. To exclude objects touching the border of an image, ensure ignore_border_cells reads True. Rename csv_path to the pathname of the base_folder where all subfolders are stored. Edit the csv name to reflect counts for red/blue objects. Repeat this step for blue/green images.
- In Cell 2.4, green/red double-positive nuclei will be counted. Rename img_folder to the name of the subfolder generated in step 6.8 that contains cropped, 3-channel images. Rename childcell_folder to the output_folder from Cell 2.3.1 where thresholded red/blue images are saved. Rename parentcell_folder to the output_folder from Cell 2.3.1 where thresholded green/blue images are saved. Rename dest_folder to designate the folder where double positive object maps will be saved. Rename csv_path to designate the pathname and file name to the base_folder where all subfolders are stored and edit the csv name to reflect counts for double positive objects.
- Verify accurate segmentation by comparing the red, green, and double positive counts generated per image to the raw image.
- If CardioCount consistently overestimates the number of nuclei in an image relative to what a blinded reviewer would count, repeat step 6.9 with a higher confidence threshold, and repeat steps 6.10-6.11. If CardioCount underestimates the number of nuclei in an image relative to what a blinded reviewer would count, repeat step 6.9 with a lower confidence threshold, and repeat steps 6.10-6.11.
- Sum all the counts for each hCO for red nuclei, green nuclei, and double positive nuclei. Calculate % cycling nuclei as (double-positive nuclei / total red CM nuclei) x 100 for each organoid.
7. Hypoxia-reoxygenation injury
- Prepare hypoxia media (119 mM NaCl, 12 mM KCl, 1.2 mM NaH2PO4, 1.3 mM MgSO4, 0.5 mM MgCl2, 0.9 mM CaCl2, 20 mM sodium lactate, and 5 mM HEPES, pH = 6.4)5.
- To a cell culture flask, transfer 5 mL of hypoxia media per 96-well hCO plate. Place the cell culture flask inside the hypoxia chamber, and flush with anoxic gas (5% CO2, 95% N2) for 3 min. Incubate at 37 °C for at least 1 h before initiating hypoxia.
- Remove all media from hCOs. Start by removing ~150 µL with a multichannel pipette from all wells. Then, use a 200 µL pipette to carefully remove the remaining media from individual wells, without disturbing hCOs.
NOTE: Removal of all media from all wells is critical to achieving reproducible injury. - Add 50 µL of hypoxia media to each well. Place the hCO plate in the hypoxia chamber and flush with anoxic gas (5% CO2, 95% N2) for 3 min. Place the hypoxia chamber in the incubator at 37 °C for 6 h.
- To initiate reoxygenation, remove hCOs from the hypoxia chamber, and feed with 150 µL of pre-warmed RB+ media. Allow at least 3 h of reoxygenation at 37 °C before performing downstream assays.
8. Lactate dehydrogenase release assay
- Collect 20 µL of media from wells of injured and uninjured hCOs at the desired time point after initiating reperfusion. Dilute 1:10 in 180 µL of LDH storage buffer (200 mM Tris-HCl (pH 7.3), 10% Glycerol, 1% BSA). Store at -20 °C until ready to perform assay. Pipette up and down several times to mix media before collection
- Thaw frozen media. Add 45 µL of LDH storage buffer to one well of a black wall, clear-bottom 96-well plate for each media sample to be assayed. Add 5 µL of 1:10 diluted media to each well for a final dilution of 1:100. Prepare LDH Detection Reagent by mixing 50 µL of LDH Detection Enzyme Mix and 0.25 µL of Reductase Substrate for each sample to be assayed.
- Add 50 µL of LDH Detection Reagent to each well containing 1:100 diluted media. Incubate at room temperature, protected from light, for 60 min. Assay for bioluminescent signal on a compatible plate reader.
9. Calcium imaging
- Prepare calcium dye staining solution with phenol red-free RPMI-1640, 0.04% pluronic, and 5 µM Cal520-AM. Protect samples from light.
- Remove 100 µL of media from each well intended for calcium imaging. Add 100 µL of calcium dye staining solution and incubate at 37 °C, protected from light, for 30 min.
- Remove 100 µL of media from each well with calcium dye and replace with 100 µL of phenol red-free RPMI-1640. Incubate for 30 min - 1 h at 37 °C to allow dye washout.
- Using a microscope with continuous imaging/streaming capabilities, place the 96-well ultra-low attachment plate in the working position. With a 10x objective, identify the base of an hCO and watch for Cal520 transients.
- Capture 30 s recordings of calcium transients at room temperature. If using a confocal microscope, it will not be possible to image through the entire hCO. Select a focal plane near the base of the hCO, where cell outlines are visible during calcium transients.
10. Calcium transient analysis (Figure 3)
- Calcium transient analysis can be performed using a variety of peak analysis software. Below are instructions for analysis using the Spiky ImageJ plugin41 (https://pccv.univ-tours.fr/ImageJ/Spiky/).
- Add five 2 x 2 pixel regions of interest (ROIs) to the ROI Manager across visible cells in each hCO. Take care to not overlap ROIs with cell nuclei or cell boundaries, as motion of the hCO can affect transient analysis.
- Under Analyze > Set Measurements, select Mean Gray Intensity. In ROI manager, select Multi-Measure to capture Mean Gray Intensity at all ROIs and all frames of the recording.
- Save a .csv file containing the Mean Gray Intensity for all ROIs. Save all ROI positions for each image for later reference.
- In a new spreadsheet, add a column for Time(s). Calculate the time at each frame by dividing the 30 s by the total number of frames, then multiplying by the frame number. Save this as an edited .csv.
- Open the edited .csv file in Fiji and open the Spiky Plugin. Under Analysis Options, select the desired analysis parameters.
- Plot Time(s) on the X axis, and Mean Gray Intensity for ROI #1 on the Y axis. Select Analyze Peaks, and confirm correct annotation of baseline, peak start/end, and peak amplitude. If the wrong number of peaks is identified, change parameters in Analysis Options, including minimum peak amplitude from baseline, and start peak threshold until peak identification is successful.
- Save all intermediate files. Beats per minute (bpm) can be calculated by dividing 60 by the average of the Peak-to-Peak Interval(s) for each ROI.
- Repeat the above analysis for all ROIs per hCO.
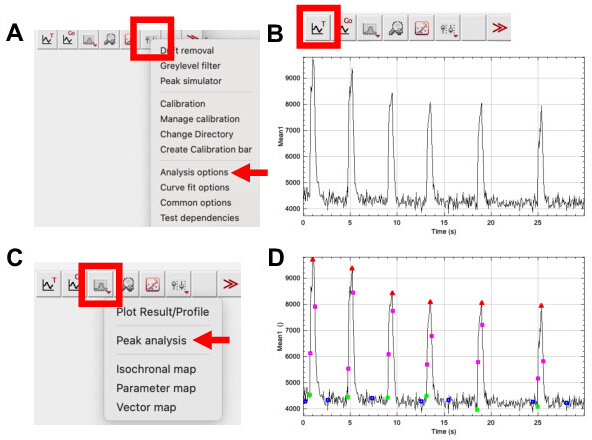
Figure 3: Calcium transient analysis. (A) The red box indicates the button that opens the dropdown menu for choosing analysis parameters. (B) The red box indicates the button to plot Time (s) vs Mean Gray Intensity from an ROI within a representative uninjured hCO. (C) The red box indicates the button to select peak analysis. (D) Representative calcium transient trace and peak analysis from an uninjured hCO. Red triangles indicate peak maximum, pink squares represent max slope for peak upstroke and downstroke, green box indicates start of peak, and blue box indicates baseline. Please click here to view a larger version of this figure.
Access restricted. Please log in or start a trial to view this content.
Results
Following the above protocol should yield well-formed hCOs that begin beating between differentiation days 7-12 (D7-12). As hCOs mature past day 25, it is possible for spontaneous contractions to no longer be visible without electrical pacing. H/R injury can be performed at any time after hCOs begin beating - we typically perform injury on 15-day-old (D15) hCOs or later.
Confirmation of Injury
Like human myocardial infarction, H/R injury of hCOs results in cell death. Clin...
Access restricted. Please log in or start a trial to view this content.
Discussion
Presented here is a step-by-step protocol for generating and injuring self-assembling hCOs with H/R. Ischemic heart diseases are characterized by pathophysiological remodeling, including cardiomyocyte death, fibrotic remodeling, electrical dysfunction, and functional decline. These perturbations are observed in the hCO model system, including increased TUNEL+ CMs, an increase in LDH release, an increase in Vimentin+ tissue area, and alterations in calcium handling leading to loss of functional synch...
Access restricted. Please log in or start a trial to view this content.
Acknowledgements
This work is supported by R01 HL157277 (RK), AHA 24PRE1186062 (LP), F30 HL175908-01 (LP), and the Duke University Medical Scientist Training program T32 5T32GM145449-03 (LP).
Access restricted. Please log in or start a trial to view this content.
Materials
| Name | Company | Catalog Number | Comments |
|---|---|---|---|
| Accutase solution | Sigma-Aldrich | A6964-500ML | |
| Anti-Cardiac Troponin T antibody | Abcam | EPR20266 | |
| B-27 Supplement (50X), serum free | Gibco | 17504044 | |
| B-27 Supplement, minus insulin | Gibco | A1895602 | |
| BioTek Synergy Neo2 Plate Reader | BioTek | ||
| Cal-520, AM | AAT Bioquest | 21131 | |
| CardioCount V1 | Karra Lab | PMID: 38984052 | |
| Cell line (Homo sapiens, male)- DU11 iPSC Line | Duke University Stem Cell Core | ||
| Charged Microscope Slides, White Glass | VWR | 89500-496 | |
| CHIR 99021 | Tocris | 4423 | |
| CloneR | STEMCELL Technologies | 5888 | |
| Corning 96-Well Clear Ultra Low Attachment Microplates | Fisher | 7007 | |
| Disposable Pipetting Reservoirs | VWR | 89094-678 | |
| DMEM/F-12, HEPES | Gibco | 11330057 | |
| EVOS Fluorescent Microscope | EVOS | ||
| Geltrex Reduced-Growth Factor Basement-Membrane Matrix, LDEV-free, stem-cell qualified | Gibco | A1413302 | |
| Human Activin A Recombinant Protein | PEPROTECH INC/Life Technologies | 120-14E-50UG | |
| IWP-2 | STEMCELL Technologies | 72124 | |
| L-Ascorbic Acid (Crystalline/Certified ACS) | Fisher Scientific | A61-100 | |
| Mouse anti-Vimentin | DSHB | AMF-17b | |
| mTeSR Plus | STEMCELL Technologies | 100-0276 | |
| Multiwell Cell Culture Plates – 12 well | VWR | 10062-894 | |
| Pluronic F-127 | Sigma-Aldrich | P2443 | |
| ReLeSR | STEMCELL Technologies | 100-0483 | |
| RPMI 1640 Medium | Gibco | 11875119 | |
| RPMI 1640 Medium, no phenol red | Gibco | 11835-030 | |
| Thiazovivin | STEMCELL Technologies | 72254 | |
| Tissue-Tek O.C.T. Compound | SAKURA FINETEK USA INC (VWR) | 25608-930 | |
| Zeiss Spinning Disk Confocal Microscope | Zeiss |
References
- Bozkurt, B., et al. Heart failure epidemiology and outcomes statistics: A report of the Heart Failure Society of America. J Card Fail. 29 (10), 1412-1451 (2023).
- Groenewegen, A., Rutten, F. H., Mosterd, A., Hoes, A. W. Epidemiology of heart failure. Eur J Heart Fail. 22 (8), 1342-1356 (2020).
- Ss, M., et al. 2025 heart disease and stroke statistics: A report of us and global data from the american heart association. Circulation. 151 (8), e41-e660 (2025).
- Sebastião, M. J., et al. Bioreactor-based 3d human myocardial ischemia/reperfusion in vitro model: A novel tool to unveil key paracrine factors upon acute myocardial infarction. Transl Res. 215, 57-74 (2020).
- Chen, T., Vunjak-Novakovic, G. Human tissue-engineered model of myocardial ischemia-reperfusion injury. Tissue Eng Part A. 25 (9-10), 711-724 (2019).
- Frangogiannis, N. G. Why animal model studies are lost in translation. J Cardiovasc Aging. 2 (2), 22(2022).
- Forrest, M. J., et al. Torcetrapib-induced blood pressure elevation is independent of cetp inhibition and is accompanied by increased circulating levels of aldosterone. Br J Pharmacol. 154 (7), 1465-1473 (2008).
- Barter, P. J., et al. Effects of torcetrapib in patients at high risk for coronary events. New Engl J Med. 357 (21), 2109-2122 (2007).
- Wilensky, R. L., et al. Inhibition of lipoprotein-associated phospholipase a2 reduces complex coronary atherosclerotic plaque development. Nat Med. 14 (10), 1059-1066 (2008).
- Investigators, T. S. Darapladib for preventing ischemic events in stable coronary heart disease. New Engl J Med. 370 (18), 1702-1711 (2014).
- Debenedittis, P., et al. Coupled myovascular expansion directs cardiac growth and regeneration. Development. 149 (18), dev200654(2022).
- Hojo, Y., et al. Expression of vascular endothelial growth factor in patients with acute myocardial infarction. J Am College Cardiol. 35 (4), 968-973 (2000).
- Lodrini, A. M., et al. Modeling cardiac injury using human cardiac slices to test therapeutic approaches for cardiac regeneration and repair. Eur Heart J. 44 (Supplement_2), ehad655.730(2023).
- Arstall, M. A., et al. Human ventricular myocytes in vitro exhibit both early and delayed preconditioning responses to simulated ischemia. J Mol Cell Cardiol. 30 (5), 1019-1025 (1998).
- Chen, I. Y., Matsa, E., Wu, J. C. Induced pluripotent stem cells: At the heart of cardiovascular precision medicine. Nat Rev. Cardiol. 13 (6), 333-349 (2016).
- Narsinh, N., Narsinh, K. H., Wu, J. C. Derivation of human induced pluripotent stem cells for cardiovascular disease modeling. Circ Res. 108 (9), 1146-1156 (2011).
- Lundy, S. D., Zhu, W. Z., Regnier, M., Laflamme, M. A. Structural and functional maturation of cardiomyocytes derived from human pluripotent stem cells. Stem Cells Dev. 22 (14), 1991-2002 (2013).
- Lyra-Leite, D. M., Fonoudi, H., Gharib, M., Burridge, P. W. An updated protocol for the cost-effective and weekend-free culture of human induced pluripotent stem cells. STAR Protoc. 2 (1), 100213(2021).
- Lyra-Leite, D. M., et al. A review of protocols for human ipsc culture, cardiac differentiation, subtype-specification, maturation, and direct reprogramming. STAR Protoc. 3 (3), 101560(2022).
- Hofbauer, P., Jahnel, S. M., Mendjan, S. In vitro models of the human heart. Development. 148 (16), dev199672(2021).
- Shadrin, I. Y., et al. Cardiopatch platform enables maturation and scale-up of human pluripotent stem cell-derived engineered heart tissues. Nat Commun. 8 (1), 1825(2017).
- Baar, K., et al. Self-organization of rat cardiac cells into contractile 3-d cardiac tissue. Faseb J. 19 (2), 275-277 (2005).
- Ronaldson-Bouchard, K., et al. Advanced maturation of human cardiac tissue grown from pluripotent stem cells. Nature. 556 (7700), 239-243 (2018).
- Kahn-Krell, A., et al. A three-dimensional culture system for generating cardiac spheroids composed of cardiomyocytes, endothelial cells, smooth-muscle cells, and cardiac fibroblasts derived from human induced-pluripotent stem cells. Front Bioeng Biotechnol. 10, 908848(2022).
- Lewis-Israeli, Y. R., Volmert, B. D., Gabalski, M. A., Huang, A. R., Aguirre, A. Generating self-assembling human heart organoids derived from pluripotent stem cells. J Vis Exp. (175), e63097(2021).
- Lewis-Israeli, Y. R., et al. Self-assembling human heart organoids for the modeling of cardiac development and congenital heart disease. Nat Commun. 12 (1), 5142(2021).
- Jackman, C. P., et al. Engineered cardiac tissue patch maintains structural and electrical properties after epicardial implantation. Biomaterials. 159, 48-58 (2018).
- Deluca, S., et al. Engineered cardiac tissues as a platform for crispr-based mitogen discovery. Adv Healthc Mater. 14 (1), e2402201(2025).
- Hofbauer, P., et al. Cardioids reveal self-organizing principles of human cardiogenesis. Cell. 184 (12), 3299-3317.e22 (2021).
- Schmidt, C., et al. Multi-chamber cardioids unravel human heart development and cardiac defects. Biorxiv. , (2022).
- Hoang, P., et al. Engineering spatial-organized cardiac organoids for developmental toxicity testing. Stem Cell Rep. 16 (5), 1228-1244 (2021).
- Richards, D. J., et al. Human cardiac organoids for the modelling of myocardial infarction and drug cardiotoxicity. Nat Biomed Eng. 4 (4), 446-462 (2020).
- Abdallah, H., Toomey, K., O'riordan, A. C., Davidson, A., Marks, L. A. Familial occurrence of discrete subaortic membrane. Pediatr Cardiol. 15 (4), 198-200 (1994).
- Lin, H., McBride, K. L., Garg, V., Zhao, M. T. Decoding genetics of congenital heart disease using patient-derived induced pluripotent stem cells (iPSCs). Front Cell Dev Biol. 9, 630069(2021).
- Keung, W., et al. Human cardiac ventricular-like organoid chambers and tissue strips from pluripotent stem cells as a two-tiered assay for inotropic responses. Clin Pharmacol Ther. 106 (2), 402-414 (2019).
- Kupfer, M. E., et al. In situ expansion, differentiation, and electromechanical coupling of human cardiac muscle in a 3d bioprinted, chambered organoid. Circ Res. 127 (2), 207-224 (2020).
- Marini, V., et al. Long-term culture of patient-derived cardiac organoids recapitulated duchenne muscular dystrophy cardiomyopathy and disease progression. Front Cell Dev Biol. 10, 878311(2022).
- Mills, R. J., et al. Drug screening in human psc-cardiac organoids identifies pro-proliferative compounds acting via the mevalonate pathway. Cell Stem Cell. 24 (6), 895-907.e6 (2019).
- Mills, R. J., et al. Functional screening in human cardiac organoids reveals a metabolic mechanism for cardiomyocyte cell cycle arrest. Proc Natl Acad Sci U S A. 114 (40), E8372-E8381 (2017).
- Karpurapu, A., et al. Deep learning resolves myocardial dynamics in the failing human heart. JACC Basic Transl Sci. 9 (5), 674-686 (2024).
- Pasqualin, C., et al. Spiky: An imagej plugin for data analysis of functional cardiac and cardiomyocyte studies. J Imaging. 8 (4), 95(2022).
- Kuppe, C., et al. Spatial multi-omic map of human myocardial infarction. Nature. 608, 7924(2022).
- Karra, R., et al. Vegfaa instructs cardiac muscle hyperplasia in adult zebrafish. Proc Natl Acad Sci U S A. 115 (35), 8805-8810 (2018).
- Ab, A., et al. Macrophages are required for neonatal heart regeneration. J CliniInvest. 124 (3), 1382-1392 (2014).
- Lai, S. L., et al. Reciprocal analyses in zebrafish and medaka reveal that harnessing the immune response promotes cardiac regeneration. Elife. 6, e25605(2017).
Access restricted. Please log in or start a trial to view this content.
Reprints and Permissions
