This protocol describes a dose-controlled cryogenic scanning electron nanobeam diffraction (cryo-SEND) workflow for characterizing beam-sensitive battery interfaces. It preserves native solid-electrolyte interphases by combining ice-free cryogenic handling, electron-dose control, and diffraction-based imaging. The workflow includes guidance for sample preparation, cryogenic transfer, beam alignment, and data acquisition.
Method Article
Cryogenic Scanning Electron Nanobeam Diffraction Workflows for Structural Characterization of Beam-Sensitive Battery Interfaces
In This Article
Summary
Abstract
Observation of battery interfaces is critical, as they govern electron and ion transport and influence electrochemical processes in energy storage. Despite this importance, they are challenging to characterize due to their nanometer-scale thickness and extreme sensitivity to electron beam damage. This paper presents a dose-controlled cryogenic scanning electron nanobeam diffraction (cryo-SEND) protocol that enables structural analysis of beam-sensitive battery interfaces while preserving their native state. The central advance of this workflow is the integration of ice-free cryogenic handling with diffraction-based analysis that decouples structural sensitivity from high-dose image formation. The workflow begins with air-free sample preparation inside an inert-atmosphere glovebox, followed by cryogenic focused ion beam/scanning electron microscopy (cryo-FIB/SEM) milling to produce electron-transparent lamellae. We describe optimized cryogenic transfer procedures from the FIB to the transmission electron microscope, emphasizing the use of a cryo-shuttle equipped with a protective lid to suppress ice contamination during transport. Within the TEM, SEND is performed at cryogenic temperatures to probe interfacial structures at vitrified electrolyte-lithium metal interfaces. SEND enables crystallographic and structural analysis while significantly reducing total accumulated electron dose compared to conventional imaging. Overall, this protocol provides an approach for studying battery interfaces and is broadly applicable to cryogenic electron microscopy investigations of beam-sensitive materials.
Introduction
Optimizing battery interfaces, particularly solid-electrolyte interphases (SEIs), is critical for stable and high-performance rechargeable batteries1. SEIs form as decomposition products from the reactions between liquid or solid electrolytes and battery electrodes. Once they form, these layers regulate ion and electron transport. Insufficient ion transport imposes significant barriers for ion mobility and results in high overpotentials in battery systems, while electrolytes are continuously consumed if they are not electronically passivated. Therefore, functional SEIs must promote fast ion transport and suppress electron leakage to sustain long-term cycling.
Li metal batteries are promising because they can improve the energy density of battery systems compared to conventional graphite-based systems1, but the SEIs that form on Li metal are chemically complex and highly sensitive to electrochemical conditions2. However, the required criteria for SEI stability become more stringent as the field pushes toward the practical systems with high mass loadings and fast charging conditions. Describing SEIs simply as either "good" or "poor" offers limited insights3. Therefore, spatially resolved characterization for SEIs is essential to uncover the structural and chemical origins of SEI stability.
A wide variety of characterization techniques, such as time-of-flight secondary ion mass spectroscopy (TOF-SIMS)4,5 and X-ray photoelectron spectroscopy (XPS)6,7, are commonly used to analyze SEI composition, but their spatial resolutions are insufficient to resolve heterogeneous and buried structures. Recently, cryogenic transmission electron microscopy (cryo-TEM) has emerged as a powerful tool to elucidate SEI structures3,8. Cryo-TEM in conjunction with high-resolution (HR) imaging has superior spatial resolution when compared to other techniques. Despite this advantage, it is increasingly recognized that conventional HRTEM imaging often applies electron doses that exceed the stability limits of SEI components, leading to beam-induced crystallization or decomposition9,10. As a result, there is a growing need for electron microscopy workflows that explicitly control dose while preserving structural fidelity.
The specific goal of this protocol is to establish a low-dose, cryogenic scanning electron nanobeam diffraction (SEND) workflow tailored for battery interfaces, with an emphasis on reliable SEI structural characterization. SEND is a variant of scanning transmission electron microscopy (STEM), where the convergence semi-angle is varied to balance real space and reciprocal space resolution, and diffraction patterns are captured over a rastered region at each scan position11,12. This results in four-dimensional data sets that include real-space information and reciprocal-space information. By tuning the convergence semi-angle, probe size, and step size, the illumination conditions can be optimized to remain well below the critical dose while still resolving nanoscale ordering, crystallinity, and heterogeneity12.
This workflow is needed because existing cryo-TEM approaches primarily rely on phase-contrast imaging, which couples structural interpretability to relatively high cumulative doses. In contrast, SEND decouples structural sensitivity from direct image formation, allowing short-range and medium-range order to be quantified at doses well below those required for HRTEM10,13. At the protocol level, SEND addresses several key challenges: (i) systematic dose control during data acquisition, (ii) improved structural reliability for beam-sensitive SEI phases, and (iii) integration of cryogenic sample handling with diffraction-based analysis suitable for heterogeneous battery interfaces.
The method described here is intended for the study of beam-sensitive interphases in rechargeable batteries, including SEIs on Li metal and other reactive electrode materials, where characteristic thicknesses are on the order of tens of nanometers. SEND is particularly well-suited for probing nanoscale heterogeneity, amorphous-crystalline mixtures, and short-range ordering. However, its applicability is limited by sample thickness, signal-to-noise constraints at low electron doses, and the need for careful data interpretation in highly disordered systems.
We demonstrate, in this protocol, how to perform SEND for battery research, focusing particularly on sample preparation and data acquisition steps. We also discuss ways to minimize frost formation, especially when creating electron-transparent samples, as frost contamination can obscure SEI features and complicate diffraction analysis. These methods provide detailed guidelines for reproducible, artifact-free characterization of battery interfaces. This technique is not limited to the SEI characterization but also to other systems involving beam-sensitive materials.
Electron transparency is a prerequisite for transmission electron microscopy (TEM). In this work, we demonstrate two complementary workflows to achieve electron-transparent battery specimens: on-grid TEM preparation and cryogenic focused ion beam (cryo-FIB) milling14,15. The on-grid preparation method is effective when samples are intrinsically thin or composed of low-atomic number materials, such as lithium plates or nanoparticles, which can be directly transferred to or electrochemically deposited onto commercial TEM grids. However, this approach can compromise the original structural integrity of battery interfaces. Battery materials are inherently heterogeneous, and preserving their mechanical and interfacial structure during TEM observation is critical. In addition, on-grid protocols often require rinsing to remove liquid electrolytes, which can lead to the loss of loosely bound or fragile SEI components, thereby altering the native interfacial structure.
By contrast, the cryo-FIB method enables site-specific thinning while preserving buried interfaces and vitrified electrolytes, making it the preferred approach when maintaining the native morphology and chemistry of battery interfaces is essential. Cryo-FIB milling provides controlled, reproducible electron transparency across a wide range of battery architectures, regardless of initial sample thickness or the presence of liquid electrolytes. In this protocol, we present both preparation strategies and outline their respective advantages and limitations. We also emphasize the cryo-FIB workflow as a robust method for structural characterization of beam-sensitive battery interfaces.
Protocol
1. Electrodeposition of Li on TEM grid
- Dry all battery compartments and chemicals inside a glovebox-attached antechamber overnight for ≥12 h. Store them in an argon environment for ≥24 h to remove any water residue.
- Place Cu foils on a standard CR-2032 positive coin cell case. Do not remove the native copper oxide layer prior to lithium deposition.
NOTE: Removal of the oxide layer (e.g., via dilute HCl treatment) is not required for this protocol and may introduce uncontrolled surface chemistry. - Prepare electron-transparent battery samples for TEM analysis. While scraping off battery electrodes and casting them on TEM grids are common options, to follow this protocol, deposit Li metal electrochemically on Cu mesh TEM grids.
NOTE: Since Li metal is one of the lightest elements, electron transparency for electron accelerating voltages ( 200 kV) of standard TEM operation is readily achieved. In contrast, electron-transparent samples can be prepared via cryogenic lift-out. Read the protocol carefully to determine the workflows.- If the goal is to deposit Li on TEM grids, place mesh grids (300 mesh) on the Cu foil. When using cryo-FIB to create electron-transparent samples, use a single layer of copper foil rather than TEM grids.
- Place a battery separator on top of the Cu foil.
NOTE: Use polypropylene-based separators as they are easily peeled off from electrodes for subsequent characterization. Surfactant-coated separators are suited for carbonate electrolytes and use a single layer of polypropylene-based separator. - Use standard Li metal chips or rolled Li metal foils (~8 mm in diameter) on the separator. Roll or scratch off Li metal foils/chips to remove surface oxide.
NOTE: A 10 nm-thick surface oxide is already present in Li metal chips. Scratching removes this surface layer. - Inject liquid electrolytes (80-100 µL) into the separator. Prepare battery electrolytes by mixing organic solvents and Li salts. Organic solvents are anhydrous; hence, remove traces of water residue with activated molecular sieves overnight. Dry salts at 70 oC overnight prior to use in the glovebox.
- Place a negative case on the Li metal anode, followed by crimping the coin cell at 1.1 ton. Remove the fabricated coin cells from the glove box. Apply the fabricated cells to a current density of 0.5 mA/cm2 to a capacity of 1 mAh/cm2 to electrochemically deposit lithium on the copper foil.
NOTE: Deposition begins only after sufficient electrolyte wetting, which typically requires ~12 h after cell assembly.
2. TEM sample preparation (on-grid method)
NOTE: TEM samples are prepared in two pathways. One is through cryo-FIB liftout, and the other is a step without the use of cryo-FIB. We discuss the step without the FIB process. Follow the other step when the cryo-FIB procedure is needed.
- After the deposition of Li, open Li coin cells using decrimping tools inside a glovebox. On copper foils, Li metal deposits are visible on TEM grids; remove the TEM grids.
- Take out the TEM grids by removing the separator, followed by rinsing. Use appropriate solvents during the rinsing steps. For example, for carbonate electrolytes, use dimethyl carbonate (DMC) or diethyl carbonate (DEC); use dimethoxymethane (DME) for ether electrolytes.
- Drop appropriate solvents onto the TEM grids and wick around the edge with laboratory wipes to remove solvents; do this multiple times to remove residual solvents. Lastly, dip the grids into a small centrifuge tube (~1 mL) with the appropriate solvents to remove the trace-level salt residues. Place the grids in an argon-filled antechamber and dry them under vacuum for 5-15 min.
- Place the grids in cryo-TEM grid boxes.
NOTE: Grid box compartments can react with battery solvents, so make sure the solvents are completely removed during the vacuum drying procedure. - Close the grid boxes with pin-type lids. Put the grid boxes into a press-to-close bag.
NOTE: These bags should not contain any water residue prior to use. Before the bags are used, they must be dried under vacuum for at least overnight. - Remove the bags through the antechamber and immediately put them into a long-neck liquid nitrogen flask. While the grid boxes are under the liquid nitrogen, cut the bags in half to release the boxes to the liquid nitrogen.
NOTE: This series of steps ensures that air exposure is minimized. Wear safety glasses with side shields or goggles, cotton gloves under disposable nitrile gloves, and use insulated tongs/ tweezers to manipulate specimens. Wear thick cryogenic gloves when carrying around the samples inside the dewar between rooms. - Use long tweezers to handle the grid boxes and place grid boxes into a 50 mL conical tube before cryo-STEM characterization.
NOTE: The samples can be stored in a large liquid nitrogen reservoir for several weeks or months. We did not observe any particular sample degradation during liquid nitrogen storage; however, it is ideal to examine samples as soon as possible.
3. TEM sample preparation (cryo-FIB/SEM method)
NOTE: This workflow preserves liquid electrolytes in the sample and achieves electron transparency regardless of initial sample thickness.
- After Li deposition, open coin cells using decrimping tools. Remove the Li-deposited copper foil from coin cells and place it onto a FIB-SEM stub.
NOTE: Mechanical clips attached to the stub hold the sample securely. This prevents losing samples when carbon tapes are no longer sticky at cold temperatures. - Put the stub into a press-to-close bag and remove the bag through the glovebox antechamber.
NOTE: Importantly, battery electrolytes are volatile, and the whole preparation step should be performed quickly (within a few minutes) before quenching. - Quench the argon-filled bag into liquid nitrogen and release it by cutting the bag in half. Carefully handle the SEM stub as samples become brittle after quenching. Place them in a 50 mL conical tube before FIB/SEM sessions.
NOTE: Wear appropriate personal protective equipment (cotton gloves and safety goggles). - Move the cold samples through vacuum transfer system to the cryo-FIB/SEM stage. Use a lidded cryo-FIB/SEM shuttle to minimize ice deposition.
NOTE: Any residual humid air and water molecules are deposited on the cold lid, preventing frost contamination to the sample. We also used a shuttle without the lid for comparison (Figure 1). - Deposit approximately 3 µm of organometallic platinum, use 30 keV with Xe ion plasma source, and use 100 pA of ion beam scanning for curing while deposition occurs. Every 30 seconds, pause the deposition and scan the cured regions at the lowest magnification at 10 nA to create the smooth Pt mask. Deposit platinum for 5 min to generate the desired thickness.
- Use 30 and 10 nA to trench lift-out regions. Decrease currents from 5 nA and 1 nA progressively when creating lamella. Thin the lamella until its thickness reaches 1 µm
- Lift-out the lamella using redeposition materials to weld the cold nanomanipulator. Attach the lamella to a Cu half grid.
- Thin the lamella from both sides at 300 pA at 1.5° of over-tilt from the ion beam angle. Decrease currents to 50 pA for further thinning. Use 20 pA of 5 kV for final thinning.
- Transfer the thinned lamella to the liquid nitrogen working station.
NOTE: For detailed information on the cryo-FIB thinning method, refer to the references8,10,16,17,18 to perform the on-grid TEM preparation or cryo-lift-out to prepare electron-transparent samples. Cryogenic lift-out methodology was discussed using a redeposition method19 or cryogenic gripper20, followed by welding to a commercial TEM half grid. The half grid should be assembled with a slot grid for facile manipulation with liquid nitrogen2,6. - Dispose of the used Li metal deposition or save it under liquid nitrogen for future use. Place the Li metal deposition in a beaker inside a fume hood. Use long tweezers to handle.
NOTE: The electrolytes are volatile. When removing samples from liquid nitrogen for disposal, immediately place them into a closed container before transferring them to a fume hood. Once inside the hood, open the container and transfer the contents into a beaker. Allow the lithium metal sample to react slowly with air before final disposal.
4. Beam alignments
- Some microscopes do not offer free-lens control systems; in such cases, SEND characterization is not feasible. Change the condenser lenses 2 and 3 to achieve 2 mrad of semiconvergence angle. Use a single crystal such as Si lamella to acquire the desired angle. Control the diffraction focus (first intermediate lens) if the electron patterns are not well focused on the detector.
- Use STEM mode at 200 keV to locate the sample, especially at low magnification (i.e., 10k), while trying not to damage the sample with the electron beam. Adjust Z height to approach eucentric focus.
NOTE: Before using SEND, it is necessary to align the beam to obtain the desired convergence semi-angles. - Adjust the convergence angle by controlling CL3 (condenser lens) or mini lens. Upon the adjustment of the angle, use a vacuum area to focus the probe in a probe imaging mode by controlling the objective focus. Use the tilt-correction controls to compensate for beam tilt, which minimizes descan and keeps the diffraction pattern centered during scanning.
- In a diffraction mode, change the diffraction focus to minimize Fresnel fringes in the center beam. Move to nanocrystalline regions (such as Pt deposition). Adjust objective/diffraction stigmation on the polycrystalline diffraction ring. Confirm that the diffraction rings are circular and the Fresnel fringes are uniform throughout the center beam when changing the diffraction focus.
- Save these free lens alignment settings on the TEM software.
NOTE: This may be reused in the next sessions, but it needs to be readjusted from one session to another. - In the last step, adjust the condenser lens stigmation while imaging the samples.
NOTE: It is not ideal to change the objective focus at this step; the sample height can be changed for further focus. - Measure beam current to estimate electron dose with different spot sizes.
NOTE: We use a direct electron detector to measure beam current. Refer to the camera company manual to measure the beam current. In STEM mode, you will measure how many electrons hit the detector at a particular pixel time. This will be important when you rigorously limit the total accumulated electron dose. - Remeasure convergence semi-angles by using single crystals.
NOTE: Consequently, we need vacuum regions, nanocrystals, and single crystals to align the beam setup. It is noteworthy that the real-space calibration for STEM changes after the beam is aligned, especially when the objective lens focus is changed. As such, we do not recommend adjusting the objective lens when creating different illumination settings for this reason. - Recalibrate real-space resolution by referring to TEM manuals. In addition, calibrate the camera length to locate the scattering vectors in diffraction space.
- Use single crystals or nanocrystals to measure diffraction camera calibration. Remember to recalibrate the real-space resolution in STEM detectors at each alignment.
- Record diffraction camera length calibration at each camera length. If different diffraction focus settings are used on different alignments, save the calibration data and reuse them for data processing.
NOTE: Everything is ready for the following characterization.
5. Characterization of battery interphases/interfaces through Cryo-SEND
- Prepare liquid nitrogen in a nitrogen flask. Remove the cryogenic box containing the cryo-STEM samples and pour it into the nitrogen flask. Follow the typical experimental steps to handle cryo-TEM samples through the workflows for biological samples.
- Put the grid box into the liquid nitrogen in a cryo-TEM working station. Ensure that this working station is filled with liquid nitrogen before placing the grid box. After opening the pin-type lid, hold a TEM grid and gently place it into the tip of the cryo-TEM holder. Confirm that the holder temperature readout is below -160 oC when loading.
- Close the shutter and immediately insert the holder into a TEM goniometer. Follow the manufacturer's instructions when inserting cryo-TEM side-entry holders. Ensure that the O-rings of TEM holders are not frozen during holder preparation in the working station. Warm up the O-ring while the holder is pumped for 10 min in the goniometer.
NOTE: Always remove the shutter (anticontaminator) when the vacuum level is stabilized below 2 × 10⁻⁵ Pa and refer to the instrument manual.
- Locate the sample at low magnification. Select a region of interest such as an SEI layer. Draw a region of interest and collect the nanobeam diffraction. Adjust pixel time and step size to limit the total accumulated dose.
NOTE: We found that 100-300 e-/Å2 is sufficient to resolve features in the SEIs. However, users may explore the critical dose for the systems used. We use 13 ms of pixel time and 4 nm of step size. Depending on the camera/electron detector ability, decide whether a beam stopper should be used. For our experiment, we do not use a beam stopper either on a direct electron detector or a Scintillator-based camera.- Make note of the visual points of a successful point:
- Ensure that the lamella is sufficiently thin such that all the components are clearly distinguishable; for example, lithium appears very dark in the dark-field STEM mode, while SEI exhibits the brightest contrast. Confirm that SEI surrounds the Li metal plating and is sandwiched by vitrified electrolytes and Li metal.
- Confirm that the vitrified electrolyte is free of substantial pores and is continuous. The presence of pores indicates that the beam current for imaging was too high. Use low magnification to avoid beam damage while navigating the sample.
- Make note of the visual points of a successful point:
- While the center beam position is adjusted, do not park the beam on the region of interest. Use a vacuum area to align the transmitted beam at the center.
NOTE: To reduce any artifacts from the camera, perform gain and dark reference. Refer to the camera manual. - Remove the HAADF detector to acquire diffraction patterns at high angles.
NOTE: This may not be necessary if a short camera length is used. - Optimize the camera resolution, data storage/transfer, and total acquisition time based on experimental needs. Perform software or hardware binning for the data using the TEM software.
NOTE: Camera resolution can vary between 128 and 2,048. Post binning is possible with the data analysis tools. If you use too high a resolution, the total scanning time is too long. You may see drifts during data collection. - For detailed information on the data acquisition used to obtain the results, use 10 µm of a probing forming aperture and probe size 7 at 250 mm of camera length. Set 13 ms of pixel of pixel time and 4 nm of step size. The camera pixel resolution is 512.
NOTE: The probe current is 3.5 pA and the measurement results in approximately 80 e-/Å2 of electron dose. A successful indicator at this stage is that diffraction patterns from Li exhibits clear reflections corresponding to 110 or 200 patterns without showing ice diffraction patterns. In addition, the SEI should display amorphous diffraction features rather than crystalline peaks. The presence of crystalline features indicates that the SEI has undergone radiolysis during acquisition. In this case, move to a different SEI region and reduce the electron dose by at least half. Continue decreasing the dose until the diffraction patterns no longer show nanocrystalline features. - After collecting, use a shutter or blank the beam to avoid beam damage when rastering over the region multiple times.
- After the 4D STEM acquisition, acquire a STEM image to observe any noticeable change in the image prior to the measurement.
NOTE: Typically, bubble formation and mass loss can be observed when using excessive electron dose. In this case, use a lower electron dose by changing the probe current, step size, or pixel time.
6. Observation of structural damage in SEIs using electron energy loss spectroscopy (EELS)
- Form 11 pA of a probe current by using spot size 9 and 30 mm of aperture for EELS measurements.
- Use 2 cm of a camera length, which corresponds to 83.3 mrad of semi-collection angle.
- For Li-K edge EELS and O-K edge EELS, use 0.5 ms and 10 ms of pixel time, respectively.
- Set step size of 6 nm and 8 nm for Li-K and O-K edge EELS.
- Repeat the measurement to track changes in the spectrum.
7. Sample retrieval
- Close the anticontaminator of the cryo-TEM holder. Fill the holder workstation with liquid nitrogen again. Before filling it, ensure the working station is free of water condensation. Use a heat gun or hair dryer to remove residual water.
NOTE: Do not blow off right in front of the working station as they can melt by heat. Use mild temperature to remove water. - Remove the holder from the goniometer and immediately put it into the working station. Open the anticontaminator and recollect the sample into a cryogenic grid box. Store the grid box in a large liquid nitrogen drawer.
NOTE: Depending on the TEM room humidity, be aware that you have frost contamination on the samples during this step.
8. Data processing
NOTE: Data are stored in proprietary formats. Use the open-access software Py4DSTEM21 or PyXem22 (Hyperspy-based python environment) to open the 4DSTEM data formats.
- On the software, correct the descan and objective stigmation. This will correct the center beam positions in each real space (X,Y) and correct the ellipticity in reciprocal space (Kx, Ky).
NOTE: Use the software tutorials to learn how to carry out basic data processing. - After the basic preprocessing, acquire diffraction patterns from regions of interest and transform the 2D data into 1D data. Diffraction intensity signal will be obtained in scattering vector space (reciprocal space). Use background subtraction methods to enhance the signal. If required, multiply intensity by scattering vector (Q) to increase signal-to-noise ratio, or use scattering vector square (Q2).
NOTE: Each pixel can yield diffraction signals. - Bin real space data to enhance the diffraction signal: bin the detector pixels to reduce the data processing time (depending on the workstation's computing capability).
NOTE: Exact command syntax and user interfaces may vary depending on software version and execution environment (script-based or notebook-based). Refer to the official Py4DSTEM and PyXem documentation and tutorials for version-specific implementation details.
Results
Figure 1 shows examples of good and poor sample preparations for cryo-SEND experiments. When preparing battery samples by cryogenic FIB/SEM, avoiding frost contamination is essential to achieve sufficient electron transparency without introducing artifacts. After lamellae are created in the cryo-FIB/SEM stage, the samples are moved to ambient environments. The lamellae are highly vulnerable to ice formation until it is fully submerged in liquid nitrogen. To mitigate this issue, we developed a cryogenic FIB/SEM shuttle with a cover attachment to prevent ice contamination.
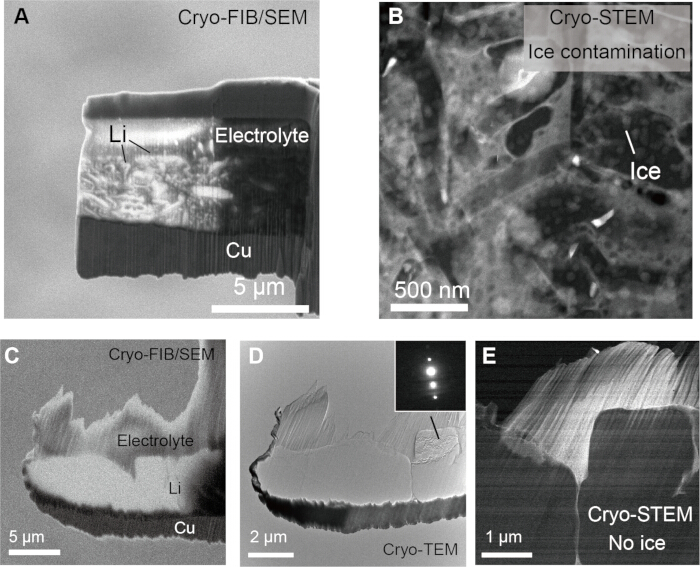
Figure 1: Good and poor examples for cryo-SEND preparations. (A) SEM image of a cryo-liftout of the Li metal deposits formed in a conventional carbonate electrolyte (1 M LiPF6 in ethylene carbonate/DMC (1:1 v/v ratio). (B) Cryo-SEM image of the same lamella after the transfer from the cryo-FIB/SEM stage. The lamella is severely contaminated with heavy frost. (C) Another cryo-liftout from the Li metal depositions formed in a high-concentration ether electrolyte (4 M LiFSI in DME). (D) Cryo-TEM image of the lamella after the transfer through the shuttle attached with a cover. No ice contamination was visible after the transfer. The 110 reflection of Li is clearly visible, and no diffraction from ice was observed. (E) A magnified STEM image with a well-preserved feature of battery morphology, suitable for further cryo-SEND experiments. Abbreviations: SEND = scanning electron nanobeam diffraction; DMC = dimethyl carbonate; DME = dimethoxyethane. Please click here to view a larger version of this figure.
Figure 1A,B illustrate a case where ice contamination is severe, and subsequent analysis is heavily impaired by the presence of ice layers. Although little ice is observed at the time of milling in the FIB/SEM chamber, heavy frost layers were deposited on the lamella after the sample transfer in the TEM column, as demonstrated in the HAADF-STEM image. In this case, the transfer procedure was performed using a standard SEM stub without a protective cover. When the shuttle equipped with the anticontaminator cover is used, the ice contamination level was markedly reduced, as demonstrated in Figure 1C-E. In detail, a lift-out lamella was prepared in the cryo-FIB/SEM stage (Figure 1C) and transferred back into liquid nitrogen. During this step, when the vacuum was released, the protective cover prevented exposure to ambient moisture, keeping the sample ice-free. Figure 1D shows a clean lift-out lamella with the diffraction shown in the inset, displaying a 110 reflection of Li. This indicates the absence of signatures for hexagonal close-packed (HCP) or cubic ice phases. Although the contrast of ice is more noticeable in STEM mode, the lamella was entirely free of ice in Figure 1E.
While this new SEM/FIB shuttle substantially prevents frost contamination, it is still possible that residual large ice crystals suspended in liquid nitrogen can adhere to lamellae during handling. This cannot be fully eliminated in cryo-EM workflows. However, it can be minimized by handling samples in a dry room (10-15% humidity) and using clean liquid nitrogen that has not been exposed to air for more than 20 min. One may consider removing ice with electron irradiation. However, the battery electrolytes and SEIs are as beam-sensitive as ice, and such an attempt is likely to damage the structures prior to subsequent characterization. The on-grid method has been routinely carried out in multiple studies3,15,17, with minimal frost contamination. This is because it does not require additional sample preparation steps from cryo-FIB/SEM to a TEM column. However, frost formation and large ice crystal attachment can still be problematic in the workflow if experiments are not carefully controlled. As the method inherently creates many regions of interest, ice contamination is less problematic overall.
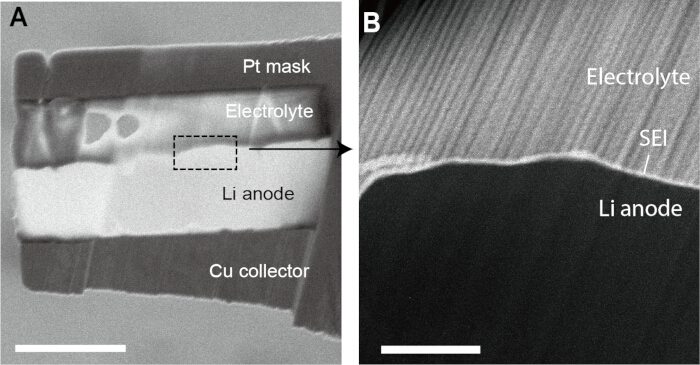
Figure 2: SEM images of the Li metal grains, vitrified electrolytes, and SEI. (A) Cryo-lift-out lamella of electrochemically deposited lithium metal from an ether electrolyte (a mixture of 4.6 M LiFSI and 2.3 M LiTFSI in DME). Large Li grains were shown, showing that the electrolyte and the resultant SEI played a key role in the creation of dense Li grains. (B) SEI at the interface between the Li metal deposition and the electrolyte imaged by high-angle annular dark-field STEM (HAADF-STEM) image. The generated lamella was thin enough (~100 nm) to resolve all the features of Li metal grains, electrolytes, and SEIs. The magnified STEM image shows that the vitrified electrolytes exhibited few bubbles, which represents an ideal condition for continuous SEND acquisition. Otherwise, the electrolytes released gas bubbles. Scale bars = 5 µm (A), 1 µm (B). The figures were adapted with permission from Ref.9. Copyright 2025 American Chemical Society. Abbreviations: LiFSI = (Lithium bis(fluorosulfonyl)imide) LiTFSI = Lithiumbis(trifluoromethanesulfonyl)imide, DME = Dimethoxyethane, SEI = solid-electrolyte interphase, SEND = scanning electron nanobeam diffraction Please click here to view a larger version of this figure.
Figure 2A shows an SEM image of the battery components from an electron-transparent cryo-lift-out lamella. A vitrified electrolyte was well preserved, and a corresponding HAADF-STEM in Figure 2B reveals a 40 nm-thick battery interface layer between the Li metal deposition and the vitrified electrolyte, where cryo-SEND experiments will be performed. Again, the lamella is free of ice, allowing us to maximize the number of usable regions for structural characterization. The presence of the SEI layer between the electrolyte and the Li metal grains indicates that the sample preparation protocol was successful.
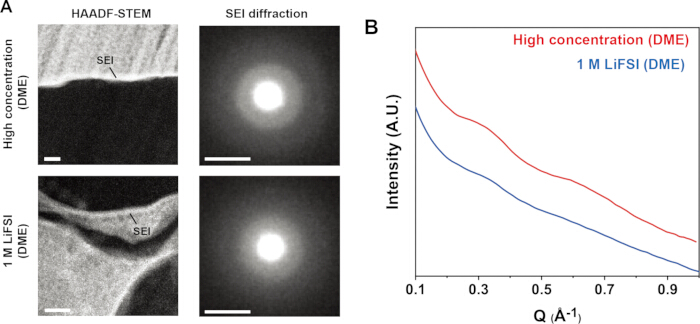
Figure 3: Diffraction analysis of the SEIs formed in the two battery electrolytes. The high concentration in the figure refers to the mixture of 4.6 M LiFSI and 2.3 M LiTFSI in DME. (A) HAADF-STEM images from the Li metal depositions formed in each electrolyte (left) and the diffraction patterns of the SEI from their corresponding electrolytes. (B) Diffraction profiles from the SEI reveal that SEIs are structurally distinct. Scale bars in A are 100 nm for the STEM images and 5 nm-1 for the diffraction patterns, respectively. The structures of SEIs are identified as amorphous, which is the key result of the careful dose selection described in the protocol. In addition, the lamella without ice provided diffraction patterns free from frost-related diffraction, allowing us to isolate the diffraction patterns of the SEIs. The figures were adapted with permission from Ref.10. Copyright 2025 American Chemical Society. Abbreviations: LiFSI = (Lithium bis(fluorosulfonyl)imide) LiTFSI = Lithiumbis(trifluoromethanesulfonyl)imide, SEI = solid-electrolyte interphase, HAADF-STEM = high-angle annular dark-field scanning transmission electron microscopy. Please click here to view a larger version of this figure.
Figure 3A compares the structure of SEIs formed in a low-concentration ether electrolyte (1 M LiFSI in dimethoxyethane (DME)) and a high-concentration ether electrolyte (4.6 M LiFSI and 2.3 M LiTFSI in DME). After cryo-SEND at a controlled electron dose, the structures appear amorphous, as indicated by the isotropic features in the SEIs. Within the ~1 nm probe-size resolution, the amorphous features are smaller than the length scale of the probe, resulting in the isotropic amorphous features. The SEI structures are distinct: the SEI from the mild-concentration electrolyte did not show a detectable structural correlation, whereas the SEI from the high-concentration electrolyte exhibits short-range order. The short-range order exhibits two characteristic bond features, with maxima at approximately 0.3 and 0.65 Å-1, as shown in Figure 3B. This indicates that SEIs from the two distinct electrolyte systems form structurally distinct SEIs, which may influence their mechanical and chemical properties. These conclusions are based on diffraction measurements acquired from multiple regions (typically 10-20 regions) within the same lamella, and were reproduced across at least two independently prepared lamellae for each electrolyte system. The corresponding diffraction mapping associated with these measurements is reported in Ref.10.
Furthermore, rigorous regulation of accumulated dose is essential to improve the data reliability and obtain the chemical and structural information in native states (Figure 4). We found that the native structures of SEIs can be severely damaged by excessive beam dose. For example, when the dose is limited to ~500 e-/Å2, the SEI structure formed in the high-concentration electrolyte remained amorphous, but began to crystallize when the accumulated dose exceeded the threshold. The EELS spectra in Figure 4A,B show the progressive formation of Li2O with electron dose. Repetitive SEND measurements confirm that the beam exposure drives SEIs to form Li2O (Figure 4C). The critical electron dose for different electrolytes was studied using selected-area electron diffraction9. The high-concentration ether-based electrolyte shows nanocrystal nucleation at doses above 500 e-/Å2. In contrast, the critical dose for 1 M-concentrated electrolytes was approximately 1000 e-/Å2.
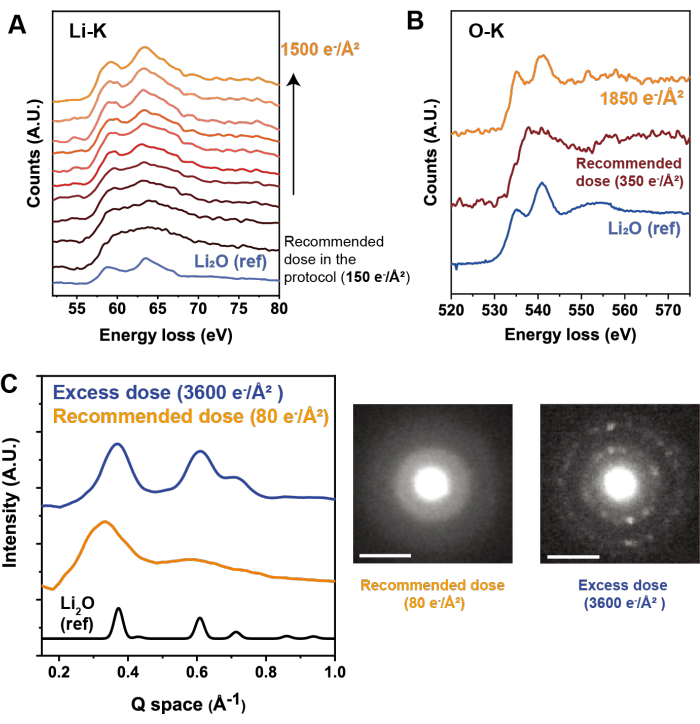
Figure 4: Beam damage study of SEIs. (A) Li K-edge and (B) O-K edge of the SEIs from the high concentration electrolytes with electron dose. (C) Diffraction profiles of the SEI before and after the excessive electron dose. The native SEIs are free of Li2O with broad spectra in both Li and O K-edge, but they can easily form Li2O nanocrystals when excessive doses above the threshold are used. Therefore, the use of the recommended dose is important. Otherwise, the SEIs are readily damaged, leading to structural change. The figures were adapted with permission from Ref.9,10. Copyright 2025 American Chemical Society. Please click here to view a larger version of this figure.
Discussion
There are two critical steps in successfully carrying out these experiments. The first is to avoid frost and ice formation on the TEM samples. As discussed above, SEIs are beam-sensitive and prone to structural changes under excessive electron-beam irradiation. Ice can be removed with electron beam irradiation, but doing so may require a large electron dose, especially for a thick layer of ice, as in Figure 1B. Once ice forms, the remaining allowable electron dose before sample damage is quickly consumed during the SEND and EELS measurements. In unfortunate cases, the structures can be completely damaged before actual measurements begin. Therefore, minimizing frost and preventing the formation of large ice crystals are essential. Using our newly designed cryo-FIB/SEM shuttle, we demonstrate ice-free transfer between cryo-FIB/SEM and cryo-TEM.
The second critical step is controlling the electron beam dose. SEND is well-suited for controlling electron dose, which is not possible in high-resolution TEM techniques. By controlling convergence angles and step sizes, precise control of the electron dose is possible. Unlike TEM workflows, it does not require repeated focus/defocus adjustments or high-dose navigation of samples, both of which can expose samples to high accumulated dose, especially at high magnification. Furthermore, high-resolution TEM imaging requires atomic-scale stability. Otherwise, image quality degrades. As such, achieving good-quality images often requires taking multiple exposures, which increases the accumulated electron dose9. However, these scenarios are not well-suited for beam-sensitive SEIs. On the other hand, SEND allows all acquisitions to be performed at low magnification, with only the desired electron dose passing through the region of interest. At the end of the Discussion, we listed a troubleshooting subsection.
A limitation of SEND for SEI characterization is its spatial resolution, which is typically limited to a range of sub-nanometers to a few nanometers. This is because of the trade-off between real-space resolution and reciprocal-space signal-to-noise ratio. Increasing the convergence semi-angle reduces diffraction intensity, which is acceptable for crystalline materials, where diffraction signals are inherently strong and sometimes further enhanced by channeling effects23. However, for amorphous materials like SEIs, the convergence semi-angle must remain small enough to maintain sufficient diffraction intensity while still achieving sub-nanometer probe sizes. In our experiments, we optimized the convergence semi-angle to 2 mrad with a probe size of 1 nm.
In practice, the step size cannot be as small as the probe size. When beam damage is taken into account, the actual step size should be around a few nm, and a smaller step size exceeds the critical dose because the SEIs are destroyed. As a result, the lower spatial resolution of SEND relative to HRTEM may limit our ability to resolve nanoscale features since some SEI layers are 1-10 nm thick. The challenge becomes even greater when electrodes and vitrified electrolytes overlap in projection, making it difficult to resolve SEIs sandwiched between them. Non-uniform electrode thickness can also complicate 3D-to-2D projection during analysis. Accordingly, several challenges and methodological trade-offs must be carefully considered to optimize SEND characterization of SEIs.
Although we demonstrated this technique primarily on SEIs formed in liquid electrolytes, this approach is also applicable to interfaces between solid electrodes and solid electrolytes. Preserving the native state at these interfaces is difficult as they can be easily deformed and damaged during disassembly, and the substantial thickness of solid electrolytes makes cross-sectioning with ion beam milling difficult. Nevertheless, optimized FIB strategies may enable access to these interfaces. For example, by milling from the current collector side and precisely controlling the Li deposition thickness, it may be feasible to prepare ~20 µm-deep lamellae suitable for cryo-SEND experiments.
Troubleshooting and practical guidance
Frost or ice contamination
Frost contamination during cryogenic transfer is a common failure mode and may appear as speckles of ice particles in STEM-HAADF images. In TEM images, ice is often not readily visible, but underfocus or overfocus can make it more apparent. The presence of diffraction patterns from hexagonal or cubic ice crystals also indicates contamination and can overlap with signals from SEIs, potentially compromising structural interpretation.
When severe ice is present, one mitigation strategy is to use a parallel electron beam at ~10 e⁻/Å2·s to remove the ice particles. While this can introduce damage to beam-sensitive regions, it may still enable collection of usable diffraction data and serve as a reference for assessing SEI beam tolerance. Preventive strategies include improving cryo-transfer conditions by minimizing ambient exposure time, ensuring the shuttle is sufficiently cold, and using a dry room or dehumidified environment. A lidded cryo-FIB/SEM shuttle is highly recommended. It is also important to note that hexagonal and nanocrystalline ice typically form due to inadequate transfer control, whereas large cubic ice crystals are often introduced by impure liquid nitrogen. Therefore, clean liquid nitrogen should always be used when in contact with lamellae.
Beam-induced damage
Structural degradation from electron beam exposure is another significant concern. Indicators of beam damage include progressive changes in diffraction features, such as a shift from amorphous to crystalline structures, particularly the formation of Li₂O. These changes may become irreversible after repeated scans. EELS data may also exhibit progressive spectral shifts, and in severe cases, vitrified electrolytes can produce gas bubbles when rastered at high magnification.
To reduce the risk of beam damage, users should lower the pixel time to decrease total accumulated dose. Additional mitigation strategies include reducing dwell time, increasing step size, and using low magnification when selecting imaging parameters and defining regions of interest. These adjustments help preserve native SEI structure during data acquisition.
Disclosures
The authors declare no competing financial interest. One co-author is an employee of Leica Microsystems. Leica Microsystems did not influence the study design, data collection, analysis, or interpretation.
Acknowledgements
H.J.K. acknowledges support from the Center for Functional Nanomaterials (CFN), which is a U.S. Department of Energy Office of Science User Facility, at Brookhaven National Laboratory under Contract No. DE-SC0012704. The work was partly supported from the National Science Foundation (NSF), Division of Materials Research (DMR), Future Manufacturing Research Grant #2134715. This work was performed in part at the Singh Center for Nanotechnology at the University of Pennsylvania, a member of the National Nanotechnology Coordinated Infrastructure (NNCI) network, which is supported by the National Science Foundation (Grant NNCI-2025608). Additional support for the Nanoscale Characterization Facility at the Singh Center is provided by the NSF through the University of Pennsylvania Materials Research Science and Engineering Center (MRSEC) (DMR-2309043). H.J.K and E.A.S acknowledge the technical support of Saskia Mimietz-Oeckler from Leica Microsystems.
Materials
| Name | Company | Catalog Number | Comments |
|---|---|---|---|
| Conical tubes | Eppendorf | 339652 | |
| Cryo FIB Stage, and associated transfer equipment and tools | Leica Microsystems | ||
| DEC (Diethyl carbonate) | Sigma Aldrich | D91551 | |
| Direct electron detector | Gatan Metro | ||
| DME (Dimethoxyethane) | 259527 | Sigma Aldrich | |
| EC (Ethylene carbonate) | Sigma Aldrich | E26258 | |
| Kim wipes | laboratory wipes | ||
| Li metal chip | Xiamen TOB New Energy Technology Co. | ||
| LiFSI (Li bis(fluorosulfonyl)imide) | American Elements | LI-FSI-03-P | |
| LiPF6 (lithium hexafluorophosphate) | 013950 | Oakwood | |
| LiTFSI (Lithium bis(trifluoromethanesulfonyl)imide) | Sigma Aldrich | 919977 | |
| Mesh TEM grid | Pelco | 1GC200 | |
| Microscope | JEOL | F200 | |
| Poly propylene separators | Celgard | 3501 | |
| Scintillator based detector | Gatan Oneview |
References
- Lin, D., Liu, Y., Cui, Y. Reviving the lithium metal anode for high-energy batteries. Nat Nanotechnol. 12 (3), 194-206 (2017).
- Goodenough, J. B., Kim, Y. Challenges for rechargeable Li batteries. Chem Mater. 22 (3), 587-603 (2010).
- Li, Y., et al. Unravelling degradation mechanisms and atomic structure of organic-inorganic halide perovskites by cryo-EM. Joule. 3 (11), 2854-2866 (2019).
- Fearne, S. An introduction to time-of-flight secondary ion mass spectrometry (ToF-SIMS) and its application to materials science. , IOP Publishing. (2015).
- Ma, C., Xu, F., Song, T. Dual-layered interfacial evolution of lithium metal anode: SEI analysis via TOF-SIMS technology. ACS Appl Mater Interfaces. 14 (17), 20197-20207 (2022).
- Huang, W., Wang, H., Boyle, D. T., Li, Y., Cui, Y. Resolving nanoscopic and mesoscopic heterogeneity of fluorinated species in battery solid-electrolyte interphases by cryogenic electron microscopy. ACS Energy Lett. 5 (4), 1128-1135 (2020).
- Gao, A., et al. LiF artifacts in XPS analysis of the SEI for lithium metal batteries. ACS Appl Mater Interfaces. 17 (5), 8513-8525 (2025).
- Zachman, M. J., Tu, Z., Choudhury, S., Archer, L. A., Kourkoutis, L. F. Cryo-STEM mapping of solid-liquid interfaces and dendrites in lithium-metal batteries. Nature. 560 (7718), 345-349 (2018).
- Koh, H., Das, S., Zhang, Y., Detsi, E., Stach, E. A. Electron beam-induced artifacts in SEI characterization: Evidence from controlled-dose diffraction studies. ACS Energy Lett. 10, 534-540 (2025).
- Koh, H., Detsi, E., Stach, E. A. Observation of order and disorder in solid-electrolyte interphases of lithium-metal anodes. ACS Energy Lett. 10 (9), 4361-4368 (2025).
- Zuo, J. -M., Tao, J. Scanning electron nanodiffraction and diffraction imaging. Scanning Transmission Electron Microscopy: Imaging and Analysis. , 393-427 (2011).
- Bustillo, K. C., et al. 4D-STEM of beam-sensitive materials. Acc Chem Res. 54 (11), 2543-2551 (2021).
- Voyles, P. M., Muller, D. A. Fluctuation microscopy in the STEM. Ultramicroscopy. 93 (2), 147-159 (2002).
- Yousaf, M., et al. Visualization of battery materials and their interfaces/interphases using cryogenic electron microscopy. Mater Today. 58, 238-274 (2022).
- Wang, X., Li, Y., Meng, Y. S. Cryogenic electron microscopy for characterizing and diagnosing batteries. Joule. 2 (11), 2225-2234 (2018).
- Zachman, M. J., Asenath-Smith, E., Estroff, L. A., Kourkoutis, L. F. Site-specific preparation of intact solid-liquid interfaces by label-free in situ localization and cryo-focused ion beam lift-out. Microsc Microanal. 22 (6), 1338-1349 (2016).
- Koh, H., Detsi, E., Stach, E. A. Understanding ion-beam damage to air-sensitive lithium metal with cryogenic electron and ion microscopy. Microsc Microanal. 29 (4), 1350-1356 (2023).
- Creekmore, B. C., Kixmoeller, K., Black, B. E., Lee, E. B., Chang, Y. -W. Ultrastructure of human brain tissue vitrified from autopsy revealed by cryo-ET with cryo-plasma FIB milling. Nat Commun. 15 (1), 2660(2024).
- Parmenter, C. D., Nizamudeen, Z. A. Cryo-FIB-lift-out: Practically impossible to practical reality. J Microsc. 281 (2), 157-174 (2021).
- Schaffer, M., et al. A cryo-FIB lift-out technique enables molecular-resolution cryo-ET within native Caenorhabditis elegans tissue. Nat Methods. 16 (8), 757-762 (2019).
- Savitzky, B. H., et al. py4DSTEM: A software package for four-dimensional scanning transmission electron microscopy data analysis. Microsc Microanal. 27 (4), 712-743 (2021).
- Cautaerts, N., et al. flexible and fast: Orientation mapping using the multi-core and GPU-accelerated template matching capabilities in the Python-based open source 4D-STEM analysis toolbox Pyxem. Ultramicroscopy. 237, 113517(2022).
- Kourkoutis, L. F., Parker, M. K., Vaithyanathan, V., Schlom, D. G., Muller, D. A. Direct measurement of electron channeling in a crystal using scanning transmission electron microscopy. Phys Rev B. 84 (7), 075485(2011).
Reprints and Permissions
