This protocol describes the use of ultra-high-performance liquid chromatography coupled with hybrid quadrupole-Orbitrap high-resolution mass spectrometry (UHPLC-Q-Orbitrap HRMS), combined with network pharmacology and molecular docking, to predict and validate the material basis of Yiqi Qingjie formula (YQQJ) for the treatment of IgA nephropathy (IgAN).
Method Article
Elucidation of the Material Basis of Yiqi Qingjie Formula Against IgA Nephropathy Using UHPLC-Q-Orbitrap HRMS Integrated with Network Pharmacology
In This Article
Summary
Abstract
This study employs UHPLC-Q-Orbitrap HRMS to characterize the water-extractable and blood-absorbed constituents of YQQJ. Network pharmacology and molecular docking are further applied to predict and verify the material basis underlying the therapeutic effects of YQQJ against IgAN. The aqueous extract and serum samples of YQQJ were analyzed using UHPLC-Q-Orbitrap HRMS to characterize the chemical constituents and identify blood-absorbed compounds. Compound identification was performed based on reference databases, published literature, and a comprehensive evaluation of retention time, precursor ion mass accuracy, MS/MS fragmentation patterns, and isotopic distribution. Potential targets of the prototype blood-absorbed compounds were predicted using target prediction databases, while IgAN-related targets were collected from integrated bioinformatics platforms. Core targets were screened through PPI network analysis. A “compound–target–pathway–disease” network was constructed to identify key constituents, and molecular docking was performed to evaluate the interactions between core compounds and targets. A total of 185 compounds were identified in the water extract of YQQJ. Among them, 28 compounds entered the bloodstream in their prototype forms. PPI identified 42 core targets associated with YQQJ's therapeutic effects in IgAN. KEGG and GO enrichment analyses showed involvement in cell proliferation, inflammation, and apoptosis, and enrichment in several key pathways such as PI3K-Akt, MAPK, and JAK-STAT. Molecular docking analysis predicted favorable binding interactions between six critical targets (CASP3, IGF1R, JUN, STAT3, PRKCB, and PIK3CA) and three major blood-absorbed compounds—Deacetylasperulosidic acid, Geniposidic acid, and Dioscin —with consistently low binding energies, suggesting potential interactions. This integrated analysis reveals that YQQJ exerts therapeutic effects against IgAN through multiple components and multiple targets. Deacetylasperulosidic acid, Geniposidic acid, and Dioscin are suggested as key active constituents contributing to these effects.
Introduction
IgA nephropathy (IgAN) is one of the most common primary glomerulonephritis worldwide. Its clinical manifestations are highly heterogeneous, typically presented as microscopic or gross hematuria, often accompanied by varying degrees of proteinuria, hypertension, and renal impairment. Earlier studies suggested that up to 40% of patients progress to kidney failure within 20 years of diagnosis1; however, more recent evidence indicates a markedly poorer prognosis, with most patients developing kidney failure within 10–15 years, and only a small proportion maintaining lifelong kidney function without progression2,3,4. Although targeted therapies have recently achieved clinical advances in IgAN management, their high cost and relatively slow onset of efficacy remain major challenges, and the clinical benefit–risk balance remains under debate5,6.
Traditional Chinese medicine (TCM) demonstrates distinctive advantages in the treatment of complex diseases. It is characterized by stable therapeutic efficacy, relatively low incidence of adverse reactions, and multi-target synergistic effects7. Unlike single-target pharmacological agents, TCM formulas typically contain multiple bioactive components that can simultaneously modulate diverse biological pathways. This multi-component and multi-target mode of action provides a potential therapeutic advantage in the treatment of complex diseases such as IgAN8. In TCM theory, IgAN does not have a specific disease name but is generally classified under “hematuria,” “edema,” “back pain,” “kidney wind,” and “consumptive disease.” Most scholars consider its core pathogenesis to involve Lung-Spleen Qi Deficiency, leading to a loss of control over defensive Qi and, in turn, to the invasion of wind, dampness, heat, and toxins, ultimately damaging the kidneys. Although the kidney is the primary organ involved, the heart, liver, spleen, and lungs may also be affected9. Based on this understanding, numerous investigations have focused on identifying herbal medicines and formulas with Qi-tonifying, exterior-consolidating, heat-clearing, detoxifying, and dampness-resolving properties for the clinical treatment of IgAN10,11.
Yiqi Qingjie Formula (YQQJ) is an effective empirical prescription used in the Department of Nephrology at our hospital for the treatment of IgAN. The formula comprises seven herbs, including Astragalus membranaceus (Huangqi), Lonicera japonica Thunb. (Jinyinhua), Rheum palmatum L. (Dahuang), Hedyotis diffusa Willd. (Baihuasheshecao), Dioscorea nipponica Makino (Chuanshanlong), Spatholobus suberectus Dunn (Jixueteng), and Plantago asiatica L. (Cheqiancao). YQQJ exerts therapeutic functions of tonifying Qi, consolidating the exterior, clearing heat, detoxifying, activating blood circulation, and promoting diuresis12. Clinical studies have demonstrated that YQQJ significantly reduces proteinuria and hematuria in patients with IgAN, improves renal function, and alleviates mucosal immune–related symptoms, while exhibiting a favorable safety profile12,13.
Although this formula has demonstrated favorable clinical efficacy, the pharmacologically active material basis remains difficult to elucidate because TCM formulas contain numerous chemical constituents. Chemical profiling based solely on chromatographic or mass spectrometric analysis can reveal the overall chemical composition of a formula; however, it cannot determine which compounds are absorbed into systemic circulation and directly contribute to therapeutic effects14. In addition, conventional network pharmacology studies largely rely on database-based predictions and typically screen candidate compounds using parameters such as oral bioavailability and drug-likeness. This approach may overlook compounds that genuinely exert pharmacological activity in vivo15.
To address these limitations, recent studies increasingly adopt integrative analytical strategies that combine ultra-high-performance liquid chromatography coupled with hybrid quadrupole-Orbitrap high-resolution mass spectrometry (UHPLC-Q-Orbitrap HRMS) serum pharmacochemistry and systems pharmacology in TCM research16,17. Serum pharmacochemistry identifies compounds that enter systemic circulation after administration, thereby providing pharmacokinetically relevant evidence for screening potential bioactive constituents18. Meanwhile, UHPLC-Q-Orbitrap HRMS enables highly accurate detection and structural characterization of chemical constituents within complex herbal matrices19.
Compared with approaches relying solely on chemical profiling or theoretical target prediction, the integrative workflow applied in this study—comprising UHPLC-Q-Orbitrap HRMS–based component identification, serum pharmacochemistry screening, network pharmacology analysis, and molecular docking validation—offers several methodological advantages. UHPLC-Q-Orbitrap HRMS enables comprehensive and precise identification of complex chemical constituents. Serum pharmacochemistry restricts candidate compounds to those that are actually absorbed into systemic circulation, thereby improving the biological plausibility of subsequent network analyses. Network pharmacology analysis based on experimentally confirmed absorbed compounds allows system-level exploration of multi-target mechanisms and better reflects the holistic pharmacological characteristics of TCM formulas. Molecular docking further provides preliminary computational validation of predicted compound–target interactions and supports rational prioritization of candidate molecules for subsequent experimental verification. Collectively, this integrative workflow provides a reliable, efficient, and physiologically relevant strategy for elucidating the material basis and mechanisms of complex herbal formulas such as YQQJ.
This workflow is particularly suitable for investigating the pharmacologically active material basis and mechanisms of complex herbal formulas when in vivo absorption data can be obtained from animal or human pharmacokinetic studies. It is especially applicable to formulas with established clinical efficacy but unclear active constituents. Nevertheless, several limitations should be acknowledged. First, the accuracy of target prediction depends on the quality and completeness of public databases. Second, the workflow focuses on prototype compounds detected in circulation and does not account for bioactive metabolites generated in vivo. Third, predictions derived from network pharmacology analyses require further experimental validation. Despite these limitations, the workflow provides an efficient and reliable approach for hypothesis generation and target prioritization in mechanistic studies of TCM formulas.
Therefore, this study uses UHPLC-Q-Orbitrap HRMS to systematically characterize both the aqueous extract components and circulating compounds of YQQJ, thereby establishing a relatively comprehensive database of potential active constituents. Based on this dataset, network pharmacology analysis, combined with molecular docking validation, predicts the potential pharmacologically active components of YQQJ for the treatment of IgAN and provides a foundation for subsequent mechanistic investigations.
Protocol
All experimental procedures involving animals complied with the Guidelines for the Care and Use of Laboratory Animals issued by the China Animal Welfare Committee. All procedures in this study were approved by the Institutional Animal Care and Use Committee (IACUC) of the Animal Experimental Center of Guang’anmen Hospital.
1. Animals and drug administration
- Use twelve 6-week-old male Sprague–Dawley (SD) rats weighing 200–230 g.
- House all animals in the Experimental Animal Center.
NOTE: Maintain the housing temperature at 20–26 °C and the relative humidity at 40–70%. Use a 12 h/12 h light/dark cycle to simulate natural circadian rhythms. - Acclimatize animals for 7 days under standard conditions with free access to food and water before the experiment. Randomly divide the rats into two groups (n = 6 per group): a control group and a drug-treated group.
- Refer to the equivalent dose converted by body surface area between humans and animals20. Administer YQQJ concentrated extract via oral gavage at 24.68 mL/(kg·day) to the drug-treated group. Administer an equal volume of distilled water to the control group simultaneously to ensure synchronous treatment.
- Continue administration for 1 day. Divide the total daily dose into three equal administrations (e.g., at 08:00, 13:00, and 18:00) to ensure full dosage within 1 day.
NOTE: Fast animals for 12 h before the final gavage, with free access to water. - Collect blood samples at 2 h and 8 h after the final administration. Anesthetize the rats by intraperitoneal injection of 1% sodium pentobarbital (50 mg/kg). Collect blood from the abdominal aorta.
- Leave the blood samples upright at room temperature for 1 h, then centrifuge at 450 × g. for 5 min at 4 °C. Check that the supernatant (serum) is clear and free of hemolysis. Transfer the supernatant serum and store at –80 °C for further analysis.
2. Preparation of solutions
- Preparation of test solutions
- Collect all crude herbs of YQQJ according to the formula. Add 4 volumes of purified water into the decoction pot and soak for 20 min.
NOTE: Purified water was added to the herbs at a 4:1 (v/w) ratio. - Bring the mixture to a boil, then continue decoction for 30 min over low heat. Filter through gauze and collect the filtrate. Repeat the decoction of the residues with 4 volumes of water for another 30 min and filter again.
- Combine the two filtrates. Concentrate the combined solution using a rotary evaporator set at a water bath temperature of 60 °C until reaching a concentration of 3 g/mL (w/v, equivalent to crude medicinal materials).
- Verify that the concentrated extract is a dark, viscous liquid with no visible precipitation. Store at 4 °C for later use.
- Collect all crude herbs of YQQJ according to the formula. Add 4 volumes of purified water into the decoction pot and soak for 20 min.
- Preparation of reference solutions
- Accurately weigh the following reference compounds: Deacetylasperulosidic acid, Geniposidic acid, Loganic acid, Morroniside, Chlorogenic acid, Sweroside, Plantagoguanidinic acid, Rhein-8-O-β-D-glucopyranoside, Genistin, Apigenin-7-glucoside, Diosmetin-7-O-β-D-glucopyranoside, Calycosin, Protodioscin, Genistein, Diosmetin, Pseudoprotodioscin, Formononetin, 3-Hydroxy-9,10-dimethoxyptercarpan, Aloeemodin, Rhein, Dioscin.
- Dissolve each compound in methanol, vortex the mixture for 1 min, then sonicate at room temperature for 10 min to ensure complete dissolution.
- Dilute each solution with methanol to reach a final concentration of 10 µg/mL for each standard.
3. Sample preparation
- Preparation of YQQJ extract samples
- Pipette 100 µL of the YQQJ aqueous extract into a 1.5 mL centrifuge tube. Add 300 µL methanol and vortex for 1 min. Centrifuge at 1800 × g, 4 °C for 10 min. Ensure the resulting supernatant is clear and free of suspended particles.
- Take 100 µL of the supernatant and mix with 100 µL ultrapure water to achieve a 1:1 dilution. Vortex gently and transfer to an autosampler vial for analysis.
- Preparation of drug-containing serum samples
- Pipette 100 µL of serum into a 1.5 mL centrifuge tube. Add 300 µL methanol, and vortex for 10 min to ensure protein precipitation. Centrifuge at 1800 × g., 4 °C for 10 min.
- Collect 270 µL of the supernatant and transfer to a clean tube. Evaporate the supernatant to dryness using a Vacuum Centrifugal Concentrator set at 120 × g., 37 °C for 4 h until a visible solid residue forms.
- Reconstitute the residue with 90 µL of 50% methanol aqueous solution. Vortex for 1 min to completely dissolve the residue, then centrifuge again at 1800 × g., 4 °C for 10 min.
- Collect 80 µL of the final clear supernatant and transfer it to an autosampler vial for analysis.
4. Analytical conditions
- Chromatographic conditions
- Perform chromatographic separation using a UHPLC system equipped with a chromatographic column.
- Use a binary mobile phase (Phase A: water with 0.1% formic acid; Phase B: acetonitrile). Apply a gradient elution program as shown in Table 1, at a flow rate of 0.3 mL/min. Set the column temperature to 40 °C and the injection volume to 6.0 µL.
NOTE: The column specifications are 2.1 mm × 100 mm, 1.8 µm particle dimension.
- MS conditions
- Analyze samples using a quadrupole-orbitrap mass spectrometer equipped with a heated electrospray ionization (HESI) spray probe.
- Set parameters as follows: Ionization voltage: 3.7 kV (positive mode) / 3.5 kV (negative mode); capillary temperature: 320 °C; sheath gas pressure: 30 psi; auxiliary gas pressure: 10 psi; desolvation temperature: 300 °C; sheath gas and the auxiliary gas: nitrogen; collision gas: nitrogen, 1.5 mTorr.
- Acquire data in Full scan/dd-MS2 mode. Set full scan parameters as follows: resolution 70000, auto gain control target 1×10⁶, maximum isolation time 50 ms, and m/z scan range 100 – 1500.
- Collect the dd-MS2 data with the parameters of resolution 17500, auto gain control target 1×10⁵, maximum isolation time 50 ms, select top n (n≤10) most intense parent ions for fragmentation coupled with a dynamic exclusion mechanism, isolation window of m/z 2, collision energy 10 V, 30 V, 60 V, and intensity threshold 1×10⁵.
5. Processing of MS data
- Process the acquired MS data using specialized data processing software. Navigate to the Import Data module and upload the raw data files.
- Execute the Peak Picking module and perform peak deconvolution to group adduct ions and generate compound features.
- Search reference compound databases, target prediction databases, and relevant published literature for candidate identification.
- Identify compounds using two complementary identification strategies based on high-resolution MS data.
- Identification based on reference standard matching. Confirm compounds by comparison with authentic reference standards. Accept identifications only when all the following criteria are satisfied:
- Mass accuracy: The mass error of both precursor ions and fragment ions must be within ±5 ppm.
- Spectral similarity: The cosine similarity score between the experimental MS/MS spectrum and the MS/MS spectrum of the reference standard must be ≥ 0.85.
- Isotopic distribution: The isotopic pattern matching score must be ≥ 90%.
- Chromatographic behavior: The retention time deviation between the detected compound and the reference standard must be < 0.2 min.
NOTE: Compounds meeting all the above criteria are annotated as MSI Level 1, representing confirmed structural identification.
- Identification based on high-resolution MS data and in silico spectral prediction. For compounds without available reference standards, perform putative identification based on accurate mass measurements and computational spectral prediction. Accept annotations only when the following criteria are satisfied:
- Mass accuracy: The mass error of precursor ions must be within ±5 ppm, and the mass error of fragment ions must be within ±10 ppm.
- Spectral similarity: Compare the experimental MS/MS spectrum with the theoretical MS/MS spectrum generated from the compound SMILES structure using the Progenesis QI algorithm. Accept matches with a cosine similarity score ≥ 0.60.
- Isotopic distribution: The isotopic pattern matching score must be ≥ 90%.
- Chromatographic behavior prediction: The deviation between the experimental retention time and the machine-learning predicted retention time must be < 1.0 min.
NOTE: The retention time prediction model was trained using experimental chromatographic data from more than 2000 reference compounds analyzed under the same chromatographic conditions. Compounds meeting these criteria are annotated as MSI Level 2, representing putatively identified compounds with high structural confidence.
- Identification based on reference standard matching. Confirm compounds by comparison with authentic reference standards. Accept identifications only when all the following criteria are satisfied:
6. Network pharmacology
- Identification of blood-absorbed components and IgAN-related targets
- Import the identified prototype blood-absorbed constituents of YQQJ into the target prediction databases. Select "Homo sapiens" as the target species and obtain its potential targets. Record these as the target set of blood-absorbed compounds in YQQJ.
- Use the keyword “IgA Nephropathy” to retrieve IgAN-related disease targets from the integrated bioinformatics platforms. Consolidate results from multiple sources to minimize bias.
NOTE: Use a protein database to convert all retrieved targets into the Gene Symbol format for consistency.
- Construction of protein–protein interaction (PPI) network and identification of core targets
- Merge the target set of YQQJ blood-absorbed compounds with the IgAN disease target set and extract their intersection.
- Upload the intersecting targets to the PPI platform21. Configure the settings: set the organism as Homo sapiens, the confidence score as 0.90, and discard all disconnected nodes.
- Import the PPI data into the visualization software22. Launch the topological analysis plugin. Calculate Degree Centrality (DC)23, Betweenness Centrality (BC)24, and Closeness Centrality (CC)25.
- Screen for the core therapeutic targets of YQQJ against IgAN by filtering nodes with topological parameter values (DC, BC, and CC) exceeding the median.
- Construction and analysis of the “YQQJ–blood-absorbed components–targets–pathways–disease” integrated network
- Prepare the node attribute file: Create a spreadsheet containing two columns. Label the first column Node Name and the second Node Type. Assign one of the five categories (Formula, Blood-Absorbed Component, Intersection Target, Pathway, or Disease) to each node.
- Prepare the network interaction (edge) file: Create a spreadsheet defining the connections between nodes (e.g., Blood-Absorbed Component to Intersection Target). Ensure that all node names match those in the node attribute file to avoid mapping errors.
- Import and build the network: Launch the network visualization software. Navigate to File > Import > Network to load the edge file. In the preview window, map the columns as Source Node and Target Node and click OK to generate the initial graph.
- Map node attributes and set visual styles: Import the node attribute file via File > Import > Table. Open the Style panel and map the Node Type column to specific visual properties, including node shape, fill color, and size.
- Execute topological analysis: Navigate to Tools > Analyze Network to perform topological calculations. Filter and identify core active compounds and key therapeutic targets based on degree values.
NOTE: Use the same topological parameters as described in step 6.2 to ensure consistency in core node identification. - Export the network image: Finalize the network layout. Navigate to File > Export > Network to Image to save the optimized visualization.
- GO enrichment and KEGG pathway analyses
- Submit the gene list: Open the web-based functional annotation platform. Navigate to the Step 1: Submit Gene List area and upload the previously filtered core target gene list26.
- Select species: In the dropdown menus for Step 2: Input as Species and Step 3: Analysis as Species, select H. sapiens. (human) to ensure the analysis is performed within the correct biological context.
- Configure custom analysis: Select the Custom Analysis mode. In the Enrichment category, check the following databases: Gene Ontology (GO) Molecular Function (MF), GO Biological Process (BP), GO Cellular Component (CC), and Kyoto Encyclopedia of Genes and Genomes (KEGG) Pathway.
- Set significance thresholds: Set the P-value cutoff to < 0.01, the Min Enrichment to ≥ 1.5, and the Min Overlap to ≥ 3. Maintain all other parameters at their default settings.
- Execute the analysis: Click the Enrichment Analysis button to submit the task and wait for the calculation to complete.
- Retrieve and export results: Access the generated analysis report page. Click the download button to export the detailed enrichment data in a spreadsheet format, along with the corresponding bar charts and heatmaps.
7. Molecular docking verification
- Download the high-resolution (< 2.50 Å) 3D protein structures of the core targets and 2D chemical structures of the core blood-absorbed constituents from the structural biology databases27.
- Launch the molecular docking software and import the downloaded structures.
- Execute the following preprocessing steps sequentially: Navigate to Edit > Remove Water to eliminate water molecules; select Edit > Remove Heteroatoms to discard non-standard residues.
- Go to Edit > Hydrogens > Add > Polar Only to add polar hydrogen atoms. Save the processed structures in PDBQT format via File > Save > Write PDBQT.
- Define the docking site using the Grid > Grid Box tool. Grid box dimensions were adaptively adjusted (20–100 Å) to ensure full coverage of the predicted binding regions.
- Initialize the docking parameters: Select the receptor via Docking > Macromolecule > Set Rigid Filename and open the ligand via Docking > Ligand > Open. Docking parameters were set as follows: exhaustiveness = 32, energy range = 3 kcal/mol, and up to 10 binding modes were retained. For proteins with co-crystallized ligands, the docking grid box was centered on the ligand centroid with an 8.0 Å extension, while for proteins without co-crystallized ligands, binding pockets were predicted using DoGSiteScorer with approximately 90% coverage.
- Choose the Lamarckian Genetic Algorithm (LGA) as the search strategy. Execute the simulation via Docking > Run AutoDock.
- Evaluate the binding affinity based on the calculated binding energy (docking score)28.
NOTE: A lower binding energy indicates stronger predicted bioactivity and higher structural stability of the protein-ligand complex. A threshold of ≤ -5.0 kcal/mol is typically used to identify favorable binding stability.
Results
Analysis of constituents in the YQQJ aqueous extract
The component analysis of the YQQJ aqueous extract was performed under the conditions established in PROTOCOL 4. UHPLC-Q-Orbitrap HRMS was employed in both positive and negative ion full-scan modes to profile the aqueous extract of YQQJ, and the obtained Base Peak Ion chromatogram (BPI) is shown in Figure 1. On this basis, a self-established chemical constituent database combined with MS/MS spectral characterization enabled the successful identification of 185 compounds from the aqueous extract, with detailed information summarized in Supplementary Table 1. Representative MS/MS spectral matching and fragmentation patterns used for compound identification are illustrated in Supplementary Figure 1. Statistical analysis of compound categories revealed that flavonoids and terpenoids were the predominant constituents in YQQJ, accounting for 94 compounds, the most abundant proportion.
Blood-absorbed components of YQQJ
To clarify the direct bioactive substances in vivo, serum samples collected after YQQJ administration were analyzed. The BPI chromatogram of blank serum (Figure 2) was included for comparison to distinguish drug-derived compounds from endogenous serum components. Based on the BPI of the drug-containing serum (Figure 3), a total of 28 prototype components absorbed into the bloodstream were identified, mainly including flavonoids, terpenoids, and steroids. Extracted ion chromatograms (EICs) of representative compounds across the YQQJ extract, blank serum, and drug-containing serum further confirmed the presence of drug-derived components in circulation (Supplementary Figure 2). Among them, 10 compounds originated from Spatholobus suberectus Dunn, 7 from Dioscorea nipponica Makino, 7 from Astragalus membranaceus, 6 from Hedyotis diffusa Willd., 6 from Lonicera japonica Thunb., 4 from Plantago asiatica L., and 4 from Rheum palmatum .L., as summarized in Supplementary Table 1.
Target prediction of blood-absorbed components of YQQJ related to IgAN
A total of 28 identified prototype constituents entering the bloodstream were input into target prediction databases, yielding 459 potential targets. Meanwhile, 2779 IgAN-related targets were retrieved from integrated bioinformatics platforms. Intersection analysis identified 247 overlapping targets between YQQJ and IgAN (Figure 4).
Construction and analysis of the PPI network
The 247 intersecting targets were uploaded into the PPI platform, and the visualization software was utilized to screen core targets based on three topological parameters: DC, BC, and CC. A total of 42 targets were finally identified as core nodes. The workflow used for screening these core targets is summarized in Supplementary Figure 3. In the PPI network, node size and color varied with parameter values (Figure 5), among which TP53, SRC, AKT1, ESR1, and STAT3 ranked among the top five core targets.
“Formula–blood-absorbed components–core targets–pathways–disease” network of YQQJ
To systematically reveal the multi-component and multi-target mechanisms of YQQJ against IgAN, a “Formula–Blood-Absorbed Components–Core Targets–Pathways–Disease” interaction network was constructed using Visualization software. The network consisted of 96 nodes and 459 edges, where each edge represented a relationship or interaction between two nodes (Figure 6).
GO and KEGG enrichment analyses
GO enrichment analysis of the 42 core targets revealed 1162 BP terms, 52 CC terms, and 92 MF terms. Figure 7 displays the top 10 most significantly enriched GO terms in BP, CC, and MF categories. KEGG enrichment analysis further identified 182 pathways associated with these core targets. Figure 8 illustrates the top 20 significantly enriched pathways closely related to the pathogenesis of IgAN. In these charts, deeper red colors indicate stronger statistical significance, while larger bubble sizes or longer bar lengths represent a greater number of enriched targets within each pathway.
Molecular docking evaluation
In this study, based on the previous analysis of key targets and related pathways of YQQJ in the treatment of IgAN29,30,31,32, six core targets, including CASP3 (PDB ID: 6X8I), IGF1R (PDB ID: 1JQH), JUN (PDB ID: 8RPP), STAT3 (PDB ID: 6NJS), PRKCB (PDB ID: 8SE3), and PIK3CA (PDB ID: 5FI4), were selected as receptor proteins for molecular docking. Corresponding to the core TCM pathogenesis of IgAN, defined as “pathogenic wind, damp-heat and toxins invading the kidney”, representative active components with heat-clearing, dampness-removing, and detoxifying properties were selected as ligands, namely Deacetylasperulosidic acid and Geniposidic acid from Hedyotis diffusa Willd., and Dioscin from Dioscorea nipponica. Makino. The docking results are shown in Figure 9. Among all ligand-receptor combinations, Dioscin exhibited markedly lower binding energies with all selected targets, suggesting a higher predicted binding affinity. Except for the interactions between JUN and Deacetylasperulosidic acid/Geniposidic acid, the other docking pairs also demonstrated favorable binding activities. Representative 3D docking conformations are visualized in Figure 10.
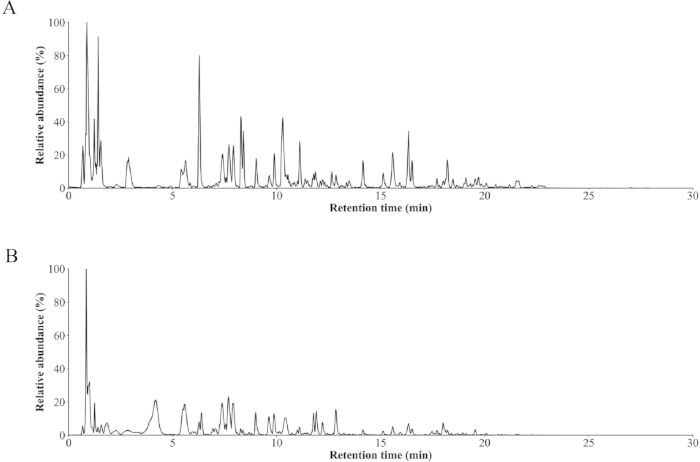
Figure 1: Base Peak Ion chromatograms of YQQJ aqueous extract. (A) Positive ion mode BPI chromatogram. (B) Negative ion mode BPI chromatogram. The chromatograms show the overall chemical profile of the YQQJ aqueous extract under the established UHPLC-Q-Orbitrap HRMS conditions. Please click here to view a larger version of this figure.
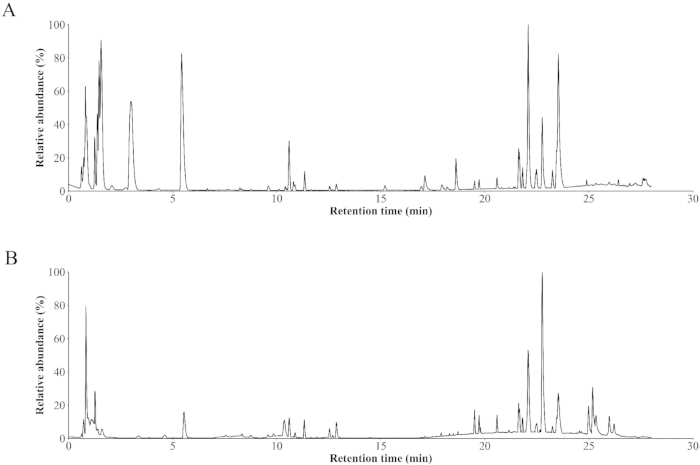
Figure 2: Base Peak Ion chromatograms of blank serum. (A) Positive ion mode BPI chromatogram. (B) Negative ion mode BPI chromatogram. The chromatograms represent the endogenous serum background profile used as a control for comparison with drug-containing serum to distinguish drug-derived components from endogenous constituents. Please click here to view a larger version of this figure.
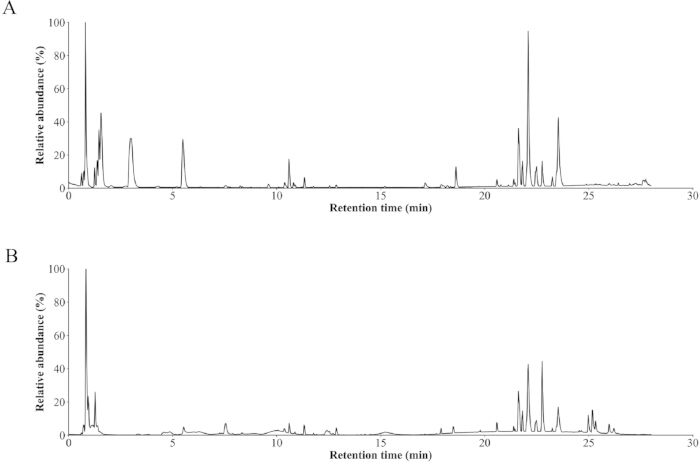
Figure 3: Base Peak Ion chromatograms of YQQJ-containing serum. (A) Positive ion mode BPI chromatogram. (B) Negative ion mode BPI chromatogram. The chromatograms represent the profile of blood-absorbed components detected in serum following YQQJ administration. Please click here to view a larger version of this figure.
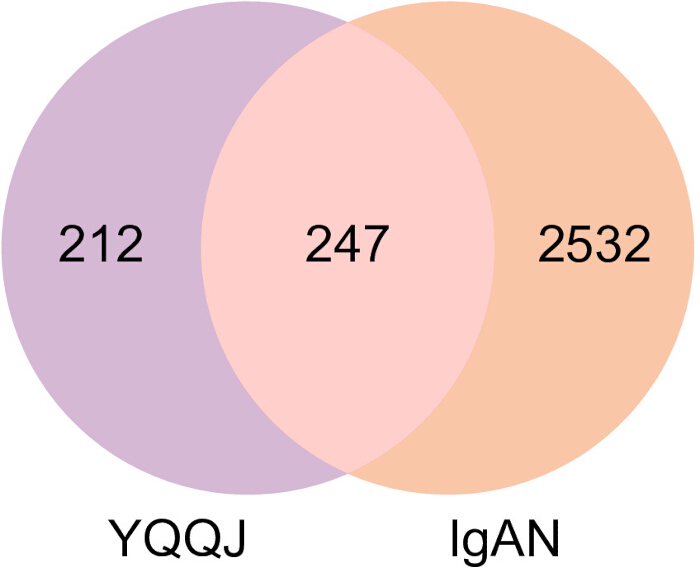
Figure 4: Venn diagram of overlapping targets between YQQJ and IgAN. The diagram shows the number of predicted YQQJ targets, IgAN-related targets, and their intersection, highlighting the shared targets potentially involved in therapeutic effects. Please click here to view a larger version of this figure.
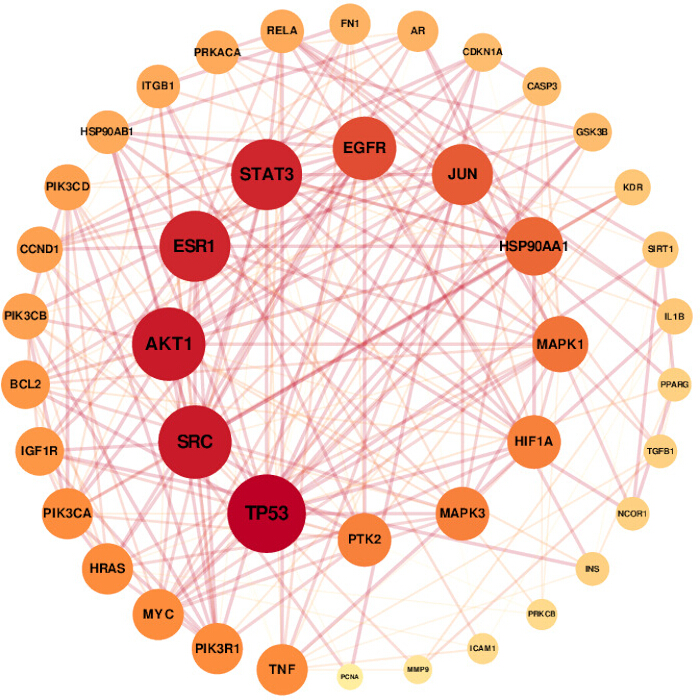
Figure 5: Protein–protein interaction (PPI) network of core targets. Nodes represent protein targets, and edges represent interactions between targets. Node size and color intensity correspond to degree values, with larger and darker nodes indicating higher connectivity within the network. Please click here to view a larger version of this figure.
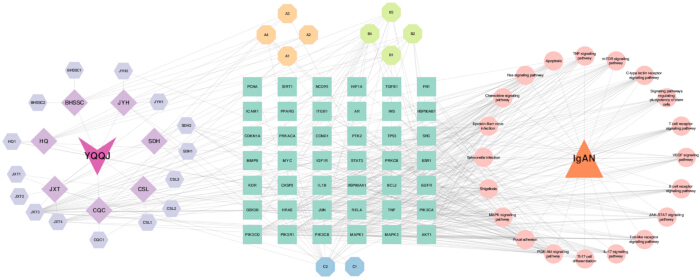
Figure 6: Integrated network of YQQJ components, targets, pathways, and disease. The network illustrates relationships among the formula, blood-absorbed components, core targets, pathways, and IgAN. Triangle represents disease; circle represents pathways; V-shaped node represents the YQQJ formula; diamond represents herbs; hexagon represents components; octagon represents prototype blood-absorbed components; rectangle represents targets. Please click here to view a larger version of this figure.
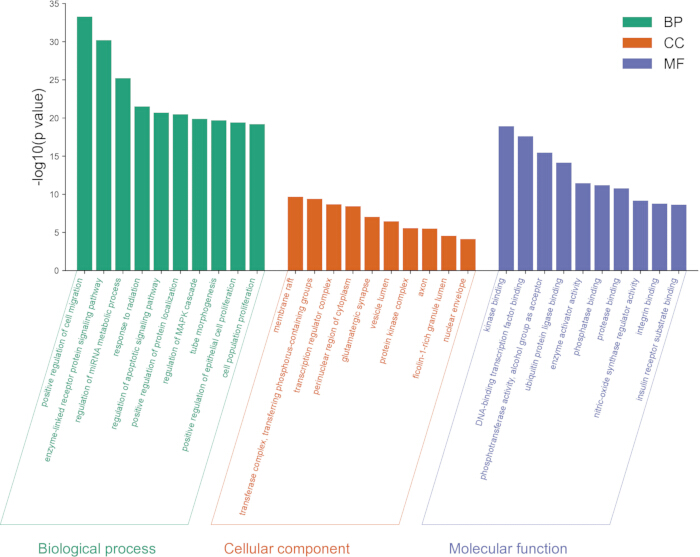
Figure 7: GO enrichment analysis of core targets. The bar plot shows the top 10 enriched Gene Ontology terms across BP, CC, and MF categories. The x-axis represents GO terms, and the y-axis shows −log10(p-value), indicating the significance of enrichment. Abbreviations: BP = Biological process; CC = cellular component; MF = Molecular function. Please click here to view a larger version of this figure.
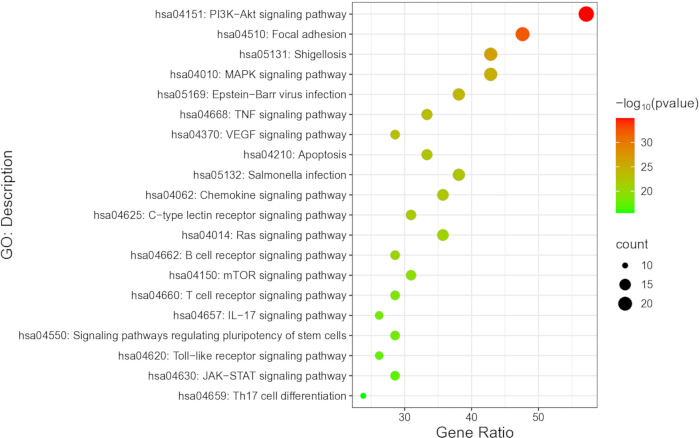
Figure 8: KEGG pathway enrichment analysis of core targets. The bubble plot displays the top 20 enriched KEGG pathways. Dot size indicates the number of enriched genes, and the color gradient indicates −log10(p-value), with redder colors indicating higher statistical significance. The x-axis shows the gene ratio, and the y-axis lists pathway terms. Please click here to view a larger version of this figure.
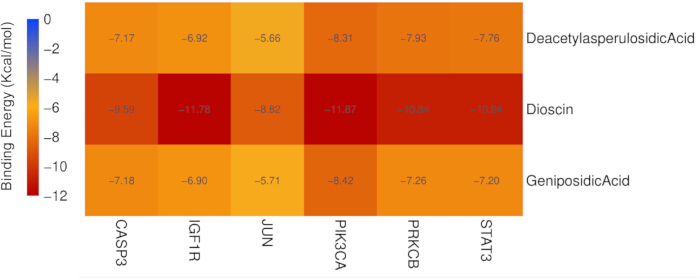
Figure 9: Molecular docking binding energy heatmap. The heatmap presents binding energies (kcal/mol) between core targets and key blood-absorbed compounds. Lower binding energy values indicate stronger predicted binding affinity. Please click here to view a larger version of this figure.

Figure 10: Representative molecular docking conformations. (A) Binding conformation of Deacetylasperulosidic acid with CASP3. (B) Binding conformation of Dioscin with STAT3. (C) Binding conformation of Geniposidic acid with PIK3CA. The images show the predicted ligand–protein interactions and binding orientations. Please click here to view a larger version of this figure.
Supplementary Figure 1: Structural identification of representative compounds by high-resolution MS/MS. (A) Head-to-tail spectral comparison of Deacetylasperulosidic acid between the experimental spectrum (top, red) and reference database spectrum (bottom, blue). (B) High-resolution MS/MS fragmentation spectrum of Deacetylasperulosidic acid. (C) Head-to-tail spectral comparison of Geniposidic acid with the reference database. (D) Experimental MS/MS fragmentation spectrum of Geniposidic acid. (E) Head-to-tail spectral comparison of Dioscin with the reference database. (F) High-resolution MS/MS fragmentation spectrum of Dioscin. These panels illustrate the spectral matching used for compound identification.Please click here to download this file.
Supplementary Figure 2: Extracted ion chromatograms (EICs) of representative compounds across samples. (A) EIC of Deacetylasperulosidic acid. (B) EIC of Geniposidic acid. (C) EIC of Dioscin. For each panel, the top trace represents the YQQJ aqueous extract (ZY), the middle trace represents blank control serum (KBX), and the bottom trace represents serum samples containing blood-absorbed components after YQQJ administration (GYX). The comparison highlights the presence of drug-derived compounds in serum.Please click here to download this file.
Supplementary Figure 3: Workflow for screening core targets. The flowchart illustrates the stepwise process of target identification, including compound target prediction, IgAN-related target collection, intersection analysis, PPI network construction, and screening of core targets based on topological parameters.Please click here to download this file.
| Time (min) | Mobile phase | |
| A (v%) | B (v%) | |
| 0 | 98 | 2 |
| 1.0 | 98 | 2 |
| 14.0 | 70 | 30 |
| 25.0 | 0 | 100 |
| 28.0 | 0 | 100 |
| 28.1 | 98 | 2 |
| 30.0 | 98 | 2 |
Table 1: UHPLC gradient elution program. The table presents the mobile phase composition and gradient conditions used for chromatographic separation, including time points and the corresponding proportions of aqueous (Phase A) and organic (Phase B) solvents.
Supplementary Table 1: Identified chemical constituents of YQQJ aqueous extract. The table lists compounds identified by UHPLC-Q-Orbitrap HRMS, including prototype blood-absorbed components (A1–A28), along with their classification and herbal origin. Abbreviations: BHSSC = Hedyotis diffusa Willd.; CSL = Dioscorea nipponica Makino; DH = Rheum palmatum L.; JXT = Spatholobus suberectus Dunn; HQ = Astragalus membranaceus.; CQC = Plantago asiatica L.; JYH = Lonicera japonica. Thunb. Compound classes include A = Alkaloids; Ald = Aldehydes; F = Flavonoids; N = Nucleosides; O = Others; OA = Organic acids; P = Phenols; PA = Phenolic acids; Phe = Phenylpropanoids; Q = Quinones; S = Saccharides; Ste = Steroids; T = Terpenoids; Tan = Tannins.Please click here to download this file.
Discussion
In the present study, an integrated strategy combining “UHPLC-Q-Orbitrap HRMS identification – serum pharmacochemistry analysis – network pharmacology prediction – molecular docking validation” was employed to systematically elucidate the potential material basis and mechanisms of YQQJ in the treatment of IgAN. Unlike previous research that mainly relied on MS to analyze chemical constituents of herbal formulas and then predicted mechanisms using network pharmacology alone16, serum pharmacochemistry follows a workflow of “complex herbal constituents – blood-absorbed components – direct in vivo active substances – pharmacodynamic material basis”. By identifying the components entering systemic circulation after administration, this approach is widely regarded as an effective strategy for identifying the pharmacodynamic material basis of TCM formulas.
In this study, UHPLC-Q-Orbitrap HRMS analysis initially identified 185 constituents in YQQJ, among which 28 were confirmed as prototype blood-absorbed compounds, thus providing a reliable chemical foundation for subsequent mechanistic studies. The accuracy of this identification depended on the comprehensive matching of retention time, exact mass, and MS/MS fragmentation information14. Based on the serum pharmacochemistry strategy, these prototype blood-absorbed compounds were used as the starting point for network construction, which enhanced the relevance between herbal components and actual in vivo efficacy33. By integrating compound–disease intersecting targets with PPI-based screening of core nodes, followed by GO and KEGG enrichment analyses, key signaling pathways associated with IgAN were identified15. Molecular docking results suggested that the major blood-absorbed components derived from Hedyotis diffusa Willd. and Dioscorea nipponica Makino .may interact with core targets based on predicted binding affinities rather than experimentally confirmed functional activity. These findings support the hypothesis that Deacetylasperulosidic acid, Geniposidic acid, and Dioscin may serve as the potential key pharmacodynamic constituents of YQQJ, pending further experimental validation.
From a technical perspective, sample pretreatment was crucial. Due to the complexity of serum and the presence of endogenous proteins (e.g., hormones and enzymes), interference with the detection of blood-absorbed components is inevitable. In this study, methanol precipitation was applied to enrich analytes and reduce background interference, ensuring both sensitivity and accuracy of MS analysis34. Regarding blood sampling time points, different constituents in herbal formulas may exhibit distinct absorption and in vivo transformation patterns, which can influence their detectability in serum. Therefore, based on preliminary trials, serum samples were collected at 2 h and 8 h after the final administration to maximize the coverage of circulating constituents.
Several procedural steps were found to be particularly critical for the successful implementation of this workflow. Accurate compound identification relies heavily on the combined evaluation of retention time, high-resolution mass accuracy, and diagnostic MS/MS fragment ions. In addition, appropriate serum sampling time points are essential for capturing blood-absorbed constituents that may appear in the circulation at different stages after administration. Careful optimization of sample pretreatment and chromatographic separation conditions is therefore necessary to ensure reliable detection of prototype compounds in complex biological matrices.
Potential analytical challenges may arise during sample preparation and MS analysis. For example, incomplete protein precipitation may result in matrix effects that suppress ionization efficiency, whereas excessive background noise may reduce detection sensitivity. These issues can be mitigated by optimizing solvent ratios during protein precipitation, improving chromatographic separation conditions, and adjusting MS acquisition parameters. During data processing, false-positive compound annotations may occur when relying solely on database matching; therefore, manual verification of MS/MS fragmentation patterns and retention behavior is recommended to improve identification reliability.
Several methodological considerations were incorporated in this work. First, instead of applying conventional criteria such as oral bioavailability and drug-likeness, only experimentally verified blood-absorbed components were used for target prediction. This approach avoided potential omission of active compounds due to preset filtering thresholds and eliminated irrelevant constituents that are not bioavailable in vivo, thereby strengthening the physiological relevance of network prediction16. Second, the selection of active ligands for docking specifically focused on major components originating from herbs with functions of “dispelling wind-dampness and clearing heat-toxin” (Hedyotis diffusa Willd. and Dioscorea nipponica Makino.), establishing a mechanistic bridge between the TCM pathological concept of “wind-damp-heat toxin invading the kidney” and the modern pathological features of IgAN. This provides preliminary evidence supporting the TCM theory of formula–pattern correlation. Third, considering potential differences in data size and quality across databases, multiple platforms were integrated to broaden target coverage and reduce bias introduced by any single database35.
Compared with conventional strategies that directly apply network pharmacology to all detected chemical constituents, the present workflow emphasizes evidence-guided compound prioritization based on experimentally detected blood-absorbed components. This stepwise filtering process reduces the number of candidate compounds entering computational analysis and improves the interpretability of compound–target interaction networks. Furthermore, unlike metabolomics-oriented studies that mainly capture endogenous metabolic perturbations, the current strategy focuses on exogenous prototype compounds derived from herbal medicines, thereby enabling more direct attribution of pharmacological activity to specific herbal constituents.
From a practical methodological perspective, this workflow provides several advantages for investigating complex herbal formulations. The integration of HRMS with serum pharmacochemistry enables the reliable identification of bioavailable constituents, while the subsequent combination of network pharmacology and molecular docking establishes a hierarchical analytical framework that links chemical evidence with mechanistic prediction. In addition, restricting network construction to experimentally verified compounds reduces network complexity and facilitates clearer identification of core compound–target interactions.
This study also has limitations. First, network pharmacology and molecular docking are predictive computational approaches. Strong binding affinity does not necessarily translate into biological regulation in vivo, as molecular docking does not account for protein dynamics, cellular context, or downstream signaling. Furthermore, the present docking protocol did not include re-docking validation using co-crystallized ligands or benchmarking against known inhibitors, which may limit the assessment of docking accuracy. Future studies incorporating RMSD-based validation, molecular dynamics simulations, and experimental assays will further strengthen the reliability of these predictions. Currently, our group has completed mechanistic validation demonstrating that Dioscin acts via the JAK2/STAT3 pathway, which strengthens the credibility of the prediction to some extent and provides partial experimental support for the key targets identified in this study, although other component–target interactions still require confirmation36. Second, the influences of proportional compatibility and dosage relationships among herbs were not incorporated in the current analysis. Future work may introduce dose-effect-weighted network models to better reflect clinical prescription practices37.
In conclusion, the present workflow—high-resolution MS-based identification of blood-absorbed constituents, network pharmacology-based target and pathway-focused analysis, and molecular docking validation—enables efficient narrowing of the active material basis and action targets from a complex herbal formula. This provides a clear experimental direction for follow-up biological verification and accelerates mechanistic investigations of TCM formulas. In the future, integrating spatial metabolomics, organoid models, and multi-omics technologies may enable dynamic and three-dimensional validation and extension of the present findings in systems that more closely recapitulate physiological and pathological conditions, thereby providing more robust evidence for elucidating the scientific basis of TCM formulas.
Disclosures
The authors declare no conflicts of interest.
Acknowledgements
This work was supported by the National Natural Science Foundation of China (Grant No.81973675), the High-Level Chinese Medical Hospital Promotion Project (Grant No. HLCMHPP2023039), and the Beijing Natural Science Foundation (Grant No. 7252259).
Materials
| Name | Company | Catalog Number | Comments |
|---|---|---|---|
| AutoDock 4.2.6 | The Scripts Research Institute | - | |
| Chromatographic column | Waters Corp. | ACQUITY UPLC HSS T3 | |
| High-speed refrigerated centrifuge | Hettich Lab Technology | Mikro 220R | |
| Integrated bioinformatics platforms | Weizmann Institute of Science | - | GeneCards database (https://www.genecards.org/) |
| Integrated bioinformatics platforms | The Johns Hopkins University School of Medicine | - | OMIM database (https://omim.org/). |
| LC-MS/4 L Acetonitrile | Thermo Fisher Scientific | A955-4 | |
| LC-MS/4 L Methanol | Thermo Fisher Scientific | A456-4 | |
| LC-MS/4 L Water | Thermo Fisher Scientific | W6-4 | |
| LC-MS/50 mL Formic acid | Thermo Fisher Scientific | A117-50 | |
| Mass Spectrometry Data processing software | Waters Corp. | - | Progenesis QI 3.0 software |
| Molecular docking software | Olson Laboratory | AutoDock 4.2.6 | |
| PPI platform | STRING database company | - | The STRING online platform (https://string-db.org) |
| Protein database | European Bioinformatics Institute; the Swiss Institute of Bioinformatics; Protein Information Resource | - | UniProt platform (https://www.uniprot.org/) |
| Quadrupole orbitrap mass spectrometer | Thermo Fisher Scientific | IQLAAEGAAPFALGMAZR | |
| Reference compound databases | TCM Pro 2.0, Beijing Hexin Technology Co., Ltd. | - | |
| Rotary evaporator | Shanghai Titan Scientific Co., Ltd | TR-3L | |
| Structural biology databases. | Brookhaven National Laboratory | - | The RCSB PDB database (https://www.rcsb.org/) |
| Structural biology databases. | National Center for Biotechnology Information | - | The PubChem database (https://pubchem.ncbi.nlm.nih.gov/) |
| Target prediction databases | SIB Swiss Institute of Bioinformatics | - | SwissTargetPrediction database (https://www.swisstargetprediction.ch) |
| Target prediction databases | Shanghai Institute of Materia Medica | - | TCMSP database (https://www.tcmsp-e.com/tcmsp.php) |
| Topological analysis plugin | - | - | Centiscape 2.2 plugin; Network Analyzer |
| UHPLC system | Vanquish Flex | - | |
| Ultra-high performance liquid chromatograph | Thermo Fisher Scientific | Vanquish Flex UHPLC | |
| Ultrasonic extractor | Kunshan Ultrasonic Instruments Co., Ltd. | KQ3200D | |
| Vacuum Centrifugal Concentrator | NingBo Scientz Biotechnology Co., Ltd. | SCIENTZ-1LS | |
| Visualization software | - | - | Cytoscape 3.10.4 |
| Web-based functional annotation platform. | Broad Institute | - | The Metascape online platform (https://metascape.org) |
References
- Pattrapornpisut, P., Avila-Casado, C., Reich, H. N. IgA nephropathy: Core curriculum 2021. Am J Kidney Dis. 78 (3), 429-441 (2021).
- Pitcher, D., et al. Long-term outcomes in IgA nephropathy. Clin J Am Soc Nephrol. 18 (6), 727-738 (2023).
- Shen, X., et al. Long-term outcomes of IgA nephropathy in China. Nephrol Dial Transplant. 40 (6), 1137-1146 (2025).
- Roberts, I. S. D. Pathology of IgA nephropathy: A global perspective. Nephrology (Carlton). 29 (Suppl 2), 71-74 (2024).
- Floege, J., Bernier-Jean, A., Barratt, J., Rovin, B. Treatment of patients with IgA nephropathy: A call for a new paradigm. Kidney Int. 107 (4), 640-651 (2025).
- Zhang, Y., Zhang, H. Current understanding and new insights in the treatment of IgA nephropathy. Nephrology (Carlton). 29 (Suppl 2), 75-79 (2024).
- Kang, S. Comparative analysis of western medicine and traditional Chinese medicine. 4th Int. Conf. Social Sciences and Humanities and Arts (SSHA 2025), 2025, , 350-355 (2025).
- Wang, X. H., et al. Traditional Chinese medicine in treating IgA nephropathy. J Transl Intern Med. 9 (3), 161-167 (2021).
- Zeng, Q., Xu, J. L., Liang, Y., Yu, R. H. Etiology and treatment progress of IgA nephropathy. Med Recapitulate. 28 (1), 163-167 (2022).
- Guo, T., et al. Regulation of immune dysfunction in IgA nephropathy. Chin J Basic Med Tradit Chin Med. 30 (3), 552-555 (2024).
- Deng, Q. H., Zou, D., Zhang, S. L., Zhou, X. Regulation of mucosal immunity in IgA nephropathy. Acta Chin Med. 40 (5), 1026-1031 (2025).
- Zhang, S. Q., Rao, X. R., Dai, X. W. Clinical observation of Yiqi Qingjie Fang. Guangming J Chin Med. (12), 44-45 (2006).
- Dong, M. Y., et al. Efficacy of Yiqi Qingjie Fang combined with immunosuppressants. Chin J Integr Tradit West Med. 39 (7), 791-797 (2019).
- Yu, Y., Yao, C., Guo, D. A. Chemical basis of traditional Chinese medicine. Acta Pharm Sin B. 11 (6), 1469-1492 (2021).
- Zhou, W. X., Cheng, X. R., Zhang, Y. X. Network pharmacology: A new concept. Chin J Pharmacol Toxicol. 26 (1), 4-9 (2012).
- Huang, Q., et al. Active components of Eucommia ulmoides. Chin J New Drugs Clin Rem. 40 (6), 460-469 (2021).
- Zhang, A. H., et al. Chinmedomics approach. Engineering. 5 (1), 60-68 (2019).
- Wang, X., Zhang, A., Sun, H., Yan, G. Serum pharmacochemistry of TCM. Phytother Res. 31, 7-14 (2017).
- Liu, R., Zhao, Z., Dai, S., Che, X., Liu, W. Bioactive compound identification. J Agric Food Chem. 67 (13), 3811-3825 (2019).
- Xu, S. Y., Bian, R. L., Chen, X. Pharmacological experimental methodology. Chin Pharmacol Bull. (1), 19(1992).
- Szklarczyk, D., et al. STRING v11 database. Nucleic Acids Res. 47 (D1), D607-D613 (2019).
- Shannon, P., et al. Cytoscape software. Genome Res. 13 (11), 2498-2504 (2003).
- Jeong, H., Mason, S. P., Barabási, A. L., Oltvai, Z. N. Protein network centrality. Nature. 411 (6833), 41-42 (2001).
- Joy, M. P., Brock, A., Ingber, D. E., Huang, S. High-betweenness proteins. J Biomed Biotechnol. (2), 96-103 (2005).
- Wuchty, S., Stadler, P. F. Centers of complex networks. J Theor Biol. 223 (1), 45-53 (2003).
- Zhou, Y., et al. Metascape resource. Nat Commun. 10 (1), 1523(2019).
- Burley, S. K., et al. RCSB PDB resources. Nucleic Acids Res. 53 (D1), D564-D574 (2025).
- Laskowski, R. A., Swindells, M. B. LigPlot+. J Chem Inf Model. 51 (10), 2778-2786 (2011).
- Cheung, C. K., et al. Pathogenesis of IgA nephropathy. Nat Rev Nephrol. 21 (1), 9-23 (2025).
- Zhao, L., et al. Triptolide and IgA nephropathy. Cell Prolif. 55 (9), e13278(2022).
- Tao, J., et al. JAK-STAT activity in IgA nephropathy. Clin J Am Soc Nephrol. 15 (7), 973-982 (2020).
- Cox, S. N., et al. Wnt/β-catenin and PI3K/AKT pathways. Kidney Int. 78 (4), 396-407 (2010).
- Nie, X., et al. Huagan Jian analysis. Chin Tradit Herb Drugs. 53 (2), 382-394 (2022).
- Wu, X. W., et al. Serum pharmacochemistry methodology. Chin J Exp Tradit Med Formulae. 25 (3), 173-179 (2019).
- Abbasi, K., et al. Deep learning in drug target prediction. Curr Med Chem. 28 (11), 2100-2113 (2021).
- Zhou, L., et al. Dioscorea nipponica mechanisms. J Ethnopharmacol. 353 (Pt A), 120272(2025).
- Zhang, K. Y., et al. Dose–effect network pharmacology. Chin J Hosp Pharm. 43 (7), 738-747 (2023).
Reprints and Permissions
