This protocol describes a standardized workflow for early cardiometabolic assessment in adults with metabolic dysfunction-associated steatotic liver disease (MASLD), integrating dietary inflammatory assessment, biochemical biomarkers, echocardiography, and carotid ultrasonography, along with standardized acquisition, quality control, and data validation procedures to improve reproducibility.
Method Article
Standardized Protocol for Early Cardiometabolic Assessment in Metabolic Dysfunction-Associated Steatotic Liver Disease
In This Article
Summary
Abstract
Metabolic dysfunction-associated steatotic liver disease (MASLD) is associated with chronic low-grade inflammation and an increased risk of cardiovascular disease. Early identification of subclinical cardiometabolic alterations remains challenging because standardized protocols integrating dietary inflammatory assessment with objective cardiovascular imaging are limited. This protocol describes a reproducible workflow for evaluating the association between dietary inflammatory potential and early cardiometabolic alterations in adults with confirmed MASLD. Participants are enrolled according to standardized eligibility criteria, and hepatic steatosis is confirmed by ultrasonography. Dietary intake is assessed using a validated semi-quantitative food frequency questionnaire (FFQ), from which the Dietary Inflammatory Index (DII) is calculated using the original literature-derived methodology. Cardiometabolic assessment includes anthropometric measurements, fasting biochemical analyses, calculation of the triglyceride-to-high-density lipoprotein cholesterol (TG/HDL-C) ratio and the Atherogenic Index of Plasma (AIP), enzyme-linked immunosorbent assay (ELISA) quantification of inflammatory biomarkers, transthoracic echocardiographic assessment of left ventricular diastolic function using tissue Doppler-derived E/e′, and bilateral carotid ultrasonography for measurement of carotid intima-media thickness (CIMT). Standardized acquisition procedures, predefined quality-control checkpoints, and data-validation steps are incorporated to ensure methodological consistency and reproducibility. Representative results demonstrate the standardized data generated by the protocol, including DII classification, inflammatory biomarker profiles, echocardiographic indices, and CIMT measurements, and do not imply confirmatory biological associations. This protocol provides a detailed, reproducible methodological framework for conducting clinical and translational studies investigating the relationship between dietary inflammatory burden and early cardiometabolic alterations in adults with MASLD.
Introduction
Metabolic dysfunction-associated steatotic liver disease (MASLD) is the most prevalent chronic liver disease worldwide, affecting approximately one-third of the adult population. Beyond progressive hepatic injury, MASLD is characterized by chronic low-grade inflammation, insulin resistance, endothelial dysfunction, and accelerated atherosclerosis1,2. Cardiovascular disease is a leading cause of morbidity and mortality among individuals with MASLD, underscoring the need for reliable approaches to identify early cardiometabolic alterations before clinically overt cardiovascular disease develops3,4. The objective of this protocol is to provide a standardized and reproducible workflow for the integrated assessment of dietary inflammatory burden, systemic inflammation, and early subclinical cardiovascular dysfunction in adults with MASLD. This protocol is intended for clinical and translational studies investigating early cardiometabolic risk preceding clinically significant cardiovascular disease in this population.
Accumulating evidence indicates that diet plays a pivotal role in the initiation and progression of MASLD. Dietary patterns characterized by high consumption of ultra-processed foods, saturated fats, refined carbohydrates, and added sugars promote oxidative stress, endothelial dysfunction, immune activation, and chronic systemic inflammation5,6. Conversely, dietary patterns rich in fiber, polyphenols, omega-3 fatty acids, and antioxidant micronutrients attenuate inflammatory pathways associated with metabolic dysfunction and cardiovascular disease6,7.
The Dietary Inflammatory Index (DII) was developed to estimate the inflammatory potential of habitual dietary intake using a literature-derived scoring system based on the effects of 45 dietary components on inflammatory biomarkers, including C-reactive protein (CRP), interleukin (IL)-1β, IL-4, IL-6, IL-10, and tumor necrosis factor-α (TNF-α)8. Higher DII scores have been associated with increased circulating inflammatory mediators, insulin resistance, metabolic syndrome, type 2 diabetes mellitus, and cardiovascular disease across diverse populations9,10.
Although DII has been associated with adverse metabolic outcomes, relatively few studies have integrated dietary inflammatory assessment with objective cardiovascular imaging to detect early cardiovascular alterations in individuals with MASLD4,11. Among the earliest manifestations of cardiometabolic injury are subclinical left ventricular diastolic dysfunction, assessed by the tissue Doppler-derived E/e′ ratio, which reflects elevated left ventricular filling pressure and represents an early feature of diabetic and metabolic cardiomyopathy12,13, and carotid intima-media thickness (CIMT), a validated surrogate marker of subclinical atherosclerosis that independently predicts future cardiovascular events14,15.
Compared with conventional cardiometabolic evaluation, which primarily relies on anthropometric measurements, routine biochemical testing, and isolated cardiovascular risk factors, this protocol integrates dietary inflammatory assessment, inflammatory biomarker profiling, echocardiographic evaluation of diastolic function, and carotid ultrasonography into a single standardized workflow. This integrated approach enables the simultaneous assessment of dietary exposure, systemic inflammation, and subclinical cardiovascular remodeling using non-invasive techniques that are widely available in clinical research settings. Although multimodal approaches have been proposed to improve the characterization of early cardiovascular dysfunction in metabolic diseases, standardized implementation protocols remain limited.
To complement conventional lipid profile assessment, this protocol also incorporates the triglyceride-to-high-density lipoprotein cholesterol (TG/HDL-C) ratio and the Atherogenic Index of Plasma (AIP), calculated as log (TG/HDL-C). AIP reflects the balance between atherogenic and anti-atherogenic lipoproteins and has emerged as a surrogate marker of small, dense low-density lipoprotein (LDL) particles, insulin resistance, endothelial dysfunction, and residual cardiovascular risk. Consequently, AIP provides a more comprehensive assessment of atherogenic dyslipidemia and has demonstrated good discriminatory ability for identifying individuals at increased cardiovascular risk, particularly those with metabolic disorders such as MASLD16,17.
In addition, this protocol incorporates a panel of circulating inflammatory biomarkers to further characterize the biological mechanisms linking dietary inflammatory potential with cardiometabolic injury in MASLD. These biomarkers were selected because they play central roles in leukocyte recruitment, innate immune activation, pro- and anti-inflammatory signaling, endothelial dysfunction, and insulin resistance. Simultaneous assessment of these mediators provides a more comprehensive characterization of systemic inflammation than CRP alone and enhances mechanistic insight into the relationship between dietary inflammatory burden and early cardiovascular injury in MASLD1,18,19.
Therefore, this protocol provides a standardized and reproducible methodology for evaluating the association between dietary inflammatory potential and early cardiometabolic alterations in adults with MASLD by integrating dietary assessment, inflammatory biomarker profiling, biochemical analyses, echocardiography, and carotid ultrasonography. By incorporating standardized measurement procedures and predefined quality-control checkpoints, this workflow is designed to facilitate reproducibility across investigators and study sites while supporting clinical and translational research into early cardiometabolic risk in MASLD.
Protocol
The study protocol was approved by the Institutional Research and Research Ethics Committees of the National Medical Center "20 de Noviembre," Instituto de Seguridad y Servicios Sociales de los Trabajadores del Estado (ISSSTE), Mexico City, Mexico (Approval ID: 04-118-2025). Conduct all procedures in accordance with the Declaration of Helsinki and applicable national regulations governing research involving human participants. Obtain written informed consent from all participants before enrollment. Protect participant confidentiality by using coded study identifiers for all clinical, laboratory, dietary, and imaging data.
1. Participant recruitment and eligibility assessment
- Recruit participants
- Recruit adults aged ≥18 years with suspected metabolic dysfunction-associated steatotic liver disease (MASLD) between 2025 and 2026.
- Explain the study objectives, procedures, potential risks, and confidentiality measures before enrollment.
- Obtain written informed consent from each participant before performing any study procedure.
- Confirm MASLD
- Perform abdominal ultrasonography using standardized institutional procedures.
- Confirm hepatic steatosis by identifying increased hepatic echogenicity relative to the renal cortex together with posterior acoustic attenuation.
- Diagnose MASLD by confirming hepatic steatosis and the presence of at least one cardiometabolic risk factor according to current consensus criteria.
NOTE: Perform all ultrasonographic examinations using the same acquisition protocol and, whenever possible, the same experienced radiologist to minimize operator-dependent variability.
- Evaluate eligibility
- Include participants who meet all predefined eligibility criteria and have provided written informed consent.
- Exclude participants with significant alcohol consumption.
- Exclude participants with viral hepatitis (HBV or HCV), autoimmune liver disease, drug-induced liver injury, hereditary liver diseases, pregnancy, active malignancy, decompensated heart failure, or other chronic liver diseases that may interfere with cardiometabolic assessment.
NOTE: Protect participant confidentiality by assigning a coded study identifier to each participant, removing names, medical record numbers, and other personal identifiers from research databases, and storing echocardiographic and carotid ultrasound images in a secure institutional database.
2. Food frequency questionnaire
- Select the dietary assessment instrument
- Select a validated semi-quantitative food frequency questionnaire (FFQ) appropriate for the study population.
NOTE: Use FFQs previously validated against repeated 24-h dietary recalls or dietary records. In this protocol, the ENSANUT 140-item semi-quantitative FFQ was used to assess habitual intake over the previous 7 days20,21.
- Select a validated semi-quantitative food frequency questionnaire (FFQ) appropriate for the study population.
- Prepare the dietary assessment
- Train all interviewers using standardized written instructions before participant recruitment.
- Standardize questionnaire administration, portion-size estimation, response interpretation, and data recording among all interviewers.
- Administer the FFQ
- Conduct the FFQ during a face-to-face interview.
- Instruct participants to report their habitual food and beverage intake during the reference period specified by the FFQ.
- Include foods consumed on both weekdays and weekends.
- Exclude temporary dietary changes associated with acute illness, hospitalization, or short-term therapeutic interventions.
- Record dietary intake
- Record food consumption using the predefined FFQ frequency categories.
- Estimate portion sizes using standardized household utensils, food models, photographs, or reference serving guides.
- Clarify unfamiliar foods, serving sizes, or frequency categories without influencing participant responses.
NOTE: Verify data quality by reviewing each completed FFQ immediately after the interview. Identify missing responses or inconsistent answers, and resolve discrepancies directly with the participant before entering the data into the study database.
- Calculate daily dietary intake
- Convert reported consumption frequencies into average daily intake (servings/day).
- Convert portion sizes into grams or milliliters per day according to the FFQ manual.
- Calculate daily nutrient intake using the appropriate food composition database and nutritional analysis software.
- Apply the same nutrient-calculation procedure to all participants.
PAUSE POINT: Securely store completed FFQs after quality verification and process them later for nutrient analysis and Dietary Inflammatory Index (DII) calculation.
3. Dietary inflammatory index estimation
NOTE: The Dietary Inflammatory Index (DII) is a literature-derived algorithm that estimates the inflammatory potential of habitual dietary intake from data collected using a validated dietary assessment instrument8.
- Prepare dietary intake data
- Convert all FFQ responses into daily nutrient intakes using a standardized food composition database and nutritional analysis software.
- Apply the same nutrient-calculation procedure to all participants.
- Select dietary components
- Identify the dietary components available for DII calculation.
- Calculate the DII using only the dietary components reliably captured by the selected FFQ and food composition database.
- Apply the same set of dietary components to all participants.
NOTE: Do not assign a value of zero to dietary components that were not measured.
- Calculate standardized scores
- Compare the intake of each dietary component with the corresponding global reference mean and standard deviation described in the original DII methodology8.
- Calculate the standardized score using the following equation:
- Standardized score = (Participant intake − Global reference mean) ÷ Global reference standard deviation
- Calculate centered percentiles
- Convert each standardized score into a centered percentile according to the original DII methodology.
- Calculate the centered percentile using the following equation:
- Centered percentile = (Percentile × 2) − 1
- Calculate component DII scores
- Multiply the centered percentile by the inflammatory effect score assigned to each dietary component in the original DII database8.
- Repeat the calculation for all available dietary components.
- Component DII score = Centered percentile × Inflammatory effect score
- Calculate the overall Dietary Inflammatory Index
- Sum the component DII scores to obtain the overall DII score for each participant.
- Interpret negative values as a more anti-inflammatory dietary pattern.
- Interpret positive values as a more pro-inflammatory dietary pattern.
- Classify participants
- Rank participants according to their DII scores.
- Divide participants into quartiles based on the study population distribution.
- Perform quality control
- Use the same FFQ, food composition database, nutritional analysis software, and DII calculation method for all participants.
- Review all dietary records for missing information, implausible energy intake, and data-entry errors before analysis.
- Independently recalculate the DII for a random sample of participants to verify calculation accuracy.
- Document all dietary components included in the DII calculation and report components that were unavailable.
4. MASLD assessment
- Confirm liver steatosis as stated in 1.2.2.
NOTE: Whenever possible, have the same experienced radiologist perform all examinations using identical acquisition parameters to minimize operator-dependent variability. - Assess alcohol consumption
- Evaluate alcohol consumption using a standardized clinical interview.
- Exclude participants whose alcohol intake exceeds current diagnostic thresholds for MASLD.
- Exclude secondary causes of hepatic steatosis
- Exclude participants with chronic viral hepatitis (HBV or HCV).
- Exclude participants with autoimmune liver disease, drug-induced liver injury, hereditary liver diseases, pregnancy, active malignancy, or other chronic liver disorders that may interfere with cardiometabolic assessment.
- Evaluate cardiometabolic risk factors
- Assess body mass index (BMI) and classify overweight or obesity as BMI ≥25 kg/m2.
- Assess type 2 diabetes mellitus using fasting plasma glucose >125 mg/dL.
- Assess metabolic dysregulation by confirming the presence of at least two of the following criteria: increased waist circumference, blood pressure ≥130/85 mmHg, triglycerides ≥150 mg/dL, HDL-C <40 mg/dL in men or <50 mg/dL in women, fasting plasma glucose 100–125 mg/dL or HbA1c 5.7%–6.4%, or elevated insulin resistance markers, such as HOMA-IR.
- Diagnose MASLD when hepatic steatosis is confirmed together with at least one cardiometabolic risk factor according to current consensus criteria.
5. Evaluate cardiometabolic risk
- Obtain demographic and anthropometric measurements
- Record participant age, sex, medical history, current medications, and diagnosed cardiometabolic diseases, including type 2 diabetes mellitus and hypertension.
- Measure height and body weight using calibrated equipment.
- Calculate body mass index (BMI) by dividing body weight (kg) by the square of height (m2).
- Measure waist circumference midway between the lower margin of the last rib and the iliac crest using a non-stretchable measuring tape.
- Determine biochemical markers of cardiometabolic risk using routine automated clinical laboratory methods.
- Collect fasting blood samples according to institutional laboratory procedures.
- Measure biochemical markers, including total cholesterol, HDL-C, LDL-C, triglycerides, fasting plasma glucose, HbA1c, and fasting insulin, using routine automated clinical laboratory testing.
NOTE: Automated clinical laboratory testing typically determines total cholesterol and triglycerides using enzymatic colorimetric assays; HDL-C and LDL-C using direct homogeneous enzymatic colorimetric assays; fasting plasma glucose using an enzymatic hexokinase method; HbA1c using high-performance liquid chromatography (HPLC); and fasting insulin using a chemiluminescent immunoassay. - Calculate the homeostatic model assessment for insulin resistance (HOMA-IR).
- Calculate the triglyceride-to-HDL cholesterol (TG/HDL-C) ratio.
- Calculate the atherogenic index of plasma (AIP) as:
AIP = log (TG/HDL-C)
- Measure plasma inflammatory biomarkers
NOTE: Handle human biological specimens in accordance with institutional biosafety regulations and standard precautions. Wear appropriate PPE, use sterile materials and aseptic techniques, transport specimens in sealed containers, and dispose of biological waste in accordance with institutional regulations.- Acquire and process blood samples
- Collect 15 mL of fasting venous blood from the antecubital vein using sterile technique into appropriate anticoagulant-containing tubes.
- Gently invert the tubes 8–10 times. Centrifuge at 2,000 × g for 10 min at 4 °C.
- Transfer the plasma supernatant to a labeled sterile tube and aliquot as required. Store the aliquots at −80 °C until analysis.
- Perform ELISA
- Prepare standards and sample dilutions. Add 100 µL of standards, controls, and appropriately diluted plasma samples in duplicate to the designated antibody-coated well.
- Incubate for 2.5 h at room temperature, with gentle agitation. Aspirate the contents and wash the wells 3 times with 300 µL of PBS containing 0.05% polysorbate 20 (PBST), pH 7.2–7.4, removing residual liquid after the final wash.
- Add 100 µL of detection antibody and incubate 1 h at room temperature. Wash the plate, and add 100 µL of streptavidin-HRP and incubate for 30–60 min at room temperature. Repeat the washing step.
- Add 100 µL of TMB substrate for color development. Incubate for 20–30 min at room temperature in the dark. Add the stop solution.
- Measure absorbance at 450 nm using a microplate reader. Calculate analyte concentrations from the standard curve.
- Analyze each plasma sample in duplicate and calculate the average value for statistical analysis.
- Include calibration standards and quality-control samples in every analytical run.
- Verify that duplicate measurements meet the predefined coefficient-of-variation criterion. Repeat the measurements if the criterion is exceeded or if technical errors are detected.
- Record the final results using coded participant identifiers. Maintain specimen anonymity throughout laboratory analysis.
- Acquire and process blood samples
- Evaluate left ventricular diastolic function by echocardiography
- Prepare the participant and equipment
- Allow the participant to rest quietly for at least 10 min before image acquisition.
- Position the participant in the left lateral decubitus position and attach ECG leads for cardiac cycle synchronization.
- Acquire all images during quiet respiration while minimizing respiratory motion.
- Use a high-resolution ultrasound system equipped with a 2–5 MHz phased-array transducer capable of pulsed-wave Doppler and tissue Doppler imaging.
- Maintain identical ultrasound equipment, transducer settings, and acquisition parameters throughout the study whenever possible.
NOTE: Perform all examinations according to the current recommendations of the American Society of Echocardiography and the European Association of Cardiovascular Imaging12,22.
- Acquire standard echocardiographic images
- Obtain standard parasternal long-axis, parasternal short-axis, apical four-chamber, apical two-chamber, and apical long-axis views.
- Optimize gain, depth, sector width, and frame rate before Doppler acquisition.
- Measure mitral inflow
- Position the pulsed-wave Doppler sample volume between the mitral leaflet tips in the apical four-chamber view.
- Record early (E) and late (A) transmitral inflow velocities.
- Acquire at least three consecutive cardiac cycles for analysis.
- Perform tissue Doppler imaging
- Activate pulsed-wave tissue Doppler imaging in the apical four-chamber view.
- Position the sample volume sequentially at the septal and lateral mitral annulus.
- Maintain the ultrasound beam as parallel as possible to myocardial motion.
- Record three consecutive cardiac cycles at each annular position.
- Calculate annular velocities
- Measure septal and lateral e′ velocities.
- Average three cardiac cycles for each annular location.
- Calculate the mean annular e′ velocity.
- Calculate the E/e′ ratio
- Calculate the average E/e′ ratio using the mitral E velocity divided by the mean annular e′ velocity.
- Report septal and lateral E/e′ ratios separately when available.
NOTE: For quality control, acquire at least three consecutive cardiac cycles during stable respiration and average three independent measurements for each echocardiographic variable. Store all digital images for offline analysis by at least two trained operators blinded to laboratory and dietary data, and assess inter-operator reproducibility before final data analysis.
- Prepare the participant and equipment
- Evaluate subclinical atherogenesis by measuring carotid intima-media thickness
- Prepare the participant and equipment
- Perform carotid ultrasonography using a high-resolution ultrasound system equipped with a 7–15 MHz linear-array vascular transducer.
- Allow the participant to rest in the supine position for at least 10 min before image acquisition.
- Position the neck in slight extension and rotate the head approximately 30–45° away from the side being examined.
- Avoid excessive head rotation to maintain vessel geometry and optimize image quality.
- Use the same ultrasound system, transducer, acquisition settings, and analysis software for all participants whenever possible.
- Perform carotid ultrasonography
- Examine the right and left carotid arteries independently.
- Identify the common carotid artery, carotid bulb, internal carotid artery, and external carotid artery in the transverse plane.
- Rotate the transducer to obtain a longitudinal image with clearly defined lumen–intima and media–adventitia interfaces.
- Optimize image depth, focal zone, and overall gain before obtaining measurements.
- Measure carotid intima-media thickness
- Define CIMT as the distance between the leading edge of the lumen–intima interface and the leading edge of the media–adventitia interface.
- Select a plaque-free segment of the far wall of the distal common carotid artery approximately 10 mm proximal to the carotid bulb.
NOTE: Do not include the carotid bulb or internal carotid artery in the primary common carotid CIMT measurement unless these regions are predefined study outcomes.
- Calculate CIMT
- Obtain at least three measurements from each carotid artery.
- Calculate the mean CIMT for the right and left carotid arteries separately.
- Calculate the overall mean CIMT as the average of the right and left mean values.
- Record the maximum plaque-free CIMT on each side as a secondary descriptive variable.
- Interpret CIMT
- Analyze CIMT primarily as a continuous variable.
- Apply a predefined study-specific CIMT threshold (<0.7 mm or ≥0.7 mm) only for representative categorical analyses, when appropriate.
- Record carotid plaque separately from CIMT measurements.
NOTE: Use a CIMT threshold of ≥0.7 mm for representative analyses only; when available, use age- and sex-specific reference values. Ensure quality control using trained sonographers, coded images, and blinded independent analysis by at least two investigators. Assess inter- and intraobserver reliability using ICCs with 95% confidence intervals, and repeat measurements when arterial interfaces are inadequately visualized.
- Prepare the participant and equipment
6. Statistical analysis
- Estimate the sample size
- Estimate the required sample size according to the primary study objective and the expected effect size.
- Use a significance level (α) of 0.05 and a statistical power of at least 80%.
- Evaluate the distribution of continuous variables using an appropriate normality test, such as the Shapiro–Wilk test.
- Select statistical tests
- Analyze normally distributed continuous variables using the Student's t-test.
- Analyze non-normally distributed continuous variables using the Mann–Whitney U test.
- Compare more than two groups using one-way analysis of variance (ANOVA) or the Kruskal–Wallis test, as appropriate.
- Analyze categorical variables using the chi-square test or Fisher's exact test.
- Assess associations between normally distributed variables using Pearson correlation analysis.
- Assess associations between non-normally distributed variables using Spearman's rank correlation analysis23,24,25.
- Adjust for confounding variables
- Perform multivariable regression analyses, when appropriate, to evaluate the independent association between the Dietary Inflammatory Index and cardiometabolic outcomes.
- Adjust regression models for clinically relevant confounding variables, including age, sex, body mass index, waist circumference, comorbidities, smoking status, physical activity, and medications that may influence inflammatory biomarkers26.
- Consider a two-sided p value <0.05 statistically significant.
- Report statistical analyses
- Present continuous variables as mean ± standard deviation or median (interquartile range), as appropriate.
- Present categorical variables as frequencies and percentages.
- Report effect estimates together with corresponding 95% confidence intervals, whenever applicable.
Results
All participants had MASLD confirmed by standardized hepatic ultrasonography. The study population was age- and sex-matched, and the most prevalent comorbidities were type 2 diabetes mellitus, systemic arterial hypertension, and dyslipidemia, as summarized in Table 1. The raw data underlying the representative analyses are provided in Supplementary File 1.
As a representative application of the protocol, the Dietary Inflammatory Index (DII) was analyzed as an indicator of dietary inflammatory potential. Exploratory analyses demonstrated a moderate positive correlation between DII and the E/e′ ratio (Spearman's ρ = 0.50, p < 0.05), whereas no significant correlation was observed between DII and CIMT (Spearman's ρ = 0.40, p = 0.81; Figure 1). Accordingly, the DII–CIMT correlation should be interpreted as an exploratory, non-significant finding.
Representative biochemical analyses demonstrated that participants with MASLD exhibited higher plasma glucose, HbA1c, triglyceride concentrations, and greater cardiovascular risk, as reflected by elevated triglyceride-to-HDL cholesterol (TG/HDL-C) ratios and the Atherogenic Index of Plasma. Subclinical atherosclerosis was further evaluated by stratifying participants according to CIMT. Representative analyses showed that increased CIMT was not associated with body weight, body mass index, or waist circumference but was associated with the presence of MASLD (Table 2).
The protocol's applicability is further illustrated by the predefined participant classification criteria. Participants assigned to the highest DII quartile (Q4) represented the subgroup with the greatest dietary inflammatory burden, whereas those assigned to Q1 represented the lowest inflammatory exposure. Likewise, participants with CIMT ≥0.7 mm were classified as having increased subclinical atherosclerosis, whereas E/e′ values >14 indicated elevated left ventricular filling pressure and diastolic dysfunction. These predefined thresholds provide a standardized framework for interpreting dietary, vascular, and cardiac findings and facilitate reproducible comparisons of cardiometabolic risk across participant groups.
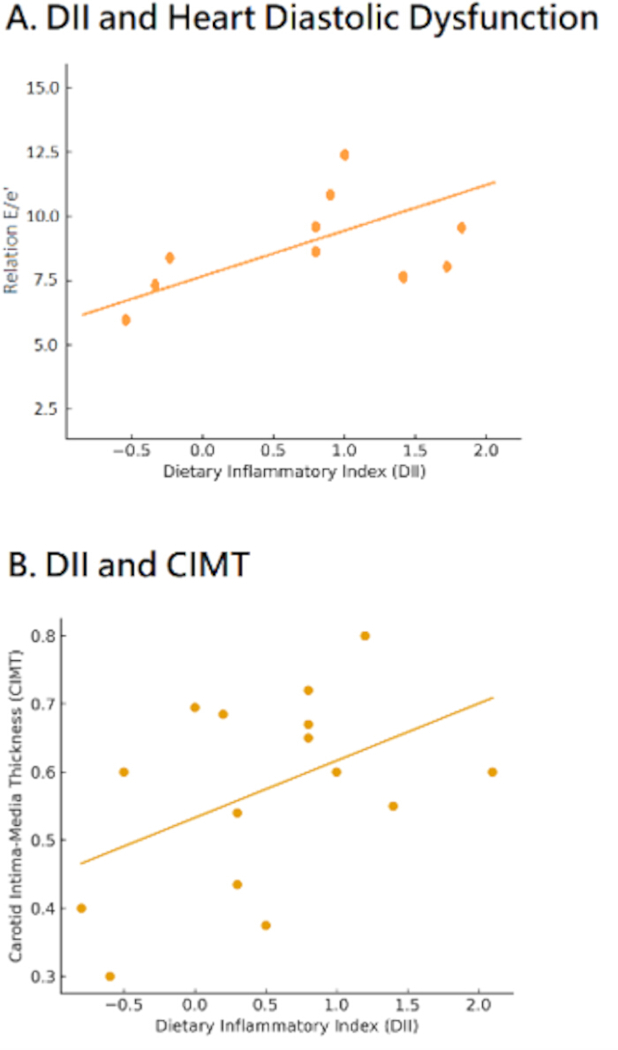
Figure 1: Representative relationships between the Dietary Inflammatory Index and early cardiometabolic measures. (A) Correlation between the Dietary Inflammatory Index (DII) and the E/e′ ratio, an echocardiographic marker of left ventricular filling pressure. (B) Correlation between DII and carotid intima-media thickness (CIMT), analyzed as a continuous variable. The predefined CIMT threshold of 0.7 mm was used only for representative categorical analyses and should not be interpreted as a universal diagnostic cutoff. Please click here to view a larger version of this figure.
| w/o MASLD | With MASLD | p-value | |
| (n = 10) | (n = 15) | ||
| Age (years) | 42 (37 – 48) | 41 (39 – 43) | 0.37 |
| Male sex n (%) | 4 (40.0) | 8 (53.3) | 0.4 |
| Fasting glucose (mg/dL) | 88 (83 – 94) | 105 (98 – 125) | 0.01 |
| HbA1c | 5.9 (5.5 - 6.1) | 6.4 (6.0 – 7.2) | 0.02 |
| TG (mg/dL) | 120 (74 – 147) | 219 (108 – 297) | 0.02 |
| HDLc (mg/dL) | 41 (37 – 46) | 48 (30 – 57) | 0.43 |
| TG/HDL-C ratio | 2.5 (1.8 – 4.9) | 5.1 (2.6 – 6.7) | 0.04 |
| AIP | 0.32 (0.24 – 0.41) | 0.42 (0.35 – 0.62) | 0.04 |
| CRP (mg/dL) | 0.8 (0.4 – 1.0) | 1.1 (0.2 – 1.3) | 0.23 |
Table 1: Representative demographic, biochemical, and cardiometabolic characteristics according to MASLD status. Baseline demographic characteristics and representative biochemical and cardiometabolic parameters in participants without MASLD and with MASLD. Continuous variables are presented as median (interquartile range), and categorical variables are presented as n (%). Group comparisons were performed using the Student's t-test or Mann–Whitney U test for continuous variables and Fisher's exact test for categorical variables. Abbreviations: MASLD = metabolic dysfunction-associated steatotic liver disease; HbA1c = glycated hemoglobin; TG = triglycerides; HDL-C = high-density lipoprotein cholesterol; AIP = Atherogenic Index of Plasma; CRP = C-reactive protein.
| Early atherognesis | Advanced atherogenesis | p-value | |
| CIMT < 0.7 (n = 18) | CIMT ≥ 0.7 (n = 7) | ||
| Weight (kg) | 73.4 ± 18.0 | 70.0 ± 10.6 | 0.4 |
| BMI (kg/m2) | 30.0 ± 5.24 | 29.0 ± 4.43 | 0.46 |
| WC (cm) | 90.5 ± 7.5 | 96.5 ± 2.89 | 0.48 |
| MASLD | 8 (44.4) | 7 (100) | 0.01 |
Table 2: Representative anthropometric characteristics according to carotid intima-media thickness. Representative anthropometric characteristics and MASLD prevalence stratified according to carotid intima-media thickness (CIMT). Participants were classified as having early subclinical atherosclerosis (CIMT <0.7 mm) or increased subclinical atherosclerosis (CIMT ≥0.7 mm). Continuous variables are presented as mean ± standard deviation, and categorical variables are presented as n (%). Group comparisons were performed using the Student's t-test, Mann–Whitney U test, or chi-square test, as appropriate. Abbreviations: BMI = body mass index; WC = waist circumference; CIMT = carotid intima-media thickness.
Supplementary File 1: The raw data used for the analyses described in this study. Please click here to download this file.
Discussion
The methods described herein provide a standardized workflow to investigate whether cardiometabolic and atherogenic burden are associated with metabolic dysfunction-associated steatotic liver disease (MASLD), based on the hypothesis that liver-related metabolic dysfunction contributes to early atherogenesis27,28. The proposed workflow establishes standardized procedures for participant selection, dietary assessment, biomarker quantification, cardiovascular imaging, quality control, and data validation to improve methodological consistency and reproducibility. Whenever possible, all measurements are performed using identical equipment, standardized acquisition parameters, trained personnel, duplicate verification, and blinded image analysis to minimize operator-dependent variability across investigators and institutions. Dietary assessment using a structured, image-supported food frequency questionnaire (FFQ) is a critical component because DII calculation depends on the accuracy of self-reported dietary intake. The use of standardized reference portions and visual aids reduces recall bias and improves inter-individual comparability29,30. Likewise, estimation of the Dietary Inflammatory Index (DII) using the global reference database of 45 dietary parameters enables standardized assessment of dietary inflammatory potential across different populations8,9. Misclassification of dietary intake at this stage may attenuate associations with cardiometabolic outcomes. Furthermore, integrating biochemical markers, echocardiographic assessment of left ventricular diastolic function (E/e′), and carotid intima-media thickness (CIMT) provides a comprehensive evaluation of early cardiometabolic risk. Strict adherence to guideline-recommended protocols minimizes operator-dependent variability and ensures reliable and reproducible cardiovascular measurements12,15,22.
It is important to emphasize that the DII is intended to characterize inter-individual variability in dietary inflammatory potential, rather than to diagnose MASLD or to independently predict cardiometabolic disease. Consequently, not all individuals with MASLD are expected to exhibit elevated DII scores, and a high DII does not necessarily indicate advanced cardiometabolic abnormalities. Instead, this protocol uses the DII as a stratification variable to investigate whether an increase in dietary inflammatory burden is associated with progressive subclinical cardiovascular alterations across the MASLD spectrum. To enhance feasibility, the protocol incorporates a population-adapted FFQ that facilitates implementation in clinical settings. Although comprehensive dietary instruments capture a broader range of nutrients, simplified FFQs have demonstrated acceptable validity for estimating DII and diet-related inflammatory patterns31.
The protocol also incorporates standardized quality-control procedures to improve reproducibility during laboratory and imaging assessments. Standardized blood collection, timely sample processing, appropriate storage conditions, coded sample identification, duplicate laboratory measurements, and inclusion of quality-control samples minimize analytical variability. Likewise, standardized patient positioning, Doppler alignment, acquisition planes, and averaging multiple cardiac cycles reduce variability in echocardiographic measurements, whereas bilateral CIMT assessment using a standardized plaque-free far-wall common carotid segment and independent, blinded image review improves vascular measurement reproducibility. This workflow is adaptable to different research environments, allowing centers with limited laboratory infrastructure to implement dietary assessment, anthropometric evaluation, and ultrasound-based cardiovascular assessment before incorporating additional molecular or inflammatory biomarkers, guided by available resources and study objectives.
An additional strength of this workflow is its ability to identify participants with discordant phenotypes, such as individuals with a highly pro-inflammatory dietary pattern but no evidence of cardiometabolic abnormalities or, conversely, those with relatively low DII values despite established cardiometabolic impairment. Such findings may provide insight into the complex interactions among dietary patterns, insulin sensitivity, visceral adiposity, physical activity, genetic and epigenetic factors, pharmacological therapy, sleep quality, and other environmental determinants of cardiometabolic health. Longitudinal studies that implement this standardized protocol may further clarify the relationship between the dietary inflammatory burden and cardiometabolic disease progression in MASLD.
Several limitations of this protocol should be considered. The cross-sectional design precludes causal inference regarding the relationship between dietary inflammatory potential and cardiometabolic injury. In addition, the DII reflects habitual dietary patterns rather than acute inflammatory responses, and self-reported dietary assessment is susceptible to recall bias32. Reliance on C-reactive protein (CRP) as a systemic inflammatory marker may underestimate subtle inflammatory changes compared with broader cytokine profiling33. Likewise, CIMT reproducibility depends on the arterial segment evaluated, wall selection, cardiac-cycle timing, and the number of measurements obtained. Therefore, continuous CIMT analysis and population-specific percentile-based interpretation are preferable, whereas the ≥0.7 mm threshold used in the representative results should be considered a predefined study-specific analytical cutoff rather than a universal clinical threshold. Importantly, this protocol is intended as an early cardiometabolic risk assessment workflow rather than a diagnostic or prognostic algorithm. Unlike conventional cardiometabolic screening approaches for patients with MASLD, which primarily rely on anthropometric measurements, blood pressure assessment, glycemic status, liver-related biochemical tests, and lipid profiling to estimate cardiovascular risk34,35, this workflow integrates five complementary domains: (i) dietary inflammatory burden quantified by the DII, (ii) biochemical cardiometabolic profiling, (iii) circulating inflammatory biomarkers, (iv) echocardiographic assessment of left ventricular diastolic function using the E/e′ ratio, and (v) CIMT as a marker of early subclinical atherosclerosis. Together, these complementary assessments provide a standardized, non-invasive, and reproducible framework for identifying early metabolic and vascular alterations before clinically overt cardiovascular disease develops, while complementing rather than replacing conventional cardiometabolic screening1,3,12,15,34,35,36,37,38,39.
Disclosures
The authors have nothing to disclose.
Acknowledgements
The authors acknowledge financial support from the Institutional Program E015.
Materials
| Name | Company | Catalog Number | Comments |
|---|---|---|---|
| ELISA assay kit | Abcam | ab65328 | ELISA Assay Kits, Colorimetric, Abcam for 96-well plates |
| Microplate reader for absorbance, Sunrise | Tecan | 30190079 | Detection Mode: Absorbance; Wavelength Range: 340 nm - 750 nm; Filter Wavelength: 405 nm, 450 nm, 492 nm, 620 nm; Plate Format 96 well plates |
| Sphygmomanometer | Homecare | ANEROIDE 1000 | 100% cotton self-adjustable bracelet with hook, Adult artery indicator cuff. |
| Ultrasound to measure CIMT | Philips | EPIQ7L12-3 Broadband Linear Array Transducer | Linear transducer (Broadband Linear Array Transducer) |
References
- Rinella ME, et al. A multisociety Delphi consensus statement on new fatty liver disease nomenclature. J Hepatol. 2023;79(6):1542-1556.
- Younossi ZM, et al. The global epidemiology of nonalcoholic fatty liver disease and nonalcoholic steatohepatitis: a systematic review. Hepatology. 2023;77(4):1335-1347.
- Byrne CD, Targher G. NAFLD: a multisystem disease. J Hepatol. 2015;62(1 Suppl).
- Paik JM, et al. Changes in the global burden of chronic liver diseases from 2012 to 2017: the growing impact of NAFLD. Hepatology. 2020;72(5):1605-1616.
- Monteiro CA, Cannon G, Lawrence M, Costa Louzada ML. Ultra-processed foods, diet quality, and health using the NOVA classification system. Food and Agriculture Organization of the United Nations; Rome; 2019.
- Schwingshackl L, et al. Adherence to healthy dietary patterns and risk of chronic diseases: an updated umbrella review of meta-analyses of prospective cohort studies. Nutrients. 2021;13(10):3395.
- Medina-Remón A, et al. Polyphenol intake from a Mediterranean diet decreases inflammatory biomarkers related to atherosclerosis: a substudy of the PREDIMED trial. Br J Clin Pharmacol. 2017;83(1):114-128.
- Shivappa N, et al. Designing and developing a literature-derived, population-based Dietary Inflammatory Index. Public Health Nutr. 2014;17(8):1689-1696.
- Shivappa N, et al. Dietary inflammatory index and cardiovascular risk and mortality: a meta-analysis. Nutrition. 2019;59:56-64.
- Vissers LET, et al. The relationship between the Dietary Inflammatory Index and risk of cardiovascular disease, cardiovascular mortality, and all-cause mortality: a prospective cohort study. Am J Clin Nutr. 2017;105(5):1113-1119.
- Mazidi M, et al. Dietary inflammatory index and cardiometabolic risk in US adults. Atherosclerosis. 2018;276:23-27.
- Nagueh SF, et al. Recommendations for the evaluation of left ventricular diastolic function by echocardiography: an update from the American Society of Echocardiography and the European Association of Cardiovascular Imaging. J Am Soc Echocardiogr. 2016;29(4):277-314.
- Paulus WJ, Tschöpe C. A novel paradigm for heart failure with preserved ejection fraction: comorbidities drive myocardial dysfunction and remodeling through coronary microvascular endothelial inflammation. J Am Coll Cardiol. 2013;62(4):263-271.
- Lorenz MW, et al. Prediction of clinical cardiovascular events with carotid intima-media thickness: a systematic review and meta-analysis. Circulation. 2007;115(4):459-467.
- Touboul PJ, et al. Mannheim carotid intima-media thickness and plaque consensus (2004-2006-2011): an update on behalf of the Advisory Board of the 3rd, 4th and 5th Watching the Risk Symposia. Cerebrovasc Dis. 2012;34(4):290-296.
- Dobiásová M. Atherogenic index of plasma [log(triglycerides/HDL-cholesterol)]: theoretical and practical implications. Clin Chem. 2004;50(7):1113-1115.
- Niroumand S, et al. Atherogenic index of plasma: a marker of cardiovascular disease. Med J Islam Repub Iran. 2015;29:240.
- Tilg H, Moschen AR. Evolution of inflammation in nonalcoholic fatty liver disease: the multiple parallel hits hypothesis. Hepatology. 2010;52(5):1836-1846.
- Francque SM, et al. Non-alcoholic fatty liver disease: a patient guideline. JHEP Rep. 2021;3(5):100322.
- Denova-Gutiérrez E, et al. Validity of a food frequency questionnaire to assess food intake in Mexican adolescent and adult population. Salud Publica Mex. 2016;58(6):617-628.
- Denova-Gutiérrez E, et al. Relative validity of a food frequency questionnaire to identify dietary patterns in an adult Mexican population. Salud Publica Mex. 2016;58(6):608-616.
- Lang RM, et al. Recommendations for cardiac chamber quantification by echocardiography in adults: an update from the American Society of Echocardiography and the European Association of Cardiovascular Imaging. Eur Heart J Cardiovasc Imaging. 2015;16(3):233-270.
- Cohen J. Statistical power analysis for the behavioral sciences. 2nd ed. Lawrence Erlbaum Associates; Hillsdale, NJ; 1988.
- Shapiro SS, Wilk MB. An analysis of variance test for normality: complete samples. Biometrika. 1965;52(3-4):591-611.
- Benjamini Y, Hochberg Y. Controlling the false discovery rate: a practical and powerful approach to multiple testing. J R Stat Soc Series B Stat Methodol. 1995;57(1):289-300.
- Greenland S, Pearce N. Statistical foundations for model-based adjustments. Annu Rev Public Health. 2015;36:89-108.
- Targher G, et al. Increased prevalence of cardiovascular disease in type 2 diabetic patients with non-alcoholic fatty liver disease. Diabet Med. 2006;23(4):403-409.
- Lonardo A, et al. Hypertension, diabetes, atherosclerosis and NASH: Cause or consequence J Hepatol. 2018;68(2):335-352.
- Willett W. Nutritional epidemiology. 3rd ed. Oxford University Press; New York; 2013.
- Thompson FE, Subar AF. Dietary assessment methodology. In: Coulston AM, Boushey CJ, Ferruzzi MG, Delahanty LM, editors. Nutrition in the prevention and treatment of disease. 4th ed. Academic Press; London; 2017:5-48.
- Cavicchia PP, et al. A new dietary inflammatory index predicts interval changes in serum high-sensitivity C-reactive protein. J Nutr. 2009;139(12):2365-2372.
- Freedman LS, et al. Pooled results from 5 validation studies of dietary self-report instruments using recovery biomarkers for energy and protein intake. Am J Epidemiol. 2014;180(2):172-188.
- Pearson TA, et al. Markers of inflammation and cardiovascular disease: application to clinical and public health practice: a statement for healthcare professionals from the Centers for Disease Control and Prevention and the American Heart Association. Circulation. 2003;107(3):499-511.
- European Association for the Study of the Liver, European Association for the Study of Diabetes, European Association for the Study of Obesity. EASL-EASD-EASO clinical practice guidelines on the management of metabolic dysfunction-associated steatotic liver disease. J Hepatol. 2024;81(3):492-542.
- Arnett DK, et al. 2019 ACC/AHA guideline on the primary prevention of cardiovascular disease: a report of the American College of Cardiology/American Heart Association Task Force on Clinical Practice Guidelines. Circulation. 2019;140(11).
- Ruiz-Canela M, Bes-Rastrollo M, Martínez-González MA. The role of dietary inflammatory index in cardiovascular disease, metabolic syndrome and mortality. Curr Cardiol Rep. 2016;18(7):60.
- Targher G, Day CP, Bonora E. Risk of cardiovascular disease in patients with nonalcoholic fatty liver disease. N Engl J Med. 2010;363(14):1341-1350.
- Calder PC, et al. Dietary factors and low-grade inflammation in relation to overweight and obesity. Br J Nutr. 2011;106(Suppl 3).
- Estruch R, et al. Primary prevention of cardiovascular disease with a Mediterranean diet supplemented with extra-virgin olive oil or nuts. N Engl J Med. 2018;378(25).
Reprints and Permissions
This article has been published
Video Coming Soon