SNRNP70 shows potential as a diagnostic marker for osteoarthritis (OA), with consistently lower expression in OA tissues than in controls. It may also exert anti‑inflammatory effects, suggesting a therapeutic avenue. Future mechanistic studies could help advance OA management.
Research Article
SNRNP70 is Associated with Focal Adhesion-Related Signatures and Chondrocyte Inflammation in Osteoarthritis
* These authors contributed equally
In This Article
Summary
Abstract
Osteoarthritis (OA) is a degenerative joint disease marked by progressive cartilage breakdown and synovial inflammation, yet the key molecular drivers of its pathogenesis remain incompletely understood. Here, the examination was conducted as to whether SNRNP70—a core component of the U1 snRNP complex essential for pre‑mRNA splicing—contributes to OA progression. Analysis of ten public transcriptomic datasets showed that SNRNP70 was consistently downregulated in OA cartilage compared with normal controls. A meta‑analysis further indicated good diagnostic accuracy for OA, with a pooled AUC of 0.92. In primary rat chondrocytes stimulated with interleukin‑1β (IL‑1β), SNRNP70 expression was suppressed under inflammatory conditions. Forced expression of SNRNP70 not only reduced the production of pro‑inflammatory mediators (IL‑6 and MMP‑13) but also restored key extracellular matrix (ECM) components (ACAN and COL2A1) and promoted chondrocyte migration and wound healing. Pearson's correlation, followed by KEGG enrichment, indicated that focal adhesion signaling was a pathway associated with SNRNP70 regulation. Rescue experiments supported the notion that SNRNP70 enhances chondrocyte reparative capacity, at least in part, by activating this pathway. Together, these findings suggest that SNRNP70 may serve as a previously unrecognized regulator of inflammatory chondrocyte function and cartilage homeostasis. They also raise the possibility of a mechanistic link between spliceosome activity and focal adhesion‑mediated matrix synthesis, warranting further evaluation of SNRNP70 as a candidate diagnostic marker or therapeutic target in OA.
Introduction
Osteoarthritis (OA) represents a prevalent joint ailment that predominantly afflicts individuals aged 65 and older, impacting approximately 7% of the global population1,2. Astonishingly, between 1990 and 2019, the worldwide prevalence of OA surged by a staggering 113.25%, increasing from 247.51 million cases to 527.81 million3. OA is principally characterized by the insidious progression of degenerative changes within joint tissues, prominently featuring cartilage degradation and synovial inflammation4,5,6. Notably, mechanical overloading and the inexorable march of time have been established as the two most pronounced risk factors contributing to its pathogenesis7,8. Additionally, an increasing number of studies underscore the pivotal role played by meniscal degeneration as an integral element in the intricate pathology of OA9. Prior investigations have compellingly demonstrated that meniscal lesions afflict 68% to 90% of OA patients10,11.
At the molecular level, a growing body of evidence indicates that OA is not merely a consequence of biomechanical stress and aging, but also a disease driven by complex alterations in gene regulation and post-transcriptional control12,13,14. Among these mechanisms, the spliceosome has garnered escalating attention across various disease contexts. Intriguingly, while it has been the focus of extensive research in the pathogenesis of inflammation, the role of the spliceosome in OA has remained notably understudied15,16,17. In essence, the spliceosome can be conceptualized as a protein-directed metal ribozyme18,19. Among these mechanisms, RNA splicing has emerged as a critical determinant of chondrocyte phenotype and ECM homeostasis. Precise splicing ensures the correct expression of structural and signaling proteins essential for cartilage integrity, whereas aberrant splicing can disrupt ECM turnover, promote catabolic pathways, and accelerate cartilage degeneration20,21,22.
Recent studies have highlighted spliceosomal proteins as key regulators of joint tissue homeostasis, yet the role of these proteins in OA pathogenesis remains largely unexplored23. In particular, SNRNP70, a core component of the U1 small nuclear ribonucleoprotein complex, governs the recognition of 5′ splice sites during pre-mRNA processing and thereby influences the inclusion or exclusion of specific exons24,25. Dysregulation of SNRNP70 has been implicated in various pathological conditions, but its contribution to cartilage degeneration has not been previously characterized. One potential target of spliceosome-mediated regulation is focal adhesion kinase (FAK), a central signaling molecule that integrates mechanical and biochemical cues to control chondrocyte adhesion, cytoskeletal dynamics, survival, and mechantransduction26. Enhanced FAK activity has been linked to increased focal adhesion signaling, which in turn promotes ECM synthesis and upregulation of key cartilage-specific proteins, including aggrecan (ACAN) and collagen type II alpha 1 (COL2A1)27,28. These proteins are indispensable for maintaining cartilage structure and function, and their downregulation is a hallmark of OA progression.
Despite advances in transcriptional and epigenetic research in OA, the role of spliceosome-mediated FAK regulation in controlling focal adhesion signaling and ECM metabolism remains poorly defined. Based on these observations, it was reasoned that SNRNP70 could affect chondrocyte behavior and ECM homeostasis by modulating FAK alternative splicing and, downstream, focal adhesion signaling. To test this idea, the first question was whether SNRNP70 expression is altered in OA; its potential as a diagnostic marker was evaluated, and its possible links to inflammatory responses and focal adhesion-related pathways in chondrocytes were explored.
Protocol
The animal study protocol was approved by the Ethics Committee of Guangxi Medical University and Guangxi Medical University First Affiliated Hospital (protocol code 202109001, NO.2022-KY-E-252).
CAUTION: All procedures must follow institutional and national animal care guidelines. Trained personnel must wear PPE (gloves, masks, lab coats) when handling animals or samples. Surgeries require adequate anesthesia and postoperative monitoring. Report adverse events (bleeding, infection, behavioral changes) promptly. Dispose of carcasses and contaminated materials properly. Conduct regular facility inspections to ensure compliance. The commercial details of the animals, reagents, and equipment used in this study are listed in the Table of Materials.
Patients and gene expression datasets
To investigate the expression patterns of SNRNP70 in OA, publicly available RNA-sequencing (RNA-seq) and microarray datasets were systematically retrieved from the Gene Expression Omnibus (GEO) database (https://www.ncbi.nlm.nih.gov/geo/)21. The search strategy incorporated the following keywords: “SNRNP70 OR RPU1 OR Snp1 OR U1AP OR U170K OR U1RNP OR RNPU1Z OR SNRP70 OR U1-70K” combined with “OA.” Inclusion criteria were defined as follows:(i) datasets derived from human samples; (ii) studies specifically focusing on OA, with rheumatoid arthritis and other inflammatory joint diseases excluded; (iii) availability of at least three independent biological replicates in both OA and normal control (NC) groups, thereby enabling the computation of standardized mean differences (SMD). Data processing workflow: After identifying eligible datasets, the raw expression data and corresponding clinical metadata were downloaded. For microarray datasets, probe-level data were normalized using the robust multi-array average (RMA) algorithm, and probes were annotated to official gene symbols using the platform annotation files. For RNA-seq datasets, raw counts were converted to transcripts per million (TPM) values, then log2-transformed to ensure comparability across datasets. When multiple probes mapped to the same gene, the probe with the highest expression variance across samples was retained. Quality control and harmonization: To minimize batch effects across different studies, the ComBat function from the "sva" R package was applied. Principal component analysis (PCA) was performed both before and after correction to evaluate the effectiveness of batch effect removal. Datasets that exhibited poor quality, incomplete annotations, or failed to distinguish between OA and NC groups were excluded from further analysis.
Identification of differentially expressed SNRNP70 in OA and normal cartilage tissues
To evaluate the differential expression of SNRNP70 between OA and normal cartilage (NC) tissues, a multi-step analytical approach was employed. First, expression data for SNRNP70 were extracted from available datasets. Statistical comparisons between OA and NC groups were performed using Student’s t-test to determine whether mean expression levels differed significantly. To further assess the discriminatory power of SNRNP70, receiver operating characteristic (ROC) curves were generated using GraphPad Prism 8.0 and the Sangerbox platform (http://vip.sangerbox.com/). The area under the curve (AUC) was calculated to quantify the diagnostic efficiency of SNRNP70 expression levels.
Next, a meta-analysis was conducted using Stata 14.0 to integrate findings across multiple datasets. Statistical heterogeneity was evaluated using the Cochran’s Q test and the I2 statistic. When heterogeneity was low (p > 0.01 and I2 < 50%), a fixed-effects model was applied; otherwise, a random-effects model was adopted. The standardized mean difference (SMD) with its corresponding 95% confidence interval (CI) was calculated to quantify differential SNRNP70 expression between OA and NC tissues. For diagnostic accuracy, a diagnostic meta-analysis was performed using the Midas module in Stata. This analysis estimated pooled sensitivity, specificity, positive likelihood ratio (PLR), negative likelihood ratio (NLR), and diagnostic odds ratio (DOR) for SNRNP70. In addition, a summary receiver operating characteristic (sROC) curve was constructed to provide an overall assessment of diagnostic performance. Finally, sensitivity analyses were performed by sequentially excluding individual datasets to evaluate the robustness and stability of the pooled results. Potential publication bias was assessed using Deeks’ funnel plot asymmetry test. Using this integrated analytical framework, the expression patterns and diagnostic potential of SNRNP70 in OA tissues compared with NC tissues were systematically evaluated.
Cell isolation and culture
Primary chondrocytes were isolated from the articular cartilage of postnatal day 2 Sprague–Dawley rats. A total of six neonatal rats were used for each isolation. Since the animals were collected at an early postnatal stage, sex was not determined. For each independent cell preparation, cartilage tissues from all six rats were harvested and pooled before culture. Each independently isolated chondrocyte preparation—derived from a separate set of animals—was treated as one biological replicate. Technical replicates, including repeated wells or repeated qRT-PCR reactions from the same cell preparation, were not considered independent biological replicates.
In brief, neonatal rats were euthanized under sterile conditions, and the knee joints were dissected to expose the articular cartilage. Cartilage tissue was carefully separated from the subchondral bone using microsurgical scissors, minced into fragments of approximately 1 mm³, and then sequentially digested with enzymes. The tissue fragments were first incubated with 0.25% trypsin–EDTA for 30 min at 37 °C to remove residual connective tissue. After washing with phosphate-buffered saline, the remaining fragments were digested with 0.2% collagenase type II in serum-free DMEM for 4–6 h at 37 °C with gentle agitation. The resulting cell suspension was filtered through a 70 μm cell strainer, centrifuged at 300 × g for 5 min, and resuspended in complete DMEM supplemented with 10% fetal bovine serum, 100 U/mL penicillin, and 100 μg/mL streptomycin. Cells were seeded into culture flasks and maintained at 37 °C in a humidified incubator with 5% CO₂. The medium was changed every 2–3 days. Only passage 1 or 2 chondrocytes were used for subsequent experiments to minimize dedifferentiation.
Chondrocyte identity and purity were confirmed before experimental use. Morphologically, primary cells showed a typical polygonal or cobblestone-like chondrocyte appearance under phase-contrast microscopy. At the molecular level, chondrocyte identity was verified by the expression of cartilage-associated markers, including COL2A1 and ACAN, using a Western blot. For the in vitro inflammatory model, primary chondrocytes were stimulated with recombinant rat interleukin-1β (IL-1β) at 10 ng/mL for 48 h. Untreated cells cultured under identical conditions served as the normal control group. For SNRNP70 overexpression experiments, chondrocytes from independent biological preparations were transfected separately, and each biological replicate was processed independently throughout transfection, IL-1β stimulation, RNA/protein extraction, and statistical analysis.
Real-time quantitative PCR (qRT-PCR)
Total RNA was isolated from subconfluent chondrocyte cultures (~80% confluency) using the RNAfast200 kit. RNA purity was assessed on a NanoDrop 2000, accepting only samples with an A260/280 ratio of 1.8–2.0, and integrity was confirmed by 1% agarose gel electrophoresis. First-strand cDNA was reverse-transcribed from 1 µg of total RNA using the qPCR RT Kit in a 20 µL reaction containing random primers and dNTPs. The thermal profile for reverse transcription was 42 °C for 30 min, followed by 95 °C for 5 min. qPCR was performed with a SYBR Green-based premix on a real-time PCR system. Each 20 µL reaction consisted of 10 µL SYBR Green Master Mix, 0.5 µL each of forward and reverse primers (10 µM), 2 µL cDNA, and 7 µL nuclease-free water. Cycling conditions were: 95 °C for 30 s, then 40 cycles of 95 °C for 5 s and 60 °C for 30 s. Melt curve analysis was run post-amplification to verify single-product specificity. GAPDH served as the internal reference, and relative expression was calculated by the 2−ΔΔCt method. Reactions were performed in triplicate with three independent biological replicates. Primer sequences are listed in Table 1.
Western blot
Protein expression of ACAN, COL2A1, and MMP13 was evaluated in chondrocytes following IL-1β treatment and SNRNP70 overexpression. Cells were washed twice with ice-cold phosphate-buffered saline (PBS) and lysed in RIPA buffer containing protease and phosphatase inhibitors. Lysates were incubated on ice for 30 min with periodic vortexing, then centrifuged at 12,000 × g for 15 min at 4 °C. Protein concentrations in the cleared supernatants were determined using a BCA kit. Equal amounts of protein (30 µg per lane) were separated by 10% SDS-PAGE and transferred to PVDF membranes by wet transfer. Membranes were blocked with 5% non-fat milk in TBST at room temperature for 1 h, then probed overnight at 4 °C with primary antibodies against ACAN (1:1000), COL2A1 (1:1000), or MMP13 (1:1000). After three TBST washes (10 min each), membranes were incubated with HRP-conjugated secondary antibodies (1:5000) for 1 h at room temperature. Signal was developed using ECL reagent and captured on a ChemiDoc XRS+ system. Band densitometry was performed with ImageJ, and all target protein signals were normalized to GAPDH as the loading control. Data are presented as relative protein levels versus the control group.
Transfection
Chondrocytes were transfected with an SNRNP70 overexpression plasmid (oe-SNRNP70) once the cultures reached about 80% confluence. For transfection, cells were seeded into 6-well plates at 2 × 10⁵ cells per well and left to attach overnight in standard growth medium (DMEM supplemented with 10% fetal bovine serum and 1% penicillin/streptomycin) at 37 °C in 5% CO₂. Transfections were carried out using LipoFiter 3.0 following the manufacturer’s instructions. Briefly, 2–3 µg of plasmid DNA per well was diluted in 100 µL of serum-free medium and mixed with the appropriate amount of lipid reagent. The DNA-lipid complexes were incubated for 15–20 min at room temperature to allow complex formation, then gently added to each well containing chondrocytes in fresh, serum-free medium. After 6 hours, the medium was replaced with complete growth medium to reduce cytotoxicity.
Transfection efficiency and SNRNP70 expression were assessed 48–72 hours after transfection. SNRNP70 mRNA levels were measured by quantitative real-time PCR (qRT-PCR), with GAPDH as the internal control. Protein expression was evaluated using the Simple Western Automated Western Blot System according to the manufacturer’s protocol. In brief, cell lysates were prepared, protein concentrations were measured, and samples were loaded onto capillary cartridges for automated separation and immunodetection with anti-SNRNP70 antibodies. Transfection efficiency was calculated by comparing SNRNP70 expression in oe-SNRNP70-transfected cells to that in control cells transfected with the empty vector.
Immunofluorescence
Immunofluorescence was used to examine IL-6 and MMP-13 protein levels in oe-SNRNP70 chondrocytes after IL-1β stimulation. Briefly, cells were seeded onto sterile glass coverslips in 24-well plates and cultured under standard conditions until they reached 70–80% confluence. They were then fixed with 4% paraformaldehyde for 15 min at room temperature and washed three times with PBS. For permeabilization, 0.1% Triton X-100 in PBS was applied for 10 min at room temperature. Nonspecific binding sites were blocked by incubating the cells in 5% bovine serum albumin (BSA) in PBS for 1 h at room temperature.
After blocking, cells were incubated overnight at 4 °C with primary antibodies against IL-6 and MMP-13 (diluted 1:200 in 1% BSA/PBS). Following three washes with PBS to remove unbound primary antibodies, cells were incubated with species-specific fluorophore-conjugated secondary antibodies (diluted 1:500) for 1 h at room temperature in the dark. Nuclei were counterstained with 4′,6-diamidino-2-phenylindole (DAPI) for 5 min. Coverslips were mounted onto glass slides with antifade mounting medium, and fluorescence images were captured using a fluorescence microscope at 20× magnification. For quantitative analysis, 10 randomly selected cells per sample were analyzed in ImageJ to measure fluorescence intensity of the target proteins. The mean fluorescence intensity was calculated for each group and used for statistical comparison.
Cell scratch wound-closure assay
A scratch wound-closure assay was performed to evaluate chondrocyte ability to close an artificial wound gap under different treatment conditions. Primary chondrocytes were seeded in 6-well plates at a density of 1 × 10⁵ cells per well and cultured until approximately 90% confluence was reached. A linear scratch was generated in the cell monolayer using a sterile 200 µL pipette tip. Detached cells were removed by washing twice with PBS, and fresh complete culture medium containing the indicated treatments was then added. Cells were assigned to the following groups: normal control, IL-1β-treated, and IL-1β plus SNRNP70 overexpression. Images of the same wound area were captured at 6 h and 12 h time points after scratching using an inverted microscope (Supplementary Figure 1). Wound closure was calculated as the percentage reduction in wound area relative to the initial wound area at 0 h using the following formula:
wound closure (%) = [(wound area at 0 h - wound area at the indicated time point) / wound area at 0 h] × 100. (1)
Statistical analysis
All quantitative data are presented as the mean ± standard deviation (SD) from three independent biological replicates (n = 3) unless otherwise stated. Statistical analyses were performed using GraphPad Prism 8.0. For comparisons between two groups, an unpaired Student’s t-test was used. Statistical significance was indicated as follows: *p < 0.05 and **p < 0.01.
Results
SNRNP70 expression in articular cavity tissues
To comprehensively investigate the role of SNRNP70 in OA, a systematic screening of 10 publicly available RNA-seq and microarray datasets that met strict inclusion and exclusion criteria was conducted (Table 2). SNRNP70 expression levels were carefully extracted and analyzed across these datasets. Strikingly, in 6 of 10 cohorts, SNRNP70 expression was significantly downregulated in OA tissues compared with normal controls (p < 0.05), suggesting a consistent pattern of transcriptional suppression (Figure 1).
Of note, three datasets (GSE114007, GSE169077, and GSE19060) did not reveal statistically significant differences between OA and control samples. Rather than disregarding these discrepancies, batch correction and dataset integration strategies were leveraged to enhance the robustness and reliability of the analysis. Specifically, datasets derived from identical sequencing platforms were merged to increase statistical power. For example, GSE114007 was combined with GSE89408 to generate GSE114007-89408, while GSE169077, GSE12021, and GSE55457 were merged into GSE169077-12021-55457 (Figure 1). This integrative approach minimized inter-study variability and strengthened the reproducibility of the findings. In summary, analyses of human datasets reveal consistent downregulation of SNRNP70 in OA articular tissues, suggesting its potential as a diagnostic biomarker. However, whether this decrease directly drives splicing dysregulation or cartilage degeneration in humans is unclear and awaits verification, preferably in human tissue models.
Clinical diagnostic ability of SNRNP70
To rigorously evaluate the diagnostic value of SNRNP70 in OA, a comprehensive meta-analysis was conducted integrating data from 165 OA samples and 125 normal controls. This represents, to the best of available knowledge, the systematic assessment of SNRNP70 as a potential diagnostic biomarker in OA. The heterogeneity analysis revealed significant heterogeneity across datasets (I2 = 72.9%; p = 0.001), necessitating a random-effects model. The pooled analysis demonstrated a robust and consistent reduction of SNRNP70 expression in OA tissues compared with normal controls, with a standardized mean difference (SMD) of -1.07 (95% CI: -1.34 to -0.80) (Figure 2A–B). Beyond expression profiling, the diagnostic performance of SNRNP70 was further evaluated. The pooled diagnostic test results revealed a combined sensitivity of 0.82 (95% CI: 0.57–0.94) and specificity of 0.88 (95% CI: 0.73–0.95), underscoring its strong discriminatory capacity (Figure 3A). Consistently, the summary receiver operating characteristic (SROC) curve yielded an area under the curve (AUC) of 0.92 (95% CI: 0.90–0.94), further highlighting the high accuracy of SNRNP70 in distinguishing OA patients from healthy individuals (Figure 3B).
To ensure the robustness of these findings, sensitivity analysis was conducted, confirming that sequential exclusion of individual datasets did not materially alter the overall effect size (Figure 4A). Importantly, both Deek’s funnel plot asymmetry test (p = 0.41) and Egger’s test indicated no significant publication bias, reinforcing the credibility of the results (Figure 4B). Together, these data show that SNRNP70 expression is reduced in OA and suggest that it could serve as a diagnostic biomarker. That said, the heterogeneity across datasets and the absence of an independent validation cohort warrant caution. These findings are therefore regarded as preliminary, pending further studies to clarify the clinical usefulness of SNRNP70 in OA diagnosis and management.
SNRNP70 modulation of inflammatory gene expression in OA
To delineate the regulatory role of SNRNP70 in inflammatory signaling during OA progression, an in vitro OA model was initially established by exposing chondrocytes to IL-1β, a well-characterized pro-inflammatory cytokine. qRT-PCR analysis performed after 48 h of IL-1β stimulation revealed a significant downregulation of SNRNP70 mRNA levels compared to the NC group (Figure 5). This suppression of SNRNP70 expression under inflammatory conditions was consistent with transcriptomic data from publicly available OA datasets, thereby providing robust evidence that SNRNP70 is consistently repressed in OA-associated inflammation. To further investigate whether restoring SNRNP70 expression could modulate chondrocyte inflammatory phenotype, cells were transfected using an SNRNP70 overexpression plasmid (oe-SN). Remarkably, enforced expression of SNRNP70 substantially alleviated IL-1β-induced inflammation, as reflected by both transcriptional and translational changes. Specifically, qRT-PCR showed a robust reduction in IL-6 and MMP-13 mRNA levels in the oe-SN group compared with IL-1β-treated controls (Figure 5).
In addition to these molecular findings, immunofluorescence staining provided direct cellular evidence of SNRNP70’s anti-inflammatory potential. In IL-1β-treated cells, IL-6 exhibited pronounced cytoplasmic accumulation, consistent with an activated inflammatory state. Strikingly, overexpression of SNRNP70 led to a notable attenuation of IL-6 cytoplasmic staining intensity (Figure 6A), thereby highlighting its ability to reverse the inflammatory response at the cellular level. A similar pattern was observed for MMP-13, where IL-1β treatment enhanced its expression, but SNRNP70 overexpression markedly suppressed MMP-13 localization and signal intensity (Figure 6B).
Unlike previous investigations that focused mainly on structural cartilage damage, the in vitro data from rat chondrocytes suggest that SNRNP70 acts as a regulator of inflammatory gene expression. Specifically, enforced expression of SNRNP70 attenuated IL-1β-driven pro-inflammatory mediators, including IL-6 and MMP-13, in this rat model. Importantly, because these experiments were conducted exclusively in a rat inflammatory model, they do not directly recapitulate the human dataset findings. Nonetheless, these results offer a conceptual framework, indicating that SNRNP70 may function not only as a splicing factor but also as a potential modulator of inflammation—a possibility that merits further exploration in human tissues.
Identification of SNRNP70-related pathways in OA
To explore biological pathways associated with SNRNP70 expression in osteoarthritis, Pearson correlation analysis was performed separately in the GSE98918, GSE117999, GSE129147, GSE51588, GSE169077_12021_55457, GSE114007-89408, and GSE82107-19060 public transcriptomic datasets. Genes with an absolute correlation coefficient (|r|) > 0.8 and p < 0.05 were considered significantly correlated with SNRNP70 expression in each dataset. The union of correlated genes across all datasets was generated, yielding 929 SNRNP70-related genes.
KEGG pathway enrichment analysis was subsequently conducted using the clusterProfiler package, with adjustments for multiple testing via the Benjamini–Hochberg method. This analysis revealed significant enrichment of the identified genes in several pathways, including the focal adhesion pathway (Figure 7). This signaling cascade is known to regulate chondrocyte adhesion, mechanotransduction, and ECM remodeling, all of which are key processes in OA progression. Together, these findings suggest a link between SNRNP70 expression and focal adhesion-related gene expression signatures in OA datasets.
SNRNP70 mediates inflammatory chondrocyte repair via the focal adhesion pathway
To evaluate the role of SNRNP70 in the wound-healing ability of inflammatory chondrocytes, a scratch wound-closure assay was performed using primary chondrocytes. Cells were assigned to three groups: normal control, IL-1β-treated, and IL-1β plus SNRNP70 overexpression. IL-1β stimulation reduced the extent of scratch gap closure compared with the normal control group, indicating impaired wound-healing capacity under inflammatory conditions. In contrast, SNRNP70 overexpression promoted scratch gap closure in IL-1β-treated chondrocytes relative to IL-1β treatment alone (Figure 8A). Collectively, these results indicate that SNRNP70 overexpression enhances the wound-closure response of IL-1β-treated chondrocytes.
At the molecular level, Western blot analyses demonstrated that IL-1β treatment suppressed the expression of cartilage matrix proteins ACAN and COL2A1, while promoting the upregulation of the degradative enzyme MMP13. Importantly, SNRNP70 overexpression not only restored ACAN and COL2A1 levels but also significantly downregulated MMP13, thereby preserving ECM integrity (Figure 8B). Mechanistically, in vitro, the beneficial effects of SNRNP70 were closely associated with activation of the Focal adhesion signaling pathway.
Collectively, human dataset analyses reveal that SNRNP70 is downregulated in OA and that its expression correlates with genes involved in the focal adhesion pathway. In rat chondrocytes exposed to IL-1β stimulation, forced expression of SNRNP70 promotes inflammatory cell repair and ECM synthesis, and also associates with focal adhesion signaling. Although these in vitro observations from a rat model are suggestive, they do not directly substantiate the findings derived from human datasets. Nonetheless, these convergent lines of evidence support a model in which SNRNP70 contributes to human OA pathogenesis via focal adhesion signaling—a hypothesis that now awaits definitive confirmation in human tissues or in vivo models with human relevance.
DATA AVAILABILITY:
The datasets used and analyzed in this study are available from the GEO dataset (https://www.ncbi.nlm.nih.gov/geo/). All data generated or analyzed during this study have been fully presented and discussed within the manuscript. The raw data of this study are uploaded as a Supplementary File.
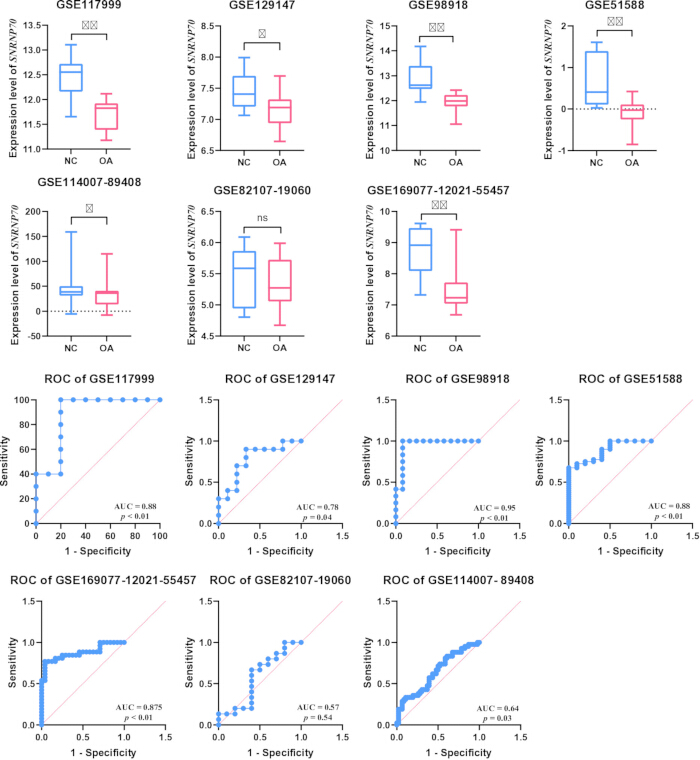
Figure 1: The students’ t-test and ROC curve for seven studies. The results suggested that SNRNP70 expression was lower in OA tissues than in NC tissues in GSE117999, GSE129147, GSE98918, GSE51558, GSE114007-89408, and GSE169077-12021-55457 (p < 0.05), and the ROC AUC indicated high feasibility. p < 0.05 (*), p < 0.01(**). Please click here to view a larger version of this figure.
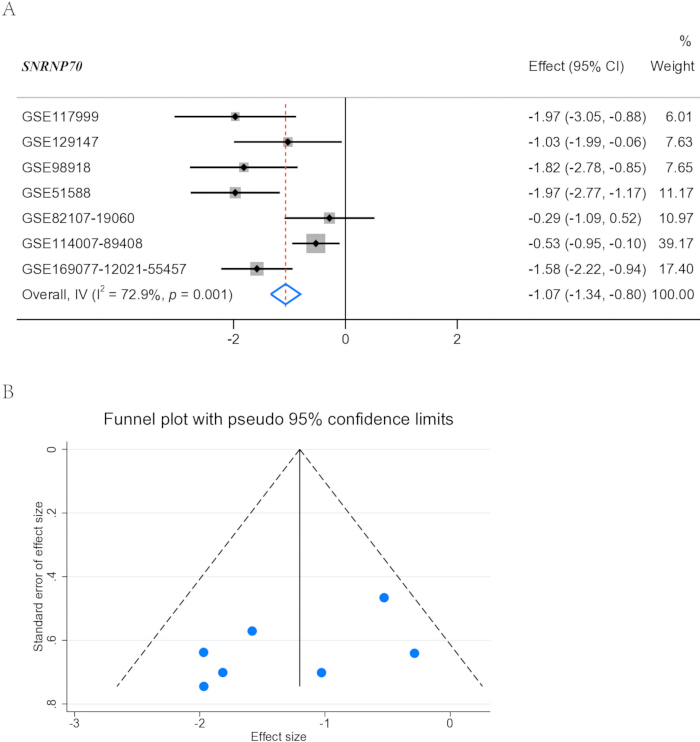
Figure 2: The meta-analysis for seven datasets. (A) The results showed that I2 = 72.9%, p = 0.001, and the overall SMD was -1.07. (B) The funnel diagram was evaluated for publication bias in the meta-analysis. It was found to be basically symmetrical. Please click here to view a larger version of this figure.
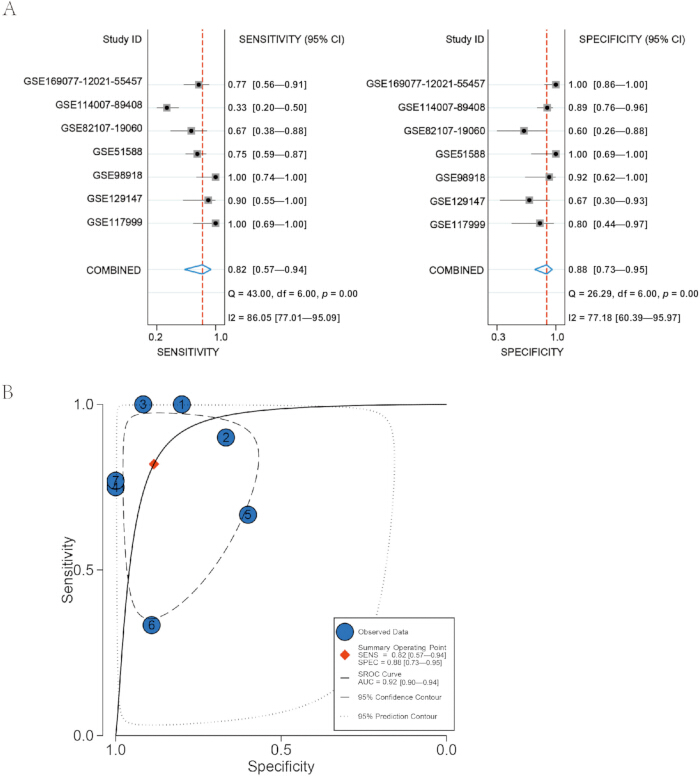
Figure 3: The diagnostic performance of SNRNP70. (A) The Q-test revealed that both sensitivity and specificity had p-values < 0.05, with I2 values of 86.05% and 77.18%, respectively, indicating substantial heterogeneity. The study reported a sensitivity of 0.82 and a specificity of 0.88, highlighting its notable performance. (B) The AUC of the sROC was 0.92, indicating a high level of confidence in the research. Please click here to view a larger version of this figure.
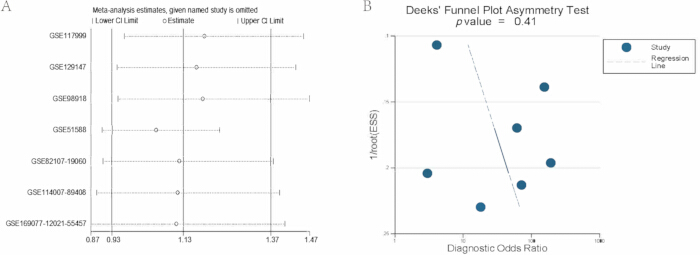
Figure 4: Influence analysis and Deek's Funnel plot. (A) The influence analysis indicated that excluding any individual study did not markedly affect the overall results. (B) Across seven studies, all results showed no significant bias (p = 0.41). Please click here to view a larger version of this figure.
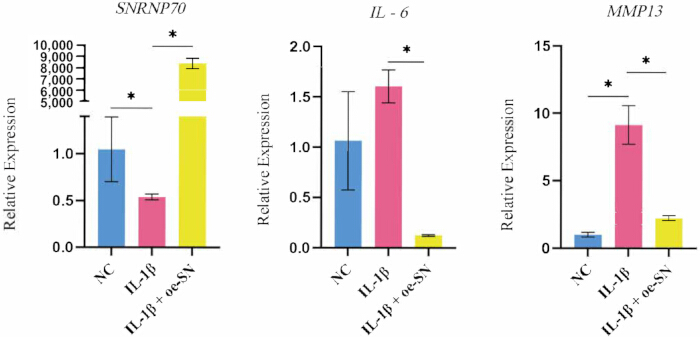
Figure 5: The qRT-PCR results indicate a significant reduction in SNRNP70 expression in chondrocytes following IL-1β treatment. In the oe-SN group, there was a notable decrease in the expression levels of the inflammatory markers IL-6 and MMP13 compared to the IL-1 group, suggesting that overexpression of SNRNP70 can reverse the inflammatory markers in chondrocytes treated with IL-1β. Data are presented as mean ± SD from n = 3 independent biological replicates. p-values < 0.05 (*), p-values < 0.01(**). Please click here to view a larger version of this figure.
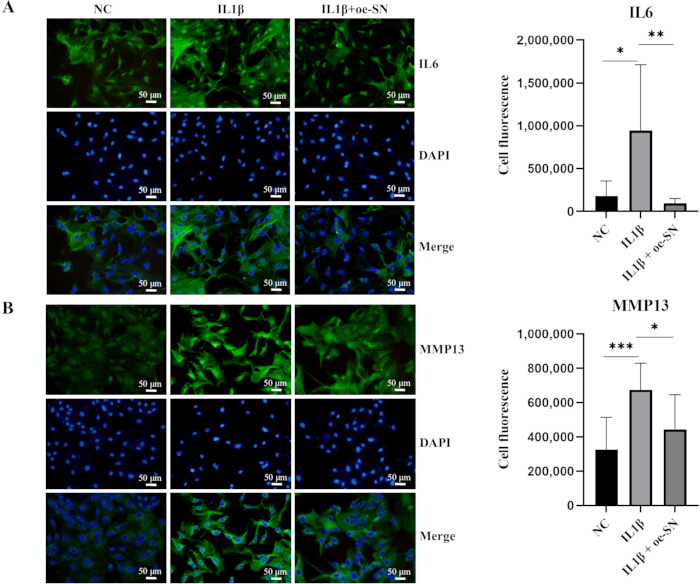
Figure 6: The IF analysis of IL-1β-treated chondrocytes following IL-1β treatment, showing the fluorescence intensity. (A) Fluorescence intensity of IL-6 and (B) MMP13 significantly increased. However, overexpression of SNRNP70 led to a marked reduction in the fluorescence intensity of the inflammatory markers IL-6 and MMP13. These results suggest that SNRNP70 overexpression may mitigate inflammation in IL-1β-treated chondrocytes. All microscopic images were taken at 10x magnification. Data are presented as mean ± SD from n = 3 independent biological replicates. p-values < 0.05 (*), p-values < 0.01(**). Scale bar = 50 µm. Please click here to view a larger version of this figure.
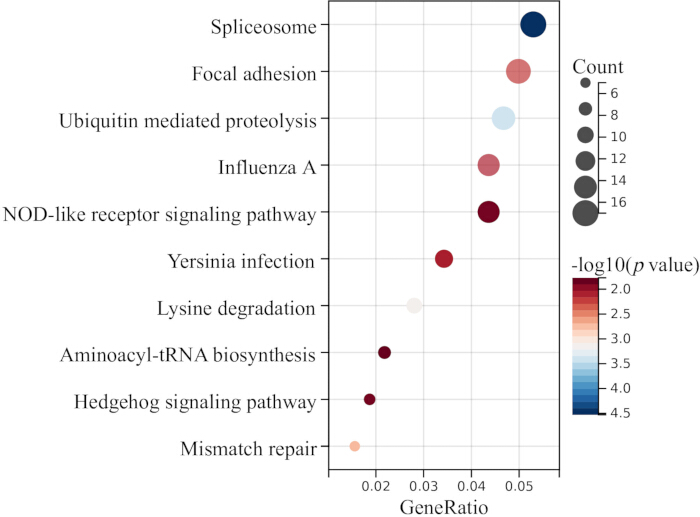
Figure 7: Correlation-based KEGG enrichment analysis of SNRNP70-associated genes in osteoarthritis datasets. Top 10 enriched pathways identified by clusterProfiler (Benjamini–Hochberg correction). Bubble size = gene count; color = significance (-log10(p value)). The focal adhesion pathway (highlighted) mediates chondrocyte adhesion, mechanotransduction, and ECM remodeling in OA. Please click here to view a larger version of this figure.
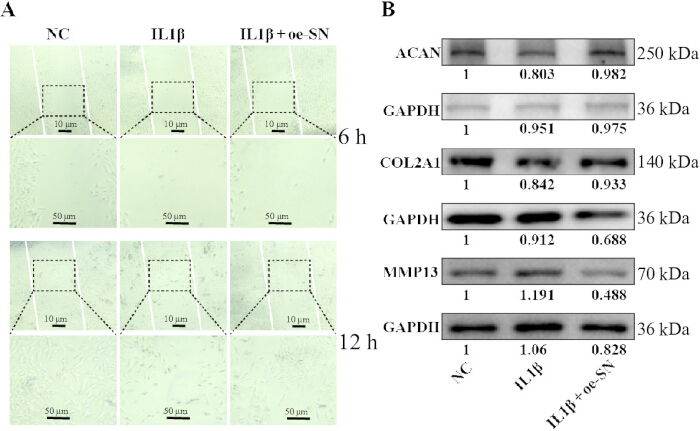
Figure 8: SNRNP70 overexpression restores ECM repair in IL-1β-treated chondrocytes. (A) Images of scratch wound closure in control, IL-1β-treated, and IL-1β plus SNRNP70-overexpression chondrocytes. (B) Representative Western blots of key cartilage matrix and catabolic proteins. Membranes were probed for ACAN, COL2A1, and MMP13. GAPDH is shown as a loading control. The magnifications are as follows: NC, IL-1β, and IL-1β+oe-SN groups: At 4x magnification: scale bar = 10 µm. At 10x magnification: scale bar = 50 µm. Please click here to view a larger version of this figure.
Supplementary Figure 1: Quantitative analysis of wound closure and Western blot densitometry. (A) Quantification of scratch-wound closure in primary chondrocytes from the NC, IL-1β, and IL-1β + oe-SNRNP70 groups. (B) Densitometric quantification of ACAN, COL2A1, and MMP13 western blot bands. Band intensities were quantified using ImageJ and normalized to GAPDH. Data are presented as mean ± SD from n = 3 independent biological replicates. *p < 0.05, **p < 0.01.Please click here to download this file.
| Target Gene | Forward primer sequence | Forward primer sequence |
| GAPDH | 5'-TCTCTGCTCCTCCCTGTTCT-3' | 5'-ATCCGTTCACACCGACCTTC-3' |
| SNRNP70 | 5'-GAGACATGCACTCCACCACG-3' | 5'-TGCGGTGCTGTGATCTTACC-3' |
| IL6 | 5'-ACAAGTCCGGAGAGGAGACT-3' | 5'-ACAGTGCATCATCGCTGTTC-3' |
| MMP13 | 5'-GGACAAAGACTATCCCCGCC-3' | 5'-GGCATGACTCTCACAATGCG-3' |
Table 1: The primers for the target genes. Forward and reverse primer sequences for GAPDH, SNRNP70, IL6, and MMP13 used in qRT-PCR are shown, all in the 5′ > 3′ orientation. GAPDH was the internal control.
| Study ID | Platform | NC (n) | OA (n) | Tissues |
| GSE114007 | GPL11154, GPL18573 | 18 | 20 | Cartilages |
| GSE117999 | GPL20844 | 10 | 10 | Cartilages |
| GSE129147 | GPL15207 | 9 | 10 | Cartilages |
| GSE169077 | GPL96 | 5 | 6 | Cartilages |
| GSE12021 | GPL96 | 13 | 20 | Synoviums |
| GSE55457 | GPL96 | 10 | 10 | Synoviums |
| GSE89408 | GPL11154 | 28 | 22 | Synoviums |
| GSE82107 | GPL570 | 7 | 10 | Synoviums |
| GSE19060 | GPL570 | 3 | 5 | Meniscus |
| GSE98918 | GPL20844 | 12 | 12 | Meniscus |
| GSE51588 | GPL13497 | 10 | 40 | Subchondral bone |
Table 2: The datasets in this study from the GEO database. Summary of 11 publicly available GEO datasets meeting inclusion criteria. For each dataset, accession ID, platform, and the numbers of normal control (NC) and osteoarthritis (OA) samples are provided, along with tissue type. n = number of samples.
Discussion
The present work suggests that SNRNP70 may function as a protective gene in the pathogenesis of OA, a multifaceted joint disorder that poses a significant global healthcare challenge29,30. This study is the first to report the role of SNRNP70 in OA. In this study, we demonstrated significant downregulation of SNRNP70 expression in OA tissues, as evidenced by analysis of GEO data (overall SMD = -1.07, 95% CI: -1.34, -0.80; Figure 2). Importantly, this finding was subsequently validated in IL-1β-treated chondrocytes. Furthermore, this study explored the role of SNRNP70 in the inflammatory response of IL-1β-treated chondrocytes. As a protective gene associated with OA, SNRNP70 exhibited the ability to impede the progression of OA by suppressing the expression of IL-1 and MMP13. To date, this is the first experimental study to report a discernible disparity in SNRNP70 expression levels between OA and NC tissues, suggesting a potential role for SNRNP70 in OA pathogenesis. This intriguing observation prompts us to consider the possible diagnostic implications of SNRNP70 in OA.
The meta-analysis we conducted, incorporating multiple RNA-seq datasets and arrays, yielded evidence of SNRNP70's potential diagnostic relevance. The SMD of -1.07 underscored the consistent downregulation of SNRNP70 in OA tissues, raising the possibility of its utility as a diagnostic candidate. ROC curve analysis further emphasized this potential, with an AUC of 0.92, indicative of robust discriminatory power. Moreover, the combined sensitivity and specificity values supported the notion that SNRNP70 may enable earlier and more accurate OA diagnosis. Beyond its diagnostic promise, SNRNP70 remains a candidate of interest in the context of OA management. The pathogenesis of OA is a multifactorial process involving mechanical overloading, aging, genetic predisposition, and inflammation31,32. Among these factors, inflammation has gained increasing recognition as a key driver of OA progression33,34. It orchestrates a cascade of events, including cartilage degradation, synovial inflammation, and altered joint homeostasis.
This study explored the anti-inflammatory potential of SNRNP70, motivated by its role as a spliceosome component35,36. Using an in vitro model, chondrocytes were treated with recombinant rat IL-1β to mimic the inflammatory microenvironment in OA joints. These findings suggest that SNRNP70 may play a role in modulating inflammation in IL-1β-stimulated chondrocytes. IF assays provided further support for SNRNP70's anti-inflammatory properties. IL-1β-treated chondrocytes exhibited increased expression of inflammatory proteins, which were attenuated by oe-SN. This modulation of inflammatory protein expression by SNRNP70 highlights a potential link to the inflammatory cascade associated with OA pathogenesis.
While this study provides observational evidence of the diagnostic and therapeutic potential of SNRNP70 in OA, the precise mechanisms underlying its effects remain an area of intrigue37. SNRNP70 is a critical component of the spliceosome, a complex involved in RNA splicing, a fundamental process in gene expression regulation. RNA splicing plays a pivotal role in gene expression by removing non-coding regions (introns) and joining coding regions (exons) of mRNA molecules, ultimately shaping the proteome38,39,40. It is plausible that the involvement of SNRNP70 in RNA splicing may impact the expression of genes associated with OA pathogenesis. The specific RNA targets and splicing events regulated by SNRNP70 in OA-affected tissues remain to be elucidated. Understanding these mechanisms may offer valuable insights into the molecular underpinnings of OA and candidate targets for further investigation. Furthermore, future research should explore the interaction of SNRNP70 with other molecules implicated in OA pathogenesis. Investigating its crosstalk with signaling pathways involved in inflammation, cartilage degradation, and joint tissue remodeling could provide a more comprehensive understanding of its multifaceted effects.
This study has certain limitations that merit consideration. While the meta-analysis incorporated a substantial number of datasets, variations in study design, patient demographics, and data processing may introduce heterogeneity. In addition, the included datasets varied in tissue origin (e.g., cartilage versus synovium) and in processing platforms, which may partly account for the inter-study heterogeneity observed (I2 = 73.3%). Furthermore, this integrative analysis was based on publicly available human datasets, whereas the functional experiments used chondrocytes isolated from neonatal rats. This cross-species discrepancy limits the extent to which in vitro findings can be directly extrapolated to human OA pathophysiology. Another caveat is the reliance on an acute IL-1β stimulation model, which captures only the early inflammatory response and does not fully recapitulate the chronic, progressive, and multifactorial nature of OA in humans. Additionally, the functional experiments were limited to gain-of-function approaches (SNRNP70 overexpression); loss-of-function experiments (e.g., SNRNP70 knockdown) were not performed, which represents a limitation of the current study. Finally, although the correlation analyses implicate SNRNP70 in the focal adhesion pathway, FAK splicing events were not directly examined, and experimental evidence that focal adhesion signaling is altered downstream of SNRNP70 was not provided. Therefore, validation in larger patient cohorts and animal models is warranted to strengthen the robustness of these findings. Moreover, the in vitro experiments utilized a cell culture model, which may not fully recapitulate the complex in vivo microenvironment of OA joints. Future studies should explore SNRNP70's effects in animal models of OA to assess its therapeutic potential in a more physiologically relevant context.
Disclosures
The authors have no conflicts of interest.
Acknowledgements
This research was funded by the Guangxi Key Research, China (GuiKe AB22035014), Special Fund of Characteristic Innovation Team of the First Affiliated Hospital of Guangxi Medical University (YYZS2022003), and the 2026 Hainan Provincial Health Science and Technology Innovation Joint Project (WSJK2026QN087).
Materials
| Name | Company | Catalog Number | Comments |
|---|---|---|---|
| Anti-aggrecan (ACAN) antibody | Abcam | ab36861 | Primary antibody, dilution 1:1000 |
| Anti-collagen type II alpha 1 (COL2A1) antibody | Abcam | ab34712 | Primary antibody, dilution 1:1000 |
| Anti-IL6 antibody | Proteintech | 21865-1-AP | Antibiotics for cell culture |
| Anti-MMP13 antibody | Proteintech | 18165-1-AP | Primary antibody, dilution 1:1000 |
| BCA protein assay kit | Thermo Fisher Scientific | 23225 | Total protein concentration determination |
| CFX96 Real-Time PCR Detection System | Bio-Rad | 1855195 | Real-time PCR detection system |
| ChemiDoc XRS+ imaging system | Bio-Rad | 1708265 | Chemiluminescence imaging system |
| Collagenase type II | Sigma-Aldrich | C6885 | Cartilage tissue digestion, 2 mg/mL |
| DAPI | Thermo Fisher Scientific | 62248 | Nuclear counterstain |
| Dulbecco’s Modified Eagle Medium/F12 | Gibco | 11320033 | Basal cell culture medium |
| ECL reagent | Thermo Fisher Scientific | 34580 | Enhanced chemiluminescence reagent |
| Fetal bovine serum | Gibco | 10082147 | 10% concentration as culture supplement |
| Fluorescent microscope | Olympus | BX53 | Immunofluorescence imaging (20x magnification) |
| GEO database | NCBI | N/A | Public RNA-seq and microarray datasets |
| GraphPad Prism 8.0 | GraphPad | N/A | ROC curve analysis |
| HRP-conjugated secondary antibodies | Santa Cruz Biotechnology | sc-516102 | Secondary antibody |
| ImageJ software | NIH | N/A | Densitometric analysis software |
| LipoFiter 3.0 | Hanbio | HB-TF3001 | Transfection reagent |
| NanoDrop 2000 | Thermo Fisher Scientific | ND-2000 | RNA purity and concentration measurement (A260/280 ratio) |
| oe-SNRNP70 | Hanbio | HB-OV5101 | Overexpression plasmid |
| Penicillin | Thermo Fisher Scientific | 15140122 | Antibiotic for cell culture |
| Primer-BLAST | NCBI | N/A | Gene-specific primer design |
| Primers (synthesized) | Sangon Biotech | N/A | Commercial synthesis of PCR primers |
| protease and phosphatase inhibitor cocktails | Roche | 4693159001 | Cocktail of protease and phosphatase inhibitors |
| PVDF membrane | Millipore | IPVH00010 | Protein transfer membrane |
| ReverTra Ace qPCR RT Kit | TOYOBO | FSQ-101 | First-strand cDNA synthesis |
| RIPA buffer | Beyotime | P0013B | Cell lysis buffer with protease and phosphatase inhibitors |
| Recombinant rat interleukin-1β | PeproTech | 400-01B | Induce inflammatory response in chondrocytes |
| Sangerbox platform | http://vip.sangerbox.com/ | N/A | ROC curve analysis |
| Simple Western Automated Western Blot System | ProteinSimple Jess | Jess (model 004-600) | Automated protein expression detection system |
| Stata 14.0 | Stata | N/A | Meta-analysis |
| Streptomycin | Thermo Fisher Scientific | Antibiotic for cell culture | |
| SYBR® Premix Ex Taq™ Kit | Takara | QPK-201 | Real-time quantitative PCR |
| The RNAfast200 kit | Fastagen Biotech | 220010-100 | Total RNA extraction from chondrocytes |
| Trypsin-EDTA | Gibco | 25200072 | Cell detachment, 0.25% trypsin-EDTA |
References
- David, J. H., Lyn, M., Mabel, C. Osteoarthritis in 2020 and beyond: a Lancet Commission. Lancet. 396 (10264), 1711-1712 (2020).
- Leifer, V. P., Katz, J. N., Losina, E. The burden of OA-health services and economics. Osteoarthritis Cartilage. 30 (1), 10-16 (2022).
- Long, H., et al. Prevalence Trends of Site-Specific Osteoarthritis From 1990 to 2019: Findings From the Global Burden of Disease Study 2019. Arthritis Rheumatol. 74 (7), 1172-1183 (2022).
- Loeser, R., Collins, J., Diekman, B. Aging and the pathogenesis of osteoarthritis. Nat Rev Rheumatol. 12 (7), 412-420 (2016).
- Tang, Y., Wang, Z., Cao, J., Tu, Y. Bone–brain crosstalk in osteoarthritis: pathophysiology and interventions. Trends Mol Med. 31 (3), 281-295 (2025).
- Chen, M., et al. Remodeling the Proinflammatory Microenvironment in Osteoarthritis through Interleukin-1 Beta Tailored Exosome Cargo for Inflammatory Regulation and Cartilage Regeneration. ACS Nano. 19 (4), 4924-4941 (2025).
- Murphy, M., et al. Articular cartilage regeneration by activated skeletal stem cells. Nat Med. 26 (10), 1583-1592 (2020).
- Zhang, H., et al. Mechanical overloading promotes chondrocyte senescence and osteoarthritis development through downregulating FBXW7. Ann Rheum Dis. 81 (5), 676-686 (2022).
- MacMullan, P., McCarthy, G. The meniscus, calcification and osteoarthritis: a pathologic team. Arthritis Res Ther. 12 (3), 116(2010).
- Jarraya, M., et al. Meniscus morphology: Does tear type matter? A narrative review with focus on relevance for osteoarthritis research. Semin Arthritis Rheum. 46 (5), 552-561 (2017).
- Fu, X., et al. Erythropoietin enhances meniscal regeneration and prevents osteoarthritis formation in mice. Am J Transl Res. 12 (10), 6464-6477 (2020).
- Li, C., et al. Integrated Analysis of Transcriptome Changes in Osteoarthritis: Gene Expression, Pathways, and Alternative Splicing. Cartilage. 14 (2), 235-246 (2023).
- Liu, H., et al. Regulation of Chondrocyte Metabolism and Osteoarthritis Development by Sirt5 Through Protein Lysine Malonylation. Arthritis Rheumatol. 77 (9), 1216-1227 (2025).
- Zhou, H., et al. FTO-mediated SMAD2 m6A modification protects cartilage against Osteoarthritis. Exp Mol Med. 56 (10), 2283-2295 (2024).
- Li, Y., et al. A Wnt-induced lncRNA-DGCR5 splicing switch drives tumor-promoting inflammation in esophageal squamous cell carcinoma. Cell Rep. 42 (6), 112542(2023).
- Mann, M., et al. Bromodomain-containing Protein 4 regulates innate inflammation via modulation of alternative splicing. Front Immunol. 14, 1212770(2023).
- Zhang, L., et al. RNF213 loss of function reshapes vascular transcriptome and spliceosome leading to disrupted angiogenesis and aggravated vascular inflammatory responses. J Cereb Blood Flow Metab. 42 (11), 2107-2122 (2022).
- Yan, C., Wan, R., Shi, Y. Molecular Mechanisms of pre-mRNA Splicing through Structural Biology of the Spliceosome. Cold Spring Harb Perspect Biol. 11 (1), (2019).
- Borisek, J., et al. Atomic-Level Mechanism of Pre-mRNA Splicing in Health and Disease. Acc Chem Res. 54 (1), 144-154 (2020).
- Pala, D., et al. Focal adhesion kinase/Src suppresses early chondrogenesis: central role of CCN2. J Biol Chem. 283 (14), 9239-9247 (2008).
- Kim, Y. H., Lee, J. W. Targeting of focal adhesion kinase by small interfering RNAs reduces chondrocyte redifferentiation capacity in alginate bead culture with type II collagen. J Cell Physiol. 218 (3), 623-630 (2009).
- Byun, S., et al. Response splicing quantitative trait loci in primary human chondrocytes identify putative osteoarthritis risk genes. Nat Commun. 16 (1), 1-17 (2025).
- Yang, B., Li, X., Su, Y. Single-cell sequencing and machine learning-based prediction of spliceosome-associated factor 2 may represent potential targets for osteoarthritis. Osteoarthritis Cartilage Open. 8 (2), (2026).
- Will, C., Lührmann, R. Spliceosome structure and function. Cold Spring Harb Perspect Biol. 3 (7), (2011).
- Nakaya, T. Dissection of FUS domains involved in regulation of SnRNP70 gene expression. FEBS Lett. 594 (21), 3518-3529 (2020).
- Zhou, C., et al. Microenvironmental stiffness mediates cytoskeleton re-organization in chondrocytes through laminin-FAK mechanotransduction. Int J Oral Sci. 14 (1), 1-13 (2022).
- Shin, H., et al. Focal Adhesion Assembly Induces Phenotypic Changes and Dedifferentiation in Chondrocytes. J Cell Physiol. 231 (8), 1822-1831 (2016).
- Li, G., et al. Zyxin-involved actin regulation is essential in the maintenance of vinculin focal adhesion and chondrocyte differentiation status. Cell Prolif. 52 (1), 1-14 (2018).
- Bowden, J., et al. Core and adjunctive interventions for osteoarthritis: efficacy and models for implementation. Nat Rev Rheumatol. 16 (8), 434-447 (2020).
- Chen, S., et al. Epidemiological trends and characteristics of osteoarthritis in China during 1990–2021. J Orthop Translat. 51, 218-226 (2025).
- Luo, P., et al. The role of cells and signal pathways in subchondral bone in osteoarthritis. Bone Joint Res. 12 (9), 536-545 (2023).
- Ming, L., Nafiza, H., Jingyi, H., Guangju, Z. Osteoarthritis year in review 2023: metabolite and protein biomarkers. Osteoarthritis Cartilage. 31 (11), 1437-1453 (2023).
- Zeyu, H., Ketao, W., Shenglong, D., Mingzhu, Z. Cross-talk of inflammation and cellular senescence: a new insight into the occurrence and progression of osteoarthritis. Bone Res. 12 (1), 1-17 (2024).
- Ma, J., et al. GYY4137-induced p65 sulfhydration protects synovial macrophages against pyroptosis by improving mitochondrial function in osteoarthritis development. J Adv Res. 71, 173-188 (2025).
- Kiebler, M., Ninkovic, J. RNA biology: Alternative splicing hits synaptic function and behavior. Curr Biol. 32 (23), R1314-R1316 (2022).
- Nikolaou, N., et al. Cytoplasmic pool of U1 spliceosome protein SNRNP70 shapes the axonal transcriptome and regulates motor connectivity. Curr Biol. 32 (23), 5099-5115.e8 (2022).
- Hu, Z., et al. U1 snRNP proteins promote proximal alternative polyadenylation sites by directly interacting with 3' end processing core factors. J Mol Cell Biol. 14 (8), (2022).
- Jobbins, A., et al. Pre-RNA splicing in metabolic homeostasis and liver disease. Trends Endocrinol Metab. , (2023).
- Zheng, Y., Zhong, G., He, C., Li, M. Targeted splicing therapy: new strategies for colorectal cancer. Front Oncol. 13, 1222932(2023).
- Zhang, Y., Hu, W., Li, H. RNA modification-mediated translational control in immune cells. RNA Biol. 20 (1), 603-613 (2023).