We present a protocol for the millifluidic continuous culture device (MCCD), which allows the cultivation of bacterial populations under constant low-nutrient conditions (down to hundreds of nanomolar concentrations) or temporal nutrient fluctuations on a minute timescale.
A subscription to JoVE is required to view this content. Sign in or start your free trial.
Method Article
A Continuous Culture Millifluidic Device for the Study of Escherichia coli under Low and Fluctuating Nutrient Conditions
In This Article
Summary
Abstract
Microbial habitats in nature are often characterized by low concentrations of mixed nutrients, spatial heterogeneity, and temporal fluctuations. However, traditional laboratory culturing methods fail to replicate these conditions. Batch cultures cannot sustain growth in low-nutrient environments, while chemostats maintain steady-state growth with a single limiting nutrient but are challenging to implement when the goal is to maintain defined low concentrations of nutrient mixtures or to introduce rapid fluctuations. Microfluidic systems generate dynamic environments but yield insufficient biomass for population-level omic analyses. To address these limitations, we introduce the millifluidic continuous culture device (MCCD), a versatile platform for studying microbial responses to stable and fluctuating nutrient conditions. The MCCD houses bacterial populations inside a Sterivex filter (0.45 µm polyvinylidene fluoride [PVDF] porous filtering membrane), where a continuous flow of media sustains stable culture conditions while preventing nutrient depletion. A three-way solenoid valve system, controlled via custom Matlab software, enables precise, minute-scale nutrient fluctuations. This protocol provides a step-by-step guide to operating the MCCD in two modes: (1) constant low-nutrient conditions and (2) fluctuating-nutrient conditions. Using this system, Escherichia coli grew exponentially in a mixture of amino acids and nucleobases present at tens to hundreds of nanomolar concentrations, reaching cell concentrations on the order of 109 cells/mL. By recreating key features of natural microbial habitats, the MCCD enables the study of bacterial growth and physiology under controlled yet ecologically relevant conditions in E. coli and other microbial species.
Introduction
Bacteria in natural habitats encounter a nutrient landscape that often varies in both composition and concentration and can fluctuate across a broad range of timescales1,2,3,4. In environments such as the ocean5, soil3, and gut6, microbial growth is frequently constrained by one or more essential nutrients, and nutrient availability can change due to physical, chemical, and biological processes4. These nutrient mixtures and their fluctuations drive microbial strategies for survival and growth, shaping responses across different levels of biological organization4.
Microbial adaptations to nutrient dynamics occur at the community, population, and single-cell levels. At the community level, fluctuations can promote species coexistence7, coordinate community composition and metabolic activity with temporal variation8, and create opportunities for new species to colonize9. At the population level, changing nutrient conditions can accelerate evolution by selecting for genetic changes10 or induce phenotypic variability, including bet-hedging strategies11, that improve survival under unpredictable conditions. At the single-cell level, bacteria adjust their physiology in response to the nutrient environment12,13. One recently reported example is a specific physiology that confers bacteria a growth advantage under fluctuating conditions14. Because bacteria frequently encounter nutrient limitation, studying how they respond to low and variable nutrient conditions—both as individual cells and within populations or communities— is essential for understanding their behavior in their natural environments.
Chemostats are well-suited for studying growth under limitation by a single nutrient, but are difficult to use when the goal is to control the concentrations of multiple nutrients in low-concentration mixtures. Chemostats have been valuable tools for studying bacterial adaptation to nutrient limitation by providing a well-controlled, steady environment. However, their operation inherently restricts them to conditions in which growth is limited by a single essential nutrient element. In a chemostat, the dilution rate is adjusted so that cellular growth balances the supply of one limiting nutrient, thereby fixing the growth rate rather than the concentrations of individual nutrients15. This framework does not readily generalize to environments containing mixtures of substitutable nutrients—such as multiple carbon sources—because the dilution rate controls only the overall growth rate, not the concentrations of each component in the medium16,17. As a result, the concentrations of individual nutrients and their co-utilization patterns emerge from microbial utilization rather than being externally prescribed16,17.
Additionally, while nutrient fluctuations can be induced in chemostats, rapid fluctuations or single shifts on the scale of minutes are difficult to achieve due to the typically large culture volumes. Microfluidic devices have emerged as powerful tools for creating precise low-concentration and fluctuating nutrient environments14. When paired with video microscopy, they enable measurement of single-cell growth. Although microfluidic systems permit quantification of the expression of selected proteins using fluorescent reporters, unlike chemostats, typical microfluidic devices are too small to produce the biomass needed for omic analyses, for example, to study the proteome of a bacterial population. To bridge this gap, we developed the millifluidic continuous culture device (MCCD).
The MCCD enables bacterial growth under controlled nutrient conditions, including constant low-nutrient conditions with minimal or no depletion, as well as fluctuating nutrient conditions, using a continuous flow culture system capable of generating sufficient biomass for downstream analyses. The MCCD uses a 0.45 µm PVDF filter as the culture vessel, in which medium is continuously replenished by a peristaltic pump delivering fresh medium from a reservoir (Figure 1A). The porous membrane of the filter retains bacteria while allowing a prescribed flow of nutrients, which prevents nutrient depletion even at low nutrient concentrations (hundreds of nanomolar to micromolar range). Because biomass is retained while fresh medium continuously flows through the device, the MCCD shares similarities with retentostats18, in which cells are retained while medium is renewed. However, the MCCD differs from classical retentostats in its architecture and mode of nutrient delivery. The retentostat typically operates as a stirred bulk reactor, where cells are suspended in a well-mixed culture volume. Under such conditions, nutrient availability depends on the balance between mixing, diffusion, and cellular uptake, and local depletion or gradients can arise, particularly at low nutrient concentrations and high cell densities. In contrast, in the MCCD, cells assemble directly on the membrane inside the small-volume Sterivex cartridge, forming layers only a few cells thick that are continuously exposed to flowing medium. No active mixing is imposed within the cartridge; instead, medium is homogenized upstream and delivered by continuous flow. Nutrients are supplied by convective transport through the thin cell layers, and because the diffusion distance is small and the flow rate is high, local nutrient gradients are minimized. As a result, the nutrient conditions experienced by the population are primarily determined by the composition of the incoming medium, enabling more consistent and well-defined low-nutrient conditions than can be ensured in stirred retention systems.
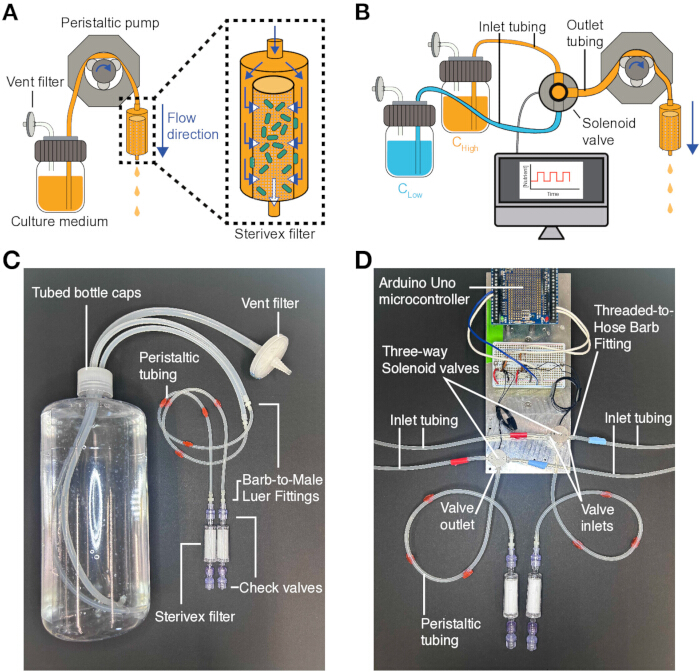
Figure 1: The millifluidic continuous culture device (MCCD) for bacterial culture under low-concentration or fluctuating nutrient conditions. (A) Schematic of the MCCD for constant nutrient conditions. A peristaltic pump drives the flow of fresh medium from a reservoir through a 0.45 µm PVDF filter containing bacterial cells. The porous membrane in the filter retains the bacteria while allowing medium to pass through. Continuous medium flow maintains constant nutrient conditions inside the filter, even at very low nutrient concentrations. (B) Schematic of the MCCD for fluctuating nutrient conditions. A software-controlled three-way solenoid valve upstream of the peristaltic pump alternates medium inflow between two reservoirs (e.g., high-nutrient concentration, CHigh, and low-nutrient concentration, CLow). The software controls the valve's plunger position to determine the active inflow source. (C) Fluidic assembly for constant nutrient conditions. A cap with three silicone tubes that traverse it seals the bottle containing fresh medium. One tube connects to a vent filter for aeration, while the other two carry medium to the filters. Barb-to-Male Luer fittings connect these tubes to the peristaltic tubing, and connect each peristaltic tube to a one-way check valve, serving as the entry point to the filter. The filter outlet is also fitted with a one-way check valve. The image shows two samples, each contained in one filter. (D) Fluidic assembly for fluctuating nutrient conditions. The metal platform houses the microcontroller and electronic components controlling two solenoid valves via custom MATLAB software. Threaded-to-Barb fittings connect both the inlets and outlets of the solenoid valves to the tubing. Each valve has two inlets for the two alternate media, here a high-nutrient concentration medium, CHigh, red-labeled tubes, and a low-nutrient concentration medium, CLow, blue-labeled tubes. The media are contained within capped bottles with a vent filter, as in (C). The outlets from the solenoid valves connect to the filters via peristaltic tubing, as in the steady-state assembly (C). The image shows two samples, each contained in one filter. Please click here to view a larger version of this figure.
Additionally, the incorporation of a software-controlled, three-way solenoid valve upstream of the Sterivex filter enables the user to switch the medium flow between two media contained in different reservoirs (Figure 1B). As a result, the device can be used to study the response of bacteria to either a stable environment at a constant (including low concentration) nutrient condition or to nutrient fluctuations, with fluctuation timescales of several minutes or longer.
This protocol outlines the assembly and operation of the MCCD for studying bacteria under both low-nutrient and fluctuating-nutrient conditions. As an example, this protocol provides a step-by-step guide to conducting a growth experiment using Escherichia coli NCM3722 in two operating modes of the MCCD: constant low-nutrient conditions and fluctuating nutrient conditions. The MCCD setup can be readily adapted to other nutrient conditions and microbial species, making it a versatile platform for studying bacterial physiology under nutrient environments typical of those encountered in nature.
Access restricted. Please log in or start a trial to view this content.
Protocol
1. Bacterial growth in constant nutrient conditions
NOTE: This protocol describes the procedure for performing a growth curve of E. coli NCM3722 in a very dilute Rich-Defined Medium ("low RDM") condition. This growth curve runs for 12 h, with one sample collected every 2 h (a total of 6 time points). The key principle of this protocol is that each time point corresponds to a single Sterivex filter (henceforth referred to as a 0.45 µm PVDF filter). To collect a sample, the culture inside the filter is retrieved by centrifuging it upside down, the cell number is quantified, and the filter is discarded. Each 0.45 µm PVDF filter yields only one sample. Preparing the experiment requires the definition of three key experimental parameters: the flow rate of the peristaltic pump, the duration of the experiment, and the desired number of samples (i.e., the number of 0.45 µm PVDF filters). Set the initial flow rate to 2 mL/min. Adjust this parameter as needed (e.g., increase the flow rate to maintain the supply of a very dilute nutrient).
- Preparation of medium and materials
NOTE: Since each filter corresponds to a single time point sample, the experimental runtime of each 0.45 µm PVDF filter varies depending on its collection time (e.g., 2 h for the first time point, 4 h for the second time point, and so on).- Estimate the required culture medium volume using the formula
 ,
,
where n is the number of samples (0.45 µm PVDF filters), Q is the flow rate (in mL/min), and ti is the experimental runtime (in minutes) for each sample. - Multiply by 1.2 to include an additional 20% volume to account for flow-rate variation. For this example, calculate

- Round the calculated volume up (e.g., prepare 6,200 mL in this example).
- Prepare material for sterilization (see Table 1).
NOTE: Prepare and sterilize the materials the day before the experiment to ensure readiness and minimize delays. Autoclave these materials, except the one-way Luer valves; sterilize the valves with 70% ethanol.- Connect both ends of six silicone peristaltic tubes to "Male Luer to Barb" plastic fittings by inserting the Barb end of the fitting into the tubing. Cover the Male Luer ends with aluminum foil to prevent contamination.
NOTE: Six peristaltic tubes are prepared because the experiment uses six 0.45 µm PVDF filters. All tubes will later be mounted on the same peristaltic pump head so that all filters receive identical flow. - Place the tubing inside a closed, sterilizable container.
- Place the vent filters inside a closed, sterilizable container.
- Place the tubed bottle caps with silicone tubing that passes through the caps inside a closed, sterilizable container.
NOTE: The tubed bottle caps used in this protocol are equipped with three tubes that traverse the caps: two tubes of equal diameter for delivering medium to the 0.45 µm PVDF filters, and a third tube with a wider diameter. These tubes are securely attached to the caps and cannot be removed. - Submerge 12 one-way Luer check valves in a 70% ethanol solution and leave them overnight to sterilize.
NOTE: (PAUSE POINT) Sterilized materials can be stored submerged and sealed at room temperature for up to 24 h before the experiment. Before use, remove the valves from the ethanol and rinse with sterile ultra-pure water to remove residual ethanol. Alternatively, check valves can be 3D-printed using autoclavable materials to allow sterilization by autoclaving instead of ethanol treatment.
- Connect both ends of six silicone peristaltic tubes to "Male Luer to Barb" plastic fittings by inserting the Barb end of the fitting into the tubing. Cover the Male Luer ends with aluminum foil to prevent contamination.
- Autoclave the peristaltic tubing, vent filters, bottle caps, graduated cylinder, and bottles using standard labware settings.
- Prepare 6,200 mL of low rich-defined media (RDM; see Table of Materials) by mixing the reagents listed in Table 2.
NOTE: Prepare the medium on the day of the experiment, during the approximately 5 h waiting period after starting the pre-culture (see step 1.2.1). This preserves medium freshness and minimizes contamination risk.
- Estimate the required culture medium volume using the formula
- Preparation of a bacterial pre-culture
NOTE: Use a pre-culture in the exponential phase to start the experiment. During this phase, bacteria grow at a constant rate, synthesizing cell constituents in a balanced manner and dividing at a defined cell mass. Use exponential-phase cells to minimize variability and standardize the starting physiological state.- The day before the experiment, prepare an overnight (ON) culture as follows: Inoculate 3 mL of full RDM with a frozen glycerol stock of E. coli NCM3722 in a sterile 15 mL culture tube. Incubate the culture overnight (~16 h) at 37 °C with shaking at 200 rpm in a shaking incubator.
NOTE: (PAUSE POINT) Once the ON culture is in the incubator, no further steps are followed on this day. Resume the protocol the next day by proceeding to step 1.2.2. - On the day of the experiment, prepare the pre-culture as follows: Add 6 µL of ON culture to 6 mL of full RDM. Divide equally into two 15 mL culture tubes and label the tubes as A and B. Incubate both tubes at 37 °C with shaking at 200 rpm.
NOTE: The pre-culture typically requires approximately 5 h to reach the exponential phase (OD600 ≈ 0.5). Use this period to prepare the fresh medium (see step 1.1.6). Do not proceed to step 1.2.3 until OD600 reaches approximately 0.5. - Monitor optical density (OD) at 600 nm using tube B. Proceed with the experiment when OD600 reaches approximately 0.5, indicating exponential growth in full RDM for E. coli NCM3722 (see section 1.4).
NOTE: Start the experiment with exponential-phase cells to improve reproducibility and standardize starting conditions.
- The day before the experiment, prepare an overnight (ON) culture as follows: Inoculate 3 mL of full RDM with a frozen glycerol stock of E. coli NCM3722 in a sterile 15 mL culture tube. Incubate the culture overnight (~16 h) at 37 °C with shaking at 200 rpm in a shaking incubator.
- Preparation of an experiment in the MCCD with constant nutrient conditions
NOTE: Perform steps 1.3.1 to 1.3.5 inside a sterile biosafety cabinet immediately after the pre-culture begins growing.- Allocate the total medium volume to each bottle.
NOTE: Use the bottles as medium reservoirs. Use bottle caps fitted with two medium-delivery tubes, with each tube delivering medium to one 0.45 µm PVDF filter. Allocate the total medium volume (prepared in step 1.1.6) among the bottles based on the amount required by each timepoint sample (i.e., each 0.45 µm PVDF filter) over the course of the experiment.- Use the formula provided in step 1.1.1 to determine the volume of medium needed for each 0.45 µm PVDF filter. For example, using the following terms:

The total medium volumes required for each time point, in chronological order, are 288, 576, 864, 1152, 1440, and 1728 mL. - Distribute the calculated medium volumes across bottles, grouping the volumes needed for two time points into a single bottle. For example: ~900 mL in one 1 L bottle (for time points 1 and 2), ~2,100 mL in one 2.5 L bottle (for time points 3 and 4), ~3200 mL of the medium in one 4 L bottle (for time points 5 and 6).
- Use the formula provided in step 1.1.1 to determine the volume of medium needed for each 0.45 µm PVDF filter. For example, using the following terms:
- Seal each bottle with the tubed bottle caps (Figure 1C). Tighten the caps securely to prevent leaks.
- Connect a 0.2 µm vent filter to the widest silicone tube extending from the tubed bottle cap (Figure 1C). This allows sterile air exchange during the experiment.
- Attach one end of each peristaltic tube (with fittings already attached; see section 1.1.4 on material preparation) to the smaller-diameter silicone tubes extending from the tubed bottle caps (Figure 1C). Ensure secure connections to maintain sterility. Leave the aluminum foil cover on the free Male Luer lock fitting in place until the experiment begins to prevent contamination.
- Place the bottles with their assembled tubing and the peristaltic pump into an incubator set to 37 °C. Secure the tubing into the channels of the peristaltic pump head.
NOTE: All peristaltic tubes are mounted on the same pump head of a single peristaltic pump, so that all 0.45 µm PVDF filters receive medium from the same pump. Using a single pump ensures that the flow rate is identical across filters and prevents variability that could arise from differences between pumps.
- Allocate the total medium volume to each bottle.
- Protocol of an experiment in the MCCD with constant nutrient conditions
- Dilute the pre-culture (OD = 0.5) 1:10 by adding 600 µL of pre-culture to 5.4 mL of fresh low RDM.
- Using a 1 mL pipette, introduce 1 mL of the diluted pre-culture into each of the six 0.45 µm PVDF filters.
- Rinse the one-way check valves with autoclaved ultrapure water and attach one to each end of each 0.45 µm PVDF filter.
- Remove the aluminum foil covers from the peristaltic tubing fittings.
- Connect each of the six 0.45 µm PVDF filters to a Male Luer fitting on the peristaltic tubing (Figure 1C).
- Set the flow rate to 2 mL/min on the peristaltic pump and start the flow. Define this moment as time 0.
- Place a waste receptacle below the 0.45 µm PVDF filters to collect the outflow.
NOTE: Figure 2A shows the complete assembly of the experiment inside the incubator box.
- Sample collection
- After 2 h, unplug one of the two 0.45 µm PVDF filters connected to the 1 L bottle.
- Unscrew the one-way check valves and place the 0.45 µm PVDF filter into a 50-mL centrifuge tube with the inlet facing downward.
- Centrifuge the centrifuge tube containing the 0.45 µm PVDF filter at 2,000 × g for 2 min.
- Using a pipe cutter, apply gentle pressure to the plastic encasing at the end closest to the outlet to open the 0.45 µm PVDF filter.
NOTE: Disinfect the pipe cutter before use (e.g., by wiping with 70% ethanol) to avoid contamination when opening the 0.45 µm PVDF filter. - Release the inner cylinder containing the porous membrane and discard the section of the filter that holds the membrane.
- Rinse the inner walls of the 0.45 µm PVDF filter encasing (those perpendicular to the flow direction) with the culture medium collected in the centrifuge tube.
NOTE: This step ensures that any cells trapped on the walls during centrifugation are collected. - Measure the total volume collected using a 5 mL serological pipette.
- At subsequent time points (4 h, 6 h, 8 h, 10 h, and 12 h), unplug the corresponding 0.45 µm PVDF filters and repeat steps 1.5.2–1.5.6. Follow this specific order:
- At 4 h, unplug the second 0.45 µm PVDF filter connected to the 1 L bottle.
- At 6 h and 8 h, unplug the 0.45 µm PVDF filters connected to the 2.5 L bottle.
- At 10 h and 12 h, unplug the 0.45 µm PVDF filters connected to the 4 L bottle.
NOTE: Follow this order to match sampling time points to the medium volumes distributed in step 1.3.1.
- Downstream analyses
- Take three 100 µL aliquots from each sample and fix with glutaraldehyde to a final concentration of 1.5%.
CAUTION: Glutaraldehyde is toxic, a strong irritant, and a potential sensitizer. Handle inside a chemical fume hood while wearing appropriate personal protective equipment (lab coat, nitrile gloves, and safety glasses). Avoid skin contact and inhalation. Dispose of glutaraldehyde-containing waste according to institutional hazardous chemical waste regulations. - Use the fixed samples to count the number of cells per microliter with flow cytometry after labeling with a fluorescent DNA dye.
CAUTION: Fluorescent DNA dyes may be mutagenic. Wear gloves and dispose of dye-containing waste according to institutional biosafety regulations.
NOTE: As an alternative to DNA staining and flow cytometry, cell densities can be estimated by plating a small volume of the sample on rich-medium agar plates (e.g., LB agar) and counting colony-forming units (CFUs). - Multiply the cell number per microliter by the total volume measured in step 1.5.7 to calculate the total number of cells contained within the 0.45 µm PVDF filter.
- Centrifuge the remaining volume in 1.5-mL microcentrifuge tubes at 10,000 × g for 4 min.
- Remove the supernatant.
- Store the pellets of cells at -80 °C for future analyses (e.g., transcriptomics).
- Take three 100 µL aliquots from each sample and fix with glutaraldehyde to a final concentration of 1.5%.
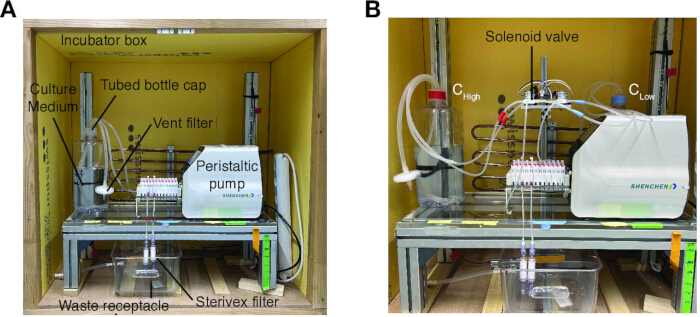
Figure 2: Experimental assembly of the MCCD. (A) Photograph of the MCCD setup for constant nutrient conditions. The setup is housed in an incubator box to maintain a constant temperature, with a waste receptacle collecting the flow-through medium. (B) Photograph of the MCCD setup for fluctuating nutrient conditions. The bottle labeled with red tape contains a high-nutrient concentration medium (CHigh), while the bottle labeled with blue tape contains a low-nutrient concentration medium (CLow). The metal platform in the center supports the components that control nutrient fluctuations, corresponding to those described in Figure 1D. Please click here to view a larger version of this figure.
2. Bacterial growth in fluctuating-nutrient conditions
- Assembly of a controller for a solenoid valve
NOTE: Control the three-way solenoid valve using a microcontroller-based switching circuit connected to a computer running a custom graphical user interface (GUI) developed in MATLAB.- Assemble the solenoid valve control circuit (Figure 3A).
- Connect a digital output pin of the microcontroller to the base of an NPN transistor through a 1 kΩ resistor.
- Connect the collector of the transistor to the negative terminal of the solenoid valve.
- Connect the emitter of the transistor to ground.
- Connect the positive terminal of the solenoid valve to an external DC power supply compatible with the valve voltage.
- Place a diode across the solenoid terminals. Connect the striped side of the diode to the positive supply line.
NOTE: The diode suppresses voltage spikes generated when the solenoid is switched off.
- Attach plastic "Threaded to Hose Barb" fittings to the solenoid valves, ensuring the Barb end extends outward.
- Install MATLAB R2022b or later on a computer with USB connectivity.
- Install the MATLAB support package required for serial communication with microcontroller hardware.
- Connect the microcontroller board to the computer using a USB cable to establish serial communication.
- Open the MATLAB-based GUI used to generate fluctuating nutrient conditions in the MCCD (available in the link https://github.com/juanitaLara/MCCD).
- Verify the connection between the solenoid valves and the MATLAB GUI platform:
- Open the GUI platform in Matlab and click on the Connect button (Figure 3B). Wait until the message Controller connected successfully appears in the command window.
- Input a value for the time step (e.g., 5 s for the High and Low phases) under the Automated operation panel.
- Observe the solenoid valves and listen for the click sound they produce during switching between the two media.
- Using a watch, confirm that the solenoid valves switch exactly at the specified interval (e.g., every 5 s).
NOTE: Perform this verification before each experiment to confirm communication and correct valve switching. (PAUSE POINT) After verifying solenoid valve operation, the system can remain assembled inside the incubator for several hours before starting the experiment.
- Assemble the solenoid valve control circuit (Figure 3A).
- Preparation of media and materials
NOTE: This protocol involves alternating nutrient conditions between low and high RDM with a period of 1 h (30 min in high RDM followed by 30 min in low RDM). The experiment runs for three h of fluctuations, with two samples collected: (1) At 3 h 1 min (high RDM phase, immediately after switching from low to high), and (2) at 3 h 31 min (low RDM phase, immediately after switching from high to low).- Estimate the required culture media volumes by experimental phases.
- First, calculate the volumes required for the first 3 h (three full fluctuation periods):
low RDM volume =1.2 × 2[mL/min] × 90[min] × 2[0.45 µm PVDF filters] = 432[mL]
high RDM volume =1.2 × 2[mL/min] × 90[min] × 2[0.45 µm PVDF filters] = 432[mL] - Calculate the volume required for the final 30 min phase:
high RDM volume =1.2 × 2[mL/min] × 30[min] × 1[0.45 µm PVDF filters] = 72[mL] - Round the volumes to convenient values (e.g., 500 mL of low RDM and 600 mL of high RDM).
- First, calculate the volumes required for the first 3 h (three full fluctuation periods):
- Prepare materials for autoclave sterilization (see Table 3) by following steps 1.1.4 –1.1.5.
NOTE: Prepare and sterilize the materials the day before the experiment to ensure readiness and minimize delays on the experiment day (steps 2.2.3 and 2.2.4). This setup, in comparison with the constant-nutrient experiments, requires additional tubing to connect media bottles directly to the solenoid valve (Figure 1B,D). These tubes require only one "Barb to Male Luer" fitting, as the solenoid valve fittings are pre-assembled. Cover the ends of these tubes with aluminum foil before autoclaving. - Sterilize the prepared peristaltic tubing, vent filters, caps, graduated cylinder, and bottles in an autoclave.
- Submerge 4 one-way Luer check valves in a 70% ethanol solution and leave them overnight to sterilize.
NOTE: (PAUSE POINT) Sterilized check valves can remain submerged in ethanol overnight and stored sealed at room temperature for up to 24 h. Before use, rinse the valves with sterile Milli-Q water. - Clean and sterilize the solenoid valves by flushing them with 70% ethanol 3–5 times, followed by ultrapure water 3–5 times.
- On the day of the experiment, during the approximately 5-h waiting period after pre-culture preparation (see step 2.3), prepare 500 mL of low RDM and 600 mL of high RDM by mixing the reagents listed in Table 4.
NOTE: Preparing the media on the day of the experiment ensures freshness and minimizes contamination risks.
- Estimate the required culture media volumes by experimental phases.
- Preparation of a bacterial pre-culture
- Follow the steps described in step 1.2.
- Preparation of an experiment in the MCCD with fluctuating-nutrient conditions
NOTE: Perform steps 2.4.1–2.4.4 inside a sterile biosafety cabinet immediately after the pre-culture begins growing.- Place each medium into a 1 L bottle.
- Seal the bottles with the pre-assembled caps fitted with three ports and pre-installed silicone tubing. Tighten the caps securely to prevent leaks.
- Connect a 0.2 µm vent filter to the wide silicone tube extending from one of the ports on each bottle cap.
- Connect the "inlet tubing" (shown in Figure 1D) to the silicone tubes extending from the tubed bottle caps before connecting it to the solenoid valves:
- Attach one end of the silicone tube (with only one attached fitting) to the tubing extending from the low RDM bottle cap.
- Leave the aluminum foil cover on the free Male Luer lock fitting until the bottles are taken to the incubator to prevent contamination.
- Repeat step 2.4.4.1 for the high RDM bottle.
- Place the bottles with their assembled "inlet tubing", the peristaltic pump, and the solenoid valves with the controller inside an incubator set to 37 °C.
- Connect the "inlet tubing" (attached in step 2.4.4) to the inlets of the solenoid valves in the following way:
- Connect the two tubes from the low RDM bottle to one of the two inlets in each solenoid valve (tubes labeled with blue tape in Figure 1D).
- Connect the two tubes from the high RDM bottle to one of the two inlets in each solenoid valve (tubes labeled with red tape in Figure 1D).
- Connect a peristaltic pump-compatible silicone tube (with only one fitting) to the outlet of each solenoid valve (Figure 1D). Leave the aluminum foil cover on the free Male Luer lock fitting until the experiment begins to maintain sterility.
- Protocol of an experiment in the MCCD with fluctuating-nutrient conditions
- Verify the connection between the solenoid valves and the Matlab software by performing step 2.1.7.
- Input the desired time step values for the fluctuations into the Matlab GUI platform: Enter time steps of 1800 s in High RDM (30 min) and 1800 s in Low RDM (30 min).
- Select Low under the Start from menu to begin in the Low RDM condition (Figure 3).
- Seed the two 0.45 µm PVDF filters as described in step 1.4.
- Start the experiment.
NOTE: Figure 2B depicts the complete fluidic assembly for this experiment.
- Sample collection
- Collect samples as in step 1.5. Harvest the first 0.45 µm PVDF filter at 3 h 1 min and the second at 3 h 31 min.
NOTE: Unplug either filter first; both filters are fed by the same media.
- Collect samples as in step 1.5. Harvest the first 0.45 µm PVDF filter at 3 h 1 min and the second at 3 h 31 min.
- Downstream analyses
- Follow the steps described in step 1.6 to count the number of cells via flow cytometry and to process and store samples for downstream analyses (e.g., transcriptomics).
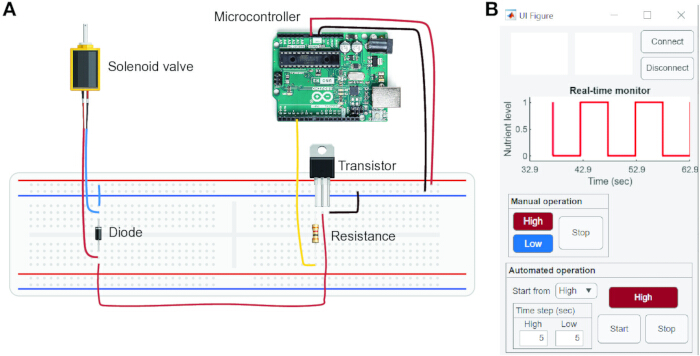
Figure 3: Controller of the solenoid valves to impose nutrient fluctuations. (A) Wiring diagram of the electronic circuit used to control the solenoid valve. The circuit consists of a microcontroller board, a transistor used as a switching element, a resistor connected to the transistor base, and a flyback diode placed across the solenoid valve to protect the circuit from voltage spikes generated during valve switching. The microcontroller controls the transistor, which in turn switches the power supplied to the solenoid valve. Adapted with permission from ref. 20 . (B) After connecting the microcontroller board to both the computer running the GUI and a power source with the voltage required by the solenoid valves, communication is established by clicking the Connect button. The valves can be operated manually using the Manual Operation panel, where the user selects the medium to be flown (e.g., "High" or "Low"). Alternatively, the Automated Operation panel allows the user to specify the initial medium and the time steps (in seconds) for each phase (High and Low), and to start the operation by clicking the Start button. The Real-time Monitor displays a step function (0 = Low, 1 = High) over time, indicating which medium was flowing through the solenoid valves to the filters over the preceding seconds. Please click here to view a larger version of this figure.
Access restricted. Please log in or start a trial to view this content.
Results
In this study, we used the MCCD to quantify the growth rate of E. coli NCM3722 under constant low-nutrient conditions at three RDM concentrations. These concentrations were derived from the rich-defined medium (RDM) formula described by Neidhardt19, with the amino acid and nucleobase supplements diluted to 0.5%, 0.25%, and 0.01% of the original formulation, respectively.
Replicate growth experiments were performed in each medium to quantify growth rates. For th...
Access restricted. Please log in or start a trial to view this content.
Discussion
Bacterial culturing methods that capture the nutrient complexity of natural environments are essential for advancing the study of microbial physiology beyond simplified laboratory conditions. Natural ecosystems contain mixtures of nutrients spanning a wide concentration range, which often do not support maximal growth rates1,3,4,21,22,
Access restricted. Please log in or start a trial to view this content.
Disclosures
The authors declare no conflict of interest.
Acknowledgements
We gratefully acknowledge funding from a Gordon and Betty Moore Foundation Symbiosis in Aquatic Systems Initiative Investigator Award (GBMF9197; https://doi.org/10.37807/GBMF9197), the Simons Foundation through the Principles of Microbial Ecosystems (PriME) collaboration (grant 542395FY22), and Swiss National Science Foundation grant 205321_207488 to R.S. K.S.L. acknowledges support from the Korea Basic Science Institute (National Research Facilities and Equipment Center; Grant No. RS2025-00554860) and the National Research Foundation of Korea (NRF; Grant No. RS2025-23523643), both funded by the Korea Government (MSIT), and from the 2025 Research Fund (1.260002.01) of UNIST.
Access restricted. Please log in or start a trial to view this content.
Materials
| Name | Company | Catalog Number | Comments |
|---|---|---|---|
| 1K Ohm Resistor | BC Robotics | ELC-021 | Power Rating: 1/6 W |
| 1N4001 Diode | BC Robotics | ELC-001 | DC Reverse Voltage: 50 V; Average Rectified Current: 1 A |
| 3-stop platinum-cured silicone peristaltic tubing | Innofluid | SE-TUB-SIL-SSS-2.4*0.8 | Inner diameter 0.8 mm; outer diameter 2.4 mm; compatible with peristaltic pump used |
| 3-way Solenoid valves | Emerson Electric Co. | 0055A301L0T00F3 | 12 V DC, 1 W |
| Aluminum foil | Suitable for autoclaving | ||
| Arduino Uno Rev4 | Arduino | SKU ABX00173 | |
| Autoclave | Systec | D-200 | Or different company |
| Cap closure with three ports – for 1 and 2 L bottles | Nalgene | 2162-0531 | Or different company (make sure they fit the selected bottles) |
| Cap closure with three ports – for 4 L bottle | Nalgene | 2162-0830 | Or different company (make sure they fit the selected bottles) |
| Cell density meter CO8000 | WPA biowave | OD meter | |
| Centrifuge | Eppendorf | 5804R | Centrifuge that fits 50 mL Falcon tubes |
| Centrifuge | Eppendorf | 5424R | Centrifuge that fits 1.5 and 2 mL eppendorf tubes |
| Conical centrifuge tube - 50 mL | Fischer Scientific | 10788561 | Falcon tube |
| Culture tubes (14 mL, sterile) | Greiner bio-one | Culture tubes | |
| Ethanol | Sigma Aldrich | 493511 | Dilute to 70% |
| Flow cytometer | Beckman | C09756 | CYTOFlex |
| Glutaraldehyde 25% | Sigma Aldrich | G5882 | Or different company |
| Graduated cylinder - 500 mL | Nalgene | 3662-0500 | Or different company |
| Incubator box | Custom-built incubator box – contact corresponding authors for construction details | ||
| LabV1 Intelligent Low Flow Rate Peristaltic Pump | Innofluid | SE-LABV1-AMC12(10) | Available at Darwin Microfluidics |
| Male Luer-to-barb fitting | Aldrich | Z277142 | Male Luer-to-barb adapter compatible with 0.8 mm ID tubing (see Figure 1C) |
| Male Luer-to-threaded fitting | Aldrich | Z277142 | Used to connect the solenoid valve to the "inlet tubing" (see Figure 1D) |
| Matlab | Mathworks | R2022b or later | Software to run the custom-made software for the solenoid valves |
| MOPS EZ Rich Defined Medium Kit | Teknova | M2105 | MOPS medium for Enterobacteria |
| One-way Luer check valve | Masterflex | 30505-92 | Prevents backflow into medium reservoirs |
| Pipe cutter - 0-37 mm | KS Tools | 2222051 | Or different company |
| Pipette set | Fisher Scientific | 05-403-151 | Or different company |
| Platinum-Cured Silicone Tubing - 1/16 in | Nalgene | 8060-0020 | Inner diameter 1/16 in (1.6 mm); used for fluctuating-nutrient experiments |
| Platinum-Cured Silicone Tubing - 1/8 in | Nalgene | 8060-0030 | Inner diameter 1/8 in (3.2 mm); used for fluctuating-nutrient experiments |
| Polypropylene copolymer bottle - 1 L | Nalgene | 2126-1000 | Or different company |
| Polypropylene copolymer bottle - 2 L | Nalgene | 2126-2000 | Or different company |
| Polypropylene copolymer bottle - 4 L | Nalgene | 2126-4000 | Or different company |
| Serological pipette - 5 mL | Corning | CLS4487 | Or different company |
| Solderless Breadboard | BC Robotics | PROTO-001 | |
| Sterivex-HV filter - 0.45 µm PVDF | Millipore | SVHV01015 | |
| SYBR Green I Nucleic Acid Gel Stain | Invitrogen | S7563 | Nucleic acid stain for cell counting in flow cytometer |
| TIP120 Darlington Transistor | BC Robotics | TRN-005 | |
| Tubes - 1.5 mL | Eppendorf | 3810X | Tubes for centrifuging cell cultures and storing pellets |
| Vent filter | Millex | SLFG05000 | 0.2 µm hydrophobic vent filter |
| Waste receptacle | Volume capacity should be at least the total media volume to be used in the experiment |
References
- Stocker, R. Marine microbes see a sea of gradients. Science. 338 (6107), 628-633 (2012).
- Vorholt, J. A. Microbial life in the phyllosphere. Nat Rev Microbiol. 10 (12), 828-840 (2012).
- Or, D., et al. Physical constraints affecting bacterial habitats and activity in unsaturated porous media: a review. Adv Water Resour. 30 (6–7), 1505-1527 (2007).
- Nguyen, J., et al. Environmental fluctuations and their effects on microbial communities, populations and individuals. FEMS Microbiol Rev. 45 (1), (2021).
- Moore, C. M., et al. Processes and patterns of oceanic nutrient limitation. Nat Geosci. 6 (9), 701-710 (2013).
- Doranga, S., et al. Nutrition of Escherichia coli within the intestinal microbiome. EcoSal Plus. 12 (1), eesp-0006(2024).
- Rodríguez-Verdugo, A., et al. The rate of environmental fluctuations shapes ecological dynamics in a two-species microbial system. Ecol Lett. 22 (5), 838-846 (2019).
- Thaiss, C. A., et al. Transkingdom control of microbiota diurnal oscillations promotes metabolic homeostasis. Cell. 159 (3), 514-529 (2014).
- Kearney, S. M., et al. Orthogonal dietary niche enables reversible engraftment of a gut bacterial commensal. Cell Rep. 24 (7), 1842-1851 (2018).
- Elena, S. F., Lenski, R. E. Evolution experiments with microorganisms: the dynamics and genetic bases of adaptation. Nat Rev Genet. 4 (6), 457-469 (2003).
- Beaumont, H. J. E., et al. Experimental evolution of bet hedging. Nature. 462 (7269), 90-93 (2009).
- Schaechter, M., Maaloe, O., Kjeldgaard, N. O. Dependency on medium and temperature of cell size and chemical composition during balanced growth of Salmonella typhimurium. J Gen Microbiol. 19 (3), 592-606 (1958).
- Ballesta, J. P. G., Schaechter, M. Effect of shift-down and growth inhibition on phospholipid metabolism of Escherichia coli. J Bacteriol. 107 (1), 251-258 (1971).
- Nguyen, J., et al. A distinct growth physiology enhances bacterial growth under rapid nutrient fluctuations. Nat Commun. 12 (1), (2021).
- Novick, A., Szilard, L. Description of the chemostat. Science. 112 (2920), 715-716 (1950).
- Egli, T., Lendenmann, U., Snozzi, M. Kinetics of microbial growth with mixtures of carbon sources. Antonie Van Leeuwenhoek. 63 (3-4), 289-298 (1993).
- Lendenmann, U., Snozzi, M., Egli, T. Kinetics of the simultaneous utilization of sugar mixtures by Escherichia coli in continuous culture. Appl Environ Microbiol. 62 (5), 1493-1499 (1996).
- Tappe, W., et al. Cultivation of nitrifying bacteria in the retentostat, a simple fermenter with internal biomass retention. FEMS Microbiol Ecol. 19 (1), 47-52 (1996).
- Neidhardt, F. C., Bloch, P. L., Smith, D. F. Culture medium for enterobacteria. J Bacteriol. 119 (3), 736-747 (1974).
- Controlling a solenoid valve with Arduino. , Available from: https://bc-robotics.com/tutorials/controlling-a-solenoid-valve-with-arduino/ (2015).
- Egli, T. The Ecological and Physiological Significance of the Growth of Heterotrophic Microorganisms with Mixtures of Substrates. Advances in Microbial Ecology. , Plenum Press. New York. (1995).
- Koch, A. L. Oligotrophs versus copiotrophs. BioEssays. 23 (7), 657-661 (2001).
- Muenster, U. Concentrations and fluxes of organic carbon substrates in the aquatic environment. Antonie Van Leeuwenhoek. 63 (3-4), 243-274 (1993).
- Murugan, A., et al. Roadmap on biology in time varying environments. Phys Biol. 18 (4), (2021).
- Cox, C. D., Bavi, N., Martinac, B. Bacterial mechanosensors. Annu Rev Physiol. 80 (1), 71-93 (2018).
Access restricted. Please log in or start a trial to view this content.
Reprints and Permissions
