This protocol describes the stepwise method for adapting Euglena gracilis to cassava-based substrates and the subsequent evaluation of growth, viability, and biomass production across multiple cassava products under heterotrophic cultivation conditions.
Method Article
A Method for Adapting Euglena gracilis to Cassava-Based Substrates for Heterotrophic Cultivation
In This Article
Summary
Abstract
Cassava processing generates nutrient-rich by-products that remain underutilized due to variable composition, cyanogenic compounds, and active microbial communities. This protocol presents a multistage adaptation strategy for establishing a cassava-tolerant lineage of Euglena gracilis suitable for heterotrophic cultivation in cassava-derived substrates. The method begins with simultaneous exposure of Euglena cultures to autoclaved and non-autoclaved cassava media and to a garri concentration gradient of 10–30 g/L to assess tolerance to microbial complexity and substrate load. Cultures are then subjected to a higher concentration gradient of 30–50 g/L to evaluate performance with denser substrates. The resulting lineage is compared with a non-adapted wild-type strain across five cassava products; garri, dried pulp, pellets, peels, and animal feed to assess growth consistency in field-relevant materials. The protocol includes measurement of pH changes, cyanide levels using colorimetric strips, and preparation of dried biomass for protein analysis based on total nitrogen quantification. Together, these procedures provide a reproducible framework for adapting Euglena gracilis to cassava-derived substrates and for evaluating strain performance across diverse cassava products. This method enables the development of robust algal lineages for use in cassava-focused bioprocessing and waste-valorization applications.
Introduction
Cassava (Manihot esculenta) is a major food and industrial crop across West Africa, generating processed by-products such as garri, dried pulp, peels, and pellets1.
Cassava derived substrates are primarily composed of fermentable carbohydrates and residual nutrients as well as minor protein and fibre content although composition can vary depending on the processing conditions and source material2,3. They remain underutilized due to their heterogeneous composition, presence of cyanogenic glycosides, and the diverse microbial communities that arise during traditional processing and fermentation4. These characteristics present challenges for direct microbial cultivation and limit the integration of cassava by-products into standardized bioprocessing workflows. Despite the abundance of cassava-derived by-products, there is currently a lack of reproducible and bio-sustainable methods for cultivating microbial systems on these chemically complex and microbially active substrates. A cultivation system capable of enriching or detoxifying such a popular food source while operating reliably under these conditions would support more sustainable cassava-processing workflows and circular resource utilization.
Euglena gracilis is a unicellular flagellate within the Euglenozoa5 recognized for its flexible pellicle, dynamic morphology, and reversible encystment capabilities in response to substantial fluctuations in nutrient availability, osmotic pressure, and chemical composition6. Its metabolic adaptability also allows it to synthesize the storage polysaccharide paramylon6 and regulate cellular pH through organic acid metabolism. These metabolic traits, particularly paramylon accumulation, may enhance energy storage and stress tolerance, supporting survival and adaptation under the variable nutrient and chemical conditions characteristic of cassava-derived substrates. These traits enable E. gracilis to persist under chemically variable freshwater conditions, making it a promising candidate for cultivation on heterogenous, non-refined substrates7.
When exposed to chemically complex or microbially active substrates, non-adapted E. gracilis cultures often exhibit stress responses such as increased encystment and reduced motility, whereas adapted populations may maintain more stable morphology and metabolic activity8. Interactions with associated microbial communities may further influence physiological performance during prolonged exposure to complex substrates. These characteristics highlight the relevance of adaptation-based approaches when cultivating E. gracilis on cassava-derived materials9.
To address these challenges, this method employs a staged adaptation strategy designed to gradually acclimate E. gracilis to cassava-derived substrates. The approach incorporates controlled exposure to increasing substrate complexity and microbial activity, allowing selection of populations capable of maintaining viability and growth under heterogeneous cultivation conditions. This design allows E. gracilis to interact with, and potentially derive advantages from, the associated microbiota, and adapt to increasing media concentrations.
Following adaptation, the protocol leads a comparative evaluation of adapted and non-adapted E. gracilis lineages across multiple cassava-derived products. This comparative framework allows assessment of growth consistency, morphological stability, and physiological responses under field-relevant substrate conditions, as the adaptation process gradually prepares E. gracilis to navigate the nutrient variability, chemical stressors, and microbial activity characteristic of cassava by-products.
The method incorporates standardized monitoring of pH and cyanide levels10 during cultivation, as well as preparation of harvested biomass for downstream protein analysis via total nitrogen quantification11, enabling comparison of nutritional potential across substrates and strains. Together, these measurements support evaluation of metabolic stability, substrate interactions, and biomass characteristics during cassava-based cultivation and adaptation to demonstrate that adapted E. gracilis lineage can grow robustly and consistently across multiple cassava by-products.
This method is most suitable for laboratory or applied research settings with access to basic microbiological infrastructure and locally available cassava-derived substrates. Practical considerations include the need for consistent handling of heterogeneous media, access to microscopy for monitoring culture health, and careful control of mixing to avoid shear stress during cultivation.
Protocol
This protocol uses non-pathogenic protists and cassava-derived plant substrates. Perform all procedures according to institutional biosafety and chemical safety requirements for cyanogenic plant materials.
1. Preparation and fermentation of Cassava-based media
CAUTION: Cassava-derived materials may contain cyanogenic glycosides and can release hydrogen cyanide under certain conditions. Perform all weighing, hydration, mixing, and sampling steps in a chemical fume hood. Wear a lab coat, nitrile gloves, and safety glasses. Decontaminate work surfaces after handling cassava substrates and dispose of solid and liquid waste as hazardous chemical waste according to institutional guidelines.
- Prepare garri suspensions
Note: The wild type Euglena gracilis was cultured under constant dark conditions at 28°C with orbital shaking at 120 x g. The composition of the heterotrophic nutrient medium was prepared as a defined formulation consisting of 1.5% glucose, 0.5% yeast extract, 0.1% KH2PO4, 0.1% MgSO4, 0.2% (NH4)2SO4, 0.01% CaCL2.2H2O plus 0.4 mL/L of vitamin stock solution (Vitamin B1: 2.50g/L; Vitamin B12: 12.5 mg/L; Vitamin B6: 0.5mg/L; Vitamin B7: 0.025 mg/L) and 2.0 mL/L of Trace metal stock solution (Na2EDTA.2H2O: 25.00 g/L; FeCl3.6H2O: 21.00 g/L; ZnSO4.7H2O: 11.0 g/L; MnCl2.4H2O: 4.0 g/L; CuSO4.5H2O: 0.39 g/L; H3BO3: 0.285 g/L; Na2MoO4.2H2O: 0.9 g/L).- Label each sterile 500 mL vented-cap flask with substrate type (garri), target concentration (10, 20, 30, 40, or 50 g L-1), replicate ID, and planned sterilization condition (autoclaved or non-autoclaved).
- Place a weigh boat on the analytical balance and press TARE/Zero to set the display to 0.000 g.
- Weigh garri to match the final working volume (e.g., for 300 mL, weigh 3.0 g for 10 g L-1, 6.0 g for 20 g L-1, 9.0 g for 30 g L-1, 12.0 g for 40 g L-1, or 15.0 g for 50 g L-1).
NOTE: The selected concentration range (10–50 g L-1) was designed to span conditions from baseline growth to high substrate loading, enabling assessment of adaptation across increasing physicochemical complexity. - Aseptically add the weighed garri into each sterile 500 mL flask containing 300 mL deionized or distilled water and reapply the vented cap.
- Mix each suspension for 3 min, until the mixture is homogenized using one of the following approaches.
NOTE: E. gracilis is sensitive to mechanical shear; therefore, mixing conditions were selected to minimize agitation-induced stress while maintaining adequate contact between cells and substrate.- For manual mixing, tighten the vented cap and swirl the flask by hand in a circular motion for 3 min until solids are evenly dispersed.
- For magnetic stirring, aseptically add a sterile stir bar to the flask, place the flask on a stir plate, and set the speed to 200 x g to form a shallow vortex without splashing.
- Allow the suspension to hydrate undisturbed for 10 min at room temperature (25 °C).
- Immediately prior to fermentation, gently homogenize the mixture by first tightening the vent cap and swirling the flasks by hand for 5 times to resuspend settled material.
NOTE: The garri used in this study was a commercially available cassava-derived product. Based on manufacturer-provided nutritional information, it primarily consisted of carbohydrates, with minor amounts of protein and negligible fat content. This composition reflects typical processed cassava substrates used in food and industrial contexts.
- Prepare additional cassava-product media
- Label each sterile 500 mL vented-cap flask with substrate type (dried pulp, pellets, peels, or animal feed), concentration (30 g L-1), replicate ID, and sterilization condition (autoclaved or non-autoclaved).
- Place a weigh boat on the analytical balance and press TARE/Zero to set the display to 0.000 g.
- Weigh substrate to achieve 30 g L-1 based on the working volume (e.g., for 300 mL, weigh 9.0 g).
- Aseptically add the weighed substrate into each sterile flask containing 300 mL deionized or distilled water and reapply the vented cap.
- Hydrate and mix each suspension using one of the following approaches.
- For manual mixing, tighten the vent cap and gently swirl the flask 10 times every 3 min during the hydration period.
- For magnetic stirring, aseptically add a sterile stir bar and stir at 200 x g until material is visibly hydrated and evenly dispersed.
- Visually inspect each suspension and confirm that solids are hydrated and that no large dry clumps remain.
NOTE: Do not filter cassava media unless required for a downstream analytical measurement.
- Aerobically ferment cassava-based media
- Confirm that each flask is fitted with a sterile gas-permeable vented cap to permit gas exchange while minimizing environmental contamination.
- Place flasks upright at room temperature (25 °C) in a designated area away from direct sunlight and away from high-traffic airflow.
- Incubate without agitation for a minimum of 72h.
- Record the fermentation start date and time for each flask and condition.
- Prepare autoclaved media
- Following fermentation, ensure each 500 mL flask contains ≤300 mL liquid (≤ two-thirds total volume) to prevent boil-over during sterilization.
- Loosen the vented cap to a “finger-tight” position suitable for autoclaving and apply autoclave indicator tape to the flask.
- Load flasks into the autoclave in an autoclave safe tray and select the P13 Liquid cycle.
- Ensure the sterilization parameters to 121 °C for 30 min (liquid sterilization) and start the cycle.
- After the cycle completes, allow the autoclave chamber pressure to return to atmospheric pressure before opening the door. Remove flasks using heat-resistant gloves and allow them to cool to room temperature.
- Store cooled flasks overnight at room temperature prior to inoculation.
CAUTION: Hot liquids and steam can cause burns. Open the autoclave door slowly and only remove flasks after pressure has equalized and liquids have cooled.
- Prepare non-autoclaved media
- Use fermented cassava media directly without autoclaving to preserve native microbial communities.
- Inoculate non-autoclaved media immediately after the 72h fermentation period to minimize unintended environmental contamination.
- Maintain consistent handling across replicates by using the same vessel type (sterile 500 mL vented-cap flasks), the same working volume (300 mL), and the same fermentation duration (≥72h) for all substrate conditions.
2. Establishment of E. gracilis starter Cultures
- Maintenance of E. gracilis stock cultures
- Inoculate E. gracilis into fresh heterotrophic nutrient medium and incubate cultures in complete darkness at 28 °C with continuous orbital shaking at 120 x g until cultures reach mid-logarithmic growth.
- Examine cultures using a compound light microscope (brightfield) 100×–400× total magnification (10× ocular with 10×–40× objectives) to confirm active motility, typical elongated cell morphology, and low levels of encystment.
NOTE: Viability was assessed based on the presence of intact cells with defined cellular boundaries and minimal debris. Active motility was defined as observable directional movement of cells within the field of view. Morphological stability was evaluated based on the predominance of characteristic cell shapes and low frequency of collapsed or highly irregular forms. - Exclude cultures exhibiting excessive cellular debris, abnormal morphology, or elevated encystment prior to use in adaptation experiments.
- Prepare inoculum for adaptation
- Gently homogenize starter cultures by tightening the vent cap and swirling the flasks by hand for 15 sec to ensure uniform cell distribution without inducing shear stress.
- Determine cell density using a Neubauer hemocytometer.
- Gently mix the culture by swirling by hand for 15 sec.
- Pipette 1.0 mL of culture into a sterile 1.5 mL microcentrifuge tube.
- Clean the hemocytometer and coverslip with 70% ethanol and allow to air-dry.
- Pipette 10 µL of culture onto the two grids on the hemocytometer and place the coverslip on the wet sample.
- Using brightfield microscopy (10× objective), focus on the grid and count cells in a defined set of squares (e.g., the 4 corner squares of the large grid).
- Apply standard boundary rules (count cells touching the top and left borders; exclude cells touching the bottom and right borders).
- Repeat counts on the second chamber (and/or reload) and calculate the mean cells/mL.
- Calculate cell density using the following equation: cells/mL= (mean cells per square × 104× dilution factor)/1
Note: To improve visualization of cells, dilute the sample with deionized water as needed (e.g. take an aliquot of 100uL of sample and dilute in 600 µL of deionized water, and repeat the cell density assessment)
- Adjust inoculation volumes to achieve a final inoculum of 5% (v/v) across all experimental media.
NOTE: The selected inoculum ratios are chosen to ensure sufficient initial cell density and maintenance of cultures. - Prepare separate inocula for each treatment condition to maintain consistent initial cell densities between experimental groups.
3. Initial Adaptation in autoclaved and Non-autoclaved cassava media
- Inoculate adaptation media
NOTE: Inoculum volumes were selected to balance sufficient initial cell density with sensitivity to adaptation effects, with lower volumes used during early adaptation and higher volumes used to maintain stable cultures during routine passaging.- Add the prepared E. gracilis inoculum to autoclaved and non-autoclaved cassava media prepared at final garri concentrations of 10 gL-1, 20 gL-1, and 30 gL-1.
- Use equal inoculation volumes across all treatment conditions to standardize initial cell density.
- To mix the cultures, tighten the vented cap and swirl the flask gently in a circular motion for 15 sec to distribute cells.
- Incubate cultures in complete darkness at 25 °C to initiate heterotrophic growth.
- Maintain culture conditions
- For non-autoclaved media, minimize agitation to preserve the native microbial community structure and substrate stratification.
- Mix all cultures once daily using gentle manual swirling for 15 sec to maintain contact between E. gracilis cells and suspended cassava material.
CAUTION: Avoid vigorous shaking or continuous agitation to prevent shear stress and unintended disruption of microbial-substrate interactions.
- Monitor early adaptation
- Every 48h, aseptically collect 1 mL samples from each culture using sterile pipette tips.
- Tighten the vented cap and gently swirl the culture flask for 15 sec prior to sampling to ensure even distribution of cells and suspended material.
- Transfer an aliquot of culture into a sterile 1.5 mL microcentrifuge tube.
- Dilute the sample with deionized water as needed to improve visualization of individual cells. (e.g. 100 µL of sample diluted in 600 µL of deionized water).
- Prepare wet-mount microscopy slide by pipetting 10 µL of the diluted sample onto a clean microscope slide and cover with a cover slide.
- Assess cultures by light microscopy
- Examine samples using a compound light microscope (brightfield) at 100×–400× total magnification (10× ocular with 10×–40× objectives).
- Assess cell motility, morphology, and frequency of encystment as indicators of adaptation status.
NOTE: Viability was assessed based on the presence of intact cells with defined cellular boundaries and minimal debris. Active motility was defined as observable directional movement of cells within the field of view. Morphological stability was evaluated based on the predominance of characteristic cell shapes and low frequency of collapsed or highly irregular forms.
- Every 48h, aseptically collect 1 mL samples from each culture using sterile pipette tips.
- Perform serial passage during adaptation
NOTE: Sampling and transfer intervals are provided as defined ranges to accommodate variability in growth dynamics while maintaining consistent experimental timing across replicates.- Every 7 days, aseptically transfer 20% (v/v) of each culture into freshly prepared cassava media of the same garri concentration and sterilization condition.
- Maintain consistent transfer volumes between passages to preserve selection pressure.
- Repeat serial passaging until cultures exhibit consistent growth, sustained motility, and low encystment frequency in 30 g L-1 cassava media.
Pause Point: Cultures may remain undisturbed for up to 24h between routine mixing and sampling steps.
4. High-concentration selection (30–50 g/L)
- Prepare high-load substrates
- Prepare garri-based cassava media at final concentrations of 30 gL-1, 40 gL-1, and 50 gL-1 by following the procedures described in Method 1.
- Allow substrates to fully hydrate during the fermentation period to ensure uniform exposure of cells to dissolved and particulate components.
- Gently resuspend settled particulates by swirling the flasks gently by hand for 10–15 sec immediately prior to inoculation.
- Inoculate high-load cultures
- Inoculate each high-concentration cassava medium with 5% (v/v) of the E. gracilis lineage previously adapted to 30 gL-1 garri.
- Standardize inoculation volumes across all concentrations to maintain comparable initial cell densities.
- Incubate cultures in complete darkness at 25 °C with continuous orbital shaking at 120 x g to maintain heterotrophic growth conditions.
- Mix cultures once daily by gentle manual swirling for 15 sec to maintain contact between cells and suspended substrate without inducing shear stress
- Monitor performance under high substrate load
- Inspect cultures every 48 h for visible changes in turbidity, pigmentation, and interaction between E. gracilis cells and sedimented cassava material.
- Aseptically collect small aliquots and examine cells using a compound light microscope at 100×–400× total magnification (10× ocular with 10×–40× objectives).
- Assess motility, cell morphology, and frequency of encystment as indicators of physiological tolerance to increased substrate concentration (Refer to Method 2).
- Confirm adaptation to high substrate concentrations
- Identify cultures that maintain sustained motility, consistent morphology, and low encystment frequency at cassava concentrations of ≥40 g L-1.
- Designate cultures meeting these criteria as the cassava-adapted gracilis lineage for subsequent experimental evaluation.
5. Comparative growth testing in Cassava product media
- Prepare paired test conditions
- For each cassava product, including garri, dried pulp, pellets, peels, and animal feed, prepare two identical vessels containing the same substrate concentration and volume.
- Inoculate one vessel with the cassava-adapted E. gracilis lineage and the paired vessel with the non-adapted wild-type strain.
- Use equal inoculation volumes for each paired condition to ensure comparable initial cell densities between lineages
- Maintain paired cultures
- Incubate all paired cultures in complete darkness at 25 °C with continuous orbital shaking at 120 x g to maintain heterotrophic growth conditions.
- Mix cultures once daily by gentle manual inversion to maintain contact between cells and suspended substrate.
- Record visible changes, including turbidity, pigmentation, and settling patterns, throughout the incubation period.
- Record observed morphological differences
- At defined sampling intervals, aseptically collect aliquots from each culture for microscopic analysis (refer to Method 2.2 for aliquot collection and microscope analysis)
- Examine samples using a compound light microscope (brightfield) at 100×–400× total magnification (10× ocular with 10×–40× objectives).
- Document differences between adapted and wild-type cultures with respect to motility, encystment frequency, and overall cell morphology.
6. pH Monitoring
- Collect pH samples
- At Days 0, 3, 6, 9, and 12, aseptically withdraw 1 mL of culture from each experimental condition using sterile pipette tips.
- Allow samples to stand undisturbed for 2 min to permit settling of suspended solids.
- Carefully transfer the clarified supernatant to a clean microcentrifuge tube without disturbing the settled material.
- Measure pH
- Calibrate the pH meter according to the manufacturer’s instructions using appropriate standard buffers prior to measurement.
- Insert the calibrated pH probe into the clarified supernatant without disturbing any residual settled material.
- Record pH values immediately after pH reading has stabilized.
- Rinse the probe thoroughly with deionized water between samples to prevent cross-contamination.
7. Cyanide Testing Using Colorimetric Strips
CAUTION: Cyanide-containing supernatants are hazardous. Perform all sampling and testing steps in a chemical fume hood or well-ventilated area. Wear appropriate personal protective equipment, including gloves and eye protection. Avoid direct skin contact with samples and test strips and dispose of used strips and liquid waste according to institutional hazardous chemical waste disposal guidelines.
- Collect cyanide samples
- At Days 0, 4, 8, and 12, aseptically withdraw 1 mL of culture supernatant from each experimental condition using sterile pipette tips.
- Allow samples to stand undisturbed for 2 min to permit settling of suspended solids.
- Carefully collect the clarified supernatant without disturbing particulate material.
- Perform a colorimetric cyanide assay.
- Immerse a colorimetric cyanide test strip test into the clarified supernatant for the duration specified by the manufacturer.
- Remove the strip and allow full color development for the recommended time under ambient conditions.
- Compare the developed strip to the manufacturer-provided reference scale to determine cyanide concentration.
- Record cyanide levels
- Record cyanide concentrations for each sample at all time points according to the reference scale.
- Photograph each developed test strip alongside the reference scale or retain the strip according to manufacturer recommendations for future verification.
8. Maintenance and Consolidation of Adapted E. gracilis Cultures
- Combine adapted cultures
- After successful adaptation at cassava concentrations of ≥40 gL-1 garri, visually confirm the presence of viable E. gracilis cells in each replicate culture.
- Gently combine all replicate flasks of the adapted lineage into a single sterile vessel using aseptic technique to generate a homogeneous master culture.
- Prepare maintenance media
- Prepare fresh cassava-based media at the selected maintenance concentration by following the procedures described in Method 1.
- Select either autoclaved or non-autoclaved media based on downstream experimental requirements.
- Maintain the same sterilization condition across all subsequent passages to ensure consistency in microbial exposure.
- Inoculate maintenance cultures
- Inoculate fresh maintenance media with 20% (v/v) of the consolidated master culture.
- Gently mix cultures by manual swirling to evenly distribute cells without inducing shear stress.
- Incubate cultures under complete darkness at 25 °C with continuous orbital shaking at 120 x g to maintain heterotrophic growth conditions.
- Perform routine maintenance and passaging
- Maintain cultures by gentle manual inversion once daily to prevent prolonged sedimentation of cells and substrate material.
- Every 30 days, consolidate maintenance cultures by combining replicate flasks using aseptic technique.
- Re-inoculate fresh maintenance media using the consolidated culture as described in Section 8.3.
- Monitor culture stability
- At each passage, assess cell morphology and motility using a compound light microscope (brightfield) at 100×–400× total magnification (10× ocular with 10×–40× objectives).
- Record shifts toward increased encystment, accumulation of cellular debris, or reduced motility as indicators of declining culture stability.
9 Biomass Harvesting for Downstream Protein Analysis
- Collect culture samples
- At the desired endpoint, transfer culture volumes into sterile centrifuge tubes.
- Ensure samples are representative of the full culture by mixing gently by swirling the culture flasks prior to transfer.
- Harvest biomass by centrifugation
- Centrifuge samples at ≥3,500 × g for 10 min to pellet the biomass. Repeat this step if sediment has not completely settled.
- Confirm formation of a compact cell pellet at the bottom of the tube.
- Remove supernatant
- Carefully decant or pipette off the supernatant without disturbing the pellet.
- Dispose of supernatant according to laboratory waste protocols.
- Prepare biomass for downstream analysis
- Retain the cell pellet for further processing (e.g., drying, storage, or protein analysis).
- If not processed immediately, store pellets at 4 °C for short-term use or freeze as appropriate for long-term storage.
10. Data Handling and Archiving
- Organize dataset
- Enter all quantitative measurements, including pH, cyanide concentration, viability assessments, cell counts, and biomass values, into a labeled electronic spreadsheet.
- Save microscopy images and associated observational notes using standardized file names that indicate substrate type, concentration, strain identity, replicate number, and sampling date (e.g., NAG40G_WT1_05-01-25).
- Prepare datasets for analysis
- Verify that all experimental replicates and scheduled time points are represented and complete within the dataset.
- Digitize any handwritten laboratory notes and back up all electronic files to secure storage to prevent data loss. Data analysis and figure generation were performed using spreadsheet software (Microsoft Excel) and, where applicable, R (R Foundation for Statistical Computing). All core analyses can be reproduced using spreadsheet-based calculations, with R used only for supplemental visualization.
Results
The following representative results illustrate the expected outcomes when the described protocol is applied successfully, as well as the range of outcomes observed under suboptimal conditions. Representative data corresponding to these outcomes are shown in Figure 1, Figure 2, Figure 3, Figure 4, Figure 5, Figure 6, Figure 7. Together, these results provide practical guidance for interpreting growth dynamics, viability, morphology, and protein outcomes when adapting E. gracilis to cassava-based substrates under heterotrophic, fully dark cultivation conditions. Moreover, these results validate key biological outcomes of the protocol, including successful adaptation, sustained growth, high viability, stable morphology, consistent performance across substrates, and measurable protein production.
Throughout the experiments, three replicates per treatment (all types of cassava media) were utilized. We acknowledge that the number of replicates is up to the discretion and logistical limitations of any group following the protocols above. Successful application of this protocol results in sustained heterotrophic growth of E. gracilis in garri-based media under fully dark conditions. Positive outcomes are characterized by smooth, sigmoidal growth trajectories, limited divergence among replicates, and stable late-phase cell densities. Morphological traits that signified positive outcomes and were consistently observed in adapted populations included cell roundness and thick cell membranes. In contrast, unhealthy collapsed cells typically appear irregular, fragmented, or structurally compromised and are associated with reduced viability, distinguishing them from intact rounded or semi-encysted forms observed in adapted cultures. For reference, representative images of wild-type E. gracilis exhibiting characteristic elongated morphology are included (Figure 8) to distinguish baseline cellular structure from adapted or altered forms. Cultures grown at 30 g L-1 garri exhibited higher integrated growth, as measured by area under the growth curve (AUC), compared with lower concentrations, suggesting more efficient utilization of the cassava substrate and successful physiological adaptation (Figure 1).
Suboptimal outcomes are commonly observed at lower garri concentrations (10–20 g L-1), where growth is detectable but reduced in magnitude and more variable across replicates. At higher concentrations (40–50 g L-1), cultures may reach elevated peak cell densities; however, these conditions frequently display delayed stabilization or increased temporal variability (Figure 2).
In successful experiments, cell viability remains high throughout the culture period, with only minor mid-experiment fluctuations. Trypan Blue exclusion assays indicate that cultures maintained at 30 g L-1 garri retain a high proportion of viable (unstained) cells relative to non-viable (blue-stained) cells across sampled time points (Figure 3). Deviations from this pattern, including an increased proportion of stained cells, reduced motility, or shifts toward rounded or collapsed morphologies, may indicate suboptimal conditions and serve as early triggers for troubleshooting. Viability and morphological assessments were based on consistent observational criteria, including cell integrity, directional motility, and the relative prevalence of elongated versus rounded or collapsed forms.
Suboptimal outcomes are characterized by transient reductions in viability, most commonly observed at higher garri concentrations. Partial recovery may be observed at later time points; however, these conditions display increased variability in viability across the culture period (Figure 4). These growth patterns show that intermediate substrate concentrations (e.g., 30 g L-1) provide a balance between nutrient availability and stress, resulting in more stable growth. These trends reflect the impact of preprocessing conditions and staged adaptation on culture performance, as gradual exposure to increasing substrate complexity supports improved physiological stability and reproducible growth behavior. Lower concentrations limit biomass production, while higher concentrations lead to greater variability and delayed stabilization.
Morphological assessment provides a qualitative indicator of adaptation status. Positive outcomes include the emergence and persistence of rounded or semi-encysted cells with reduced motility that remain intact across repeated subculturing (Figure 5).
By contrast, suboptimal cultures, most associated with wild-type strains or early-stage adaptation, exhibit abrupt transitions from elongated, motile cells to irregular or collapsed morphologies that coincide with reduced growth stability.
When the protocol is applied to additional cassava-derived substrates, including pulp, pellets, and peels, adapted E. gracilis cultures display reproducible growth across multiple substrate types. Positive outcomes are characterized by earlier stabilization of growth curves and reduced late-stage decline relative to wild-type cultures (Figure 6).
Suboptimal outcomes include delayed growth initiation or increased replicate variability, particularly in substrates with greater physical heterogeneity.
Successful implementation of the protocol yields E. gracilis biomass with measurable crude protein content, as quantified by external laboratory analysis using the Combustion (Dumas) method. Protein percentages observed in adapted cultures are comparable to those measured in wild-type cultures, with higher total protein output corresponding to increased biomass accumulation (Figure 7).
Monitoring of media chemistry supported culture–substrate interactions during adaptation and validated the inclusion of pH and cyanide measurements within the protocol. pH values showed gradual shifts over time, indicating metabolic activity and substrate utilization, with more stable trends in adapted cultures. Cyanide measurements further supported this, as adapted cultures showed reductions in detectable levels, while wild-type cultures remained more variable. Together, these results demonstrate that these monitoring steps effectively capture changes in media chemistry associated with adaptation and support interpretation of culture performance. Although the underlying mechanisms were not investigated, this represents an important area for future research, particularly for industrial-scale applications.
The long-term maintenance and consolidation workflow supported continued viability of the adapted Euglena gracilis lineage over extended culture periods. Cultures maintained through repeated passaging consistently retained motility, characteristic morphology, and stable growth behavior across maintenance cycles. Although long-term performance was not quantitatively assessed, these observations provide representative evidence that the adapted lineage can be reliably maintained under the specified conditions.
Together, these results confirm that the adaptation protocol supports robust growth, viability, and biomass production of E. gracilis across cassava-based substrates, with consistent performance and reduced cyanide levels over time.
All figures and tables are provided as separate files and are not embedded within the manuscript document. Figure and table placement preferences are indicated within the manuscript text using bracketed notes (e.g., (Figure 1)). Unless otherwise specified, all figures and tables are intended to appear below the Representative Results section in the final publication.
All figures are submitted as individual files, with multipaneled figures provided as a single combined image. Microscopy images include scale bars in each panel. Data figures include labeled axes with defined measurement units, and error bars are specified in the corresponding figure legends.
All tables are submitted as individual .xls or .xlsx files and contain raw or summarized numerical data without decorative formatting.
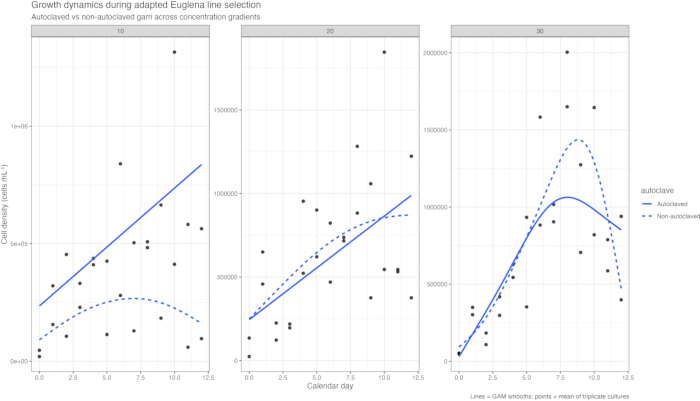
Figure 1: Growth dynamics of E. gracilis cultured at 10, 20, and 30 gL-1 garri under fully dark conditions. Mean cell densities are shown over time for each substrate concentration. Error bars represent SEM across biological replicates. Please click here to view a larger version of this figure.
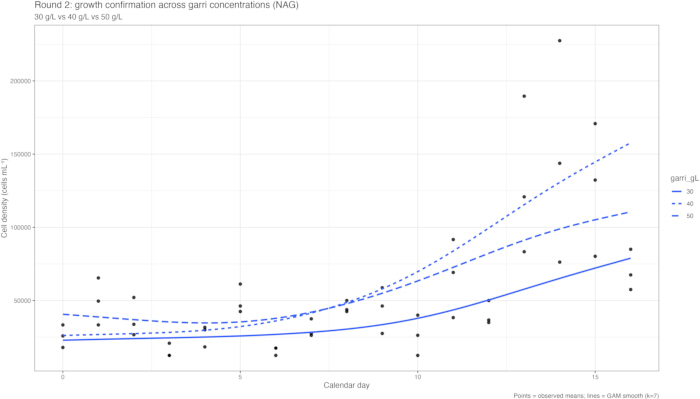
Figure 2: Growth performance of E. gracilis at elevated garri concentrations (30–50 g L-1). Cell density trajectories illustrate differences in peak density, stabilization timing, and variability across higher substrate concentrations. Please click here to view a larger version of this figure.
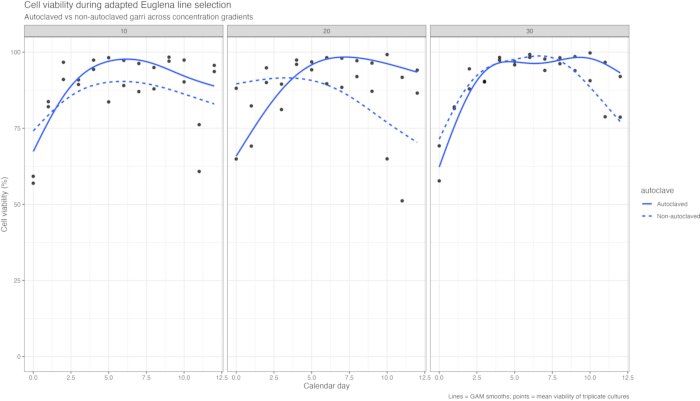
Figure 3: Cell viability trends of E. gracilis cultured at 30 gL-1 garri measured by Trypan Blue exclusion. The proportion of viable cells is shown across sampled time points. Please click here to view a larger version of this figure.
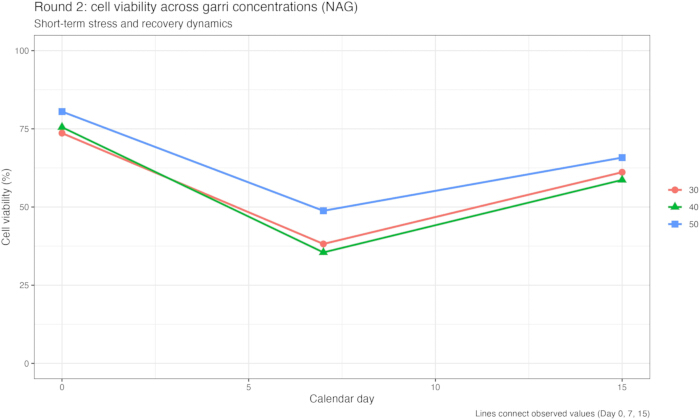
Figure 4: Viability fluctuations of E. gracilis cultured at higher garri concentrations. Transient changes in cell viability are shown across the experimental period. Please click here to view a larger version of this figure.
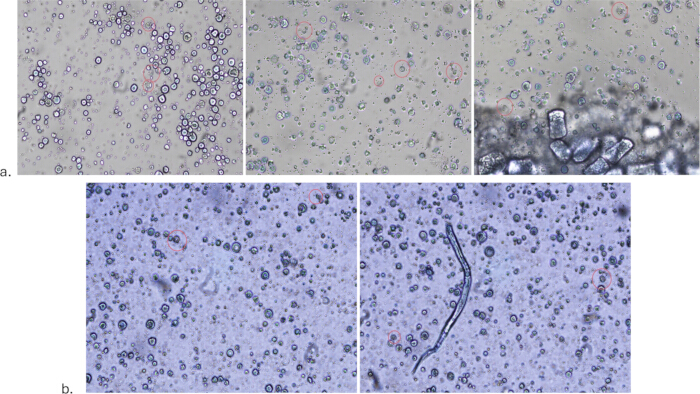
Figure 5: Representative morphology of adapted E. gracilis populations. Representative inverted light microscopy images show rounded and semi-encysted cells observed following adaptation. Scale bar = XX µm. Please click here to view a larger version of this figure.
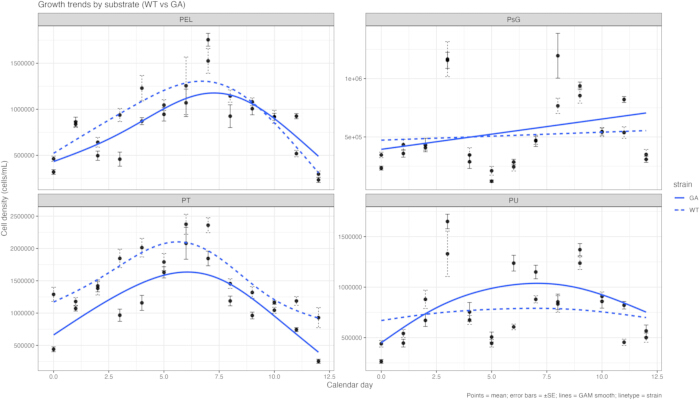
Figure 6: Growth performance of adapted and wild-type E. gracilis across cassava-derived substrates. Growth trajectories are shown for adapted and wild-type cultures cultivated on multiple cassava products. Please click here to view a larger version of this figure.
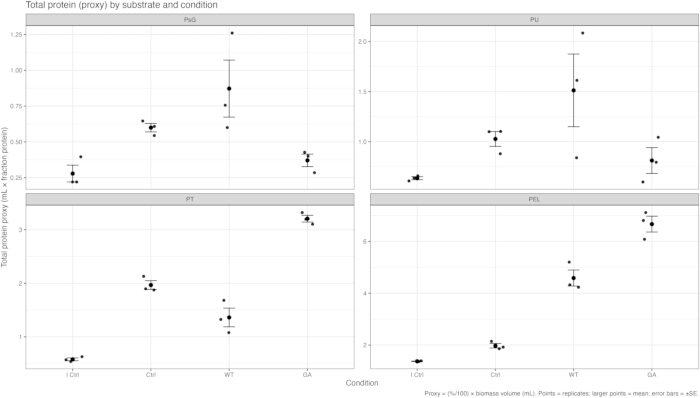
Figure 7: Crude protein content and total protein output of cassava-grown E. gracilis biomass. Protein content was quantified by external analysis using the SGS Combustion (Dumas) method. Total protein output is shown alongside biomass accumulation. Please click here to view a larger version of this figure.
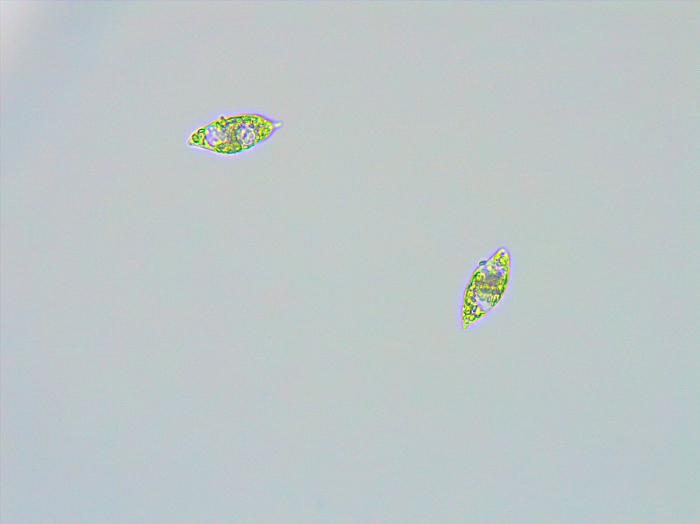
Figure 8: Representative morphology of wild-type E. gracilis under standard conditions (40X magnification). Representative image of healthy, non-adapted Euglena gracilis showing characteristic elongated morphology under light microscopy. Please click here to view a larger version of this figure.
Discussion
A central determinant of success in this protocol is the balance between cassava substrate concentration and physiological stability during heterotrophic cultivation of E. gracilis. Cassava-derived materials introduce physical heterogeneity, residual particulates, and variable nutrient release kinetics that directly influence growth behavior and culture stability2,3. Among the protocol steps, substrate preparation and concentration selection therefore represent the most sensitive control points. As demonstrated by the Representative Results, intermediate substrate concentrations reliably support sustained growth with limited replicate divergence, whereas lower concentrations constrain biomass accumulation and higher concentrations increase temporal variability and transient stress responses. These outcomes underscore that maximal substrate loading does not necessarily yield optimal or stable cultivation performance when working with heterogeneous agro-industrial materials. The selected preprocessing steps and substrate concentration ranges were designed to progressively challenge E. gracilis under increasing chemical and microbial complexity. The observed differences in growth stability and viability across these conditions support the validity of this staged approach and confirm that intermediate substrate concentrations provide a balance between nutrient availability and physiological stress.
Culture handling during heterotrophic growth further influences adaptation outcomes. Consistent but gentle mixing under fully dark conditions was critical for maintaining contact between E. gracilis cells and suspended substrate material while avoiding excessive shear stress. Insufficient mixing promoted sedimentation and localized nutrient gradients, confounding both growth and viability measurements, particularly in non-autoclaved media12. These observations align with previous reports showing that spatial heterogeneity and uneven substrate exposure can obscure physiological responses in microbial cultivation systems. The protocol therefore emphasizes routine inversion rather than continuous agitation as a practical compromise between homogeneity and culture integrity.
To accommodate variability inherent to cassava-based substrates, the protocol incorporates multiple troubleshooting and flexibility points. Autoclaving fermented cassava media improved short-term consistency by reducing microbial load and altering substrate structure, particularly during early adaptation stages. In contrast, non-autoclaved media can be used effectively following successful adaptation, provided inoculum density and mixing were sufficient to maintain stable growth. This staged approach is consistent with prior studies demonstrating that gradual selective pressure enables microbial populations to tolerate increasing environmental complexity over time13,14. Longitudinal monitoring was essential in this context, as transient reductions in growth or viability frequently recovered during subsequent passages without compromising overall adaptation success.
Viability assays and morphological monitoring served as rapid diagnostic tools throughout the adaptation process. Trypan Blue exclusion provided a quantitative indicator of physiological robustness, while microscopy-based assessment of motility and encystment offered early warning of suboptimal conditions such as excessive substrate loading or delayed acclimation15. Importantly, the protocol emphasizes trends across time rather than single-point measurements, as short-term fluctuations in viability or morphology were not always predictive of long-term culture failure. This longitudinal perspective proved critical for distinguishing transient stress responses from sustained physiological decline. Reductions in detectable cyanide levels observed during cultivation suggest partial detoxification of cassava-derived substrates under the conditions described. These reductions may result from a combination of fermentation-associated degradation, volatilization, and microbial activity. While the specific biochemical mechanisms and kinetics of cyanide removal were not directly investigated in this study, these observations support the inclusion of cyanide monitoring as a practical indicator of substrate transformation and culture feasibility during adaptation.
Several limitations of the method should be acknowledged. First, crude protein percentage alone does not fully capture nutritional value or functional protein quality, and interpretation must consider total biomass output alongside compositional metrics16. Second, the use of minimally processed, heterogeneous substrates introduce variability that cannot be eliminated, even with standardized preparation. This challenge is well recognized in agro-industrial bioprocessing17 and reflects real-world constraints rather than experimental shortcomings. Third, while the protocol is optimized for laboratory- and pilot-scale cultivation, scale-up beyond bench-scale volumes will require additional control of mixing dynamics, oxygen transfer, and solids handling, as well as consideration of reactor configuration and hydrodynamic conditions, as has been shown for other microalgal and protist systems18.
In comparison to existing E. gracilis cultivation methods that rely on refined sugars or tightly controlled phototrophic systems, this protocol offers a distinct methodological advantage by enabling growth on low-cost cassava-derived substrates under fully heterotrophic conditions. The approach avoids dependence on purified carbon sources19,20 and does not require specialized lighting infrastructure, expanding the operational flexibility of E. gracilis cultivation. This is particularly relevant for applications focused on resource efficiency, waste valorization, and decentralized production in cassava-producing regions.
The broader significance of this method lies in its applicability to research areas focused on microbial adaptation, sustainable bioprocessing, and biomass valorization. By coupling incremental substrate exposure with simple, low-cost monitoring tools, the protocol provides a reproducible framework for integrating non-traditional substrates into microbial cultivation workflows. Although developed for E. gracilis, the underlying principles of staged adaptation, longitudinal performance assessment, and morphology-informed decision-making are broadly transferable to other microalgal and protist systems being explored for circular bioeconomy applications21,22. As such, this protocol serves not only as a cultivation method but also as a generalizable framework for applied microbial adaptation under real-world substrate constraints. This method was designed with accessibility as a primary goal and is therefore most suitable for laboratories or applied research settings with basic microbiological infrastructure and access to key biological resources, specifically Euglena gracilis cultures and cassava-derived substrates. Additionally, the system offers temporal flexibility, as cassava-based media can be prepared and fermented year-round without seasonal constraints. While this protocol was developed and validated at the laboratory scale, its use of low-cost cassava-derived substrates and minimal processing requirements supports potential scalability to larger cultivation systems.
While this protocol establishes a reproducible framework for adaptation and cultivation, further quantitative analyses of growth kinetics, biomass productivity, and substrate conversion efficiency will be important for optimizing performance in scaled or industrial applications.
Disclosures
The authors declare no competing financial interests or conflicts of interest.
Acknowledgements
The authors thank Psaltry International Company Ltd. for supplying cassava-derived materials and for contributing to the definition of applied research objectives relevant to industrial cassava processing.
The authors acknowledge Resourced Global Inc. (Lead of the Rockefeller Foundation supported NFAL Program).
The authors acknowledge Société Générale de Surveillance (SGS) for conducting external crude protein analyses using the Combustion (Dumas) method. Additional laboratory support and methodological feedback were provided by members of the Trent University research community.
This work was supported in part by partner-supported applied research initiatives.
Materials
| Name | Company | Catalog Number | Comments |
|---|---|---|---|
| Autoclave - 533LS Steam Sterilizer | Getinge | 533LS | Steam sterilization of cassava media. Sterilize media using liquid cycle. |
| Bright-Line™ Hemacytometer replacement cover slip | Millipore Sigma | BR723015- 100EA | Specialized thick coverslips designed for hemocytometer use. |
| Cassava dried pulp | Psaltry International | N/A | Provided cassava substrate |
| Cassava pellets | Psaltry International | N/A | Provided cassava substrate |
| Cassava peels | Psaltry International | N/A | Provided cassava substrate |
| Cassava substrate (garri) | Local supplier | N/A | Cassava-derived garri feedstock used as carbon source; prepared with deionized water. |
| Centrifuge Thermo Scientific Sorvall ST16 Centrifuge | Thermo Scientific Sorvall ST16 Centrifuge | 75004241 | Capable of ≥3,500 × g, used for harvesting biomass. |
| Centrifuge tubes E.g. Axygen (A Corning Brand) | Corning | MCT-150-C-S | Sterile, minimum 1.5 mL volume |
| Clean water E.g. UltraPure™ DNase/RNase- Free Distilled Water | ThermoFisher Scientific | 10977035 | Deionized or distilled. Used for media preparation |
| Compound light microscope | Olympus | N/A | Standard compound microscope suitable for routine cell observation and counting. |
| Cyanide Test Strips, colorimetric. CN- 10-30 mg/L | MQuant | 110044 | Semi-quantitative cyanide detection. Dispose as hazardous waste |
| Sterile Standard Weighing Boat | Fisher Scientific | 01-549-750 | Used for weighing cassava substrates and dry biomass. |
| Euglena gracilis (adapted lineage) | N/A | N/A | Cassava adapted strain generated in this study |
| Euglena gracilis (Wild-type) | N/A | N/A | Non-adapted reference strain. Maintain the same standard conditions. |
| Euglena growth medium components | Various | N/A | Basal Euglena medium prepared according to laboratory standard formulations. |
| FreeZone 6 Liter Console Freeze Dryer | Labconco | 70061xxxx | Used for biomass dehydration |
| Hemocytometer with Standard Lines | Weber Scientific | NC1587539 | Used for manual cell counting. |
| Magnetic stirrer with hot plate | IKA | N/A | Optional; improves consistency during media preparation and substrate suspension. |
| Micropipettes (P20, P200, P1000) | Eppendorf | N/A | Adjustable volume pipettes used for aseptic liquid transfers. |
| Mini-centrifuge | Eppendorf | N/A | Optional; facilitates rapid pelleting during biomass harvesting. |
| Parafilm | Bemis | PM996 | Used for temporary sealing of flasks or plates when vented caps are unavailable. |
| pH indicator strips | Fisher Scientific | 13-640-520 | Alternative to pH meter for rapid qualitative assessment of culture media. |
| pH meter with probe Thermo Scientific Orion Star A211 Benchtop pH Meter | Thermo Scientific Orion Star A211 Benchtop pH Meter | 13-645-519 | Calibrated before use. For measuring the pH of the culture supernatant |
| Refrigerated storage (4°C) | Frigidaire | FRT18S6JW7 | Short term storage of media |
| Shaking incubator (dark) | Thermolyne | M49235 | Orbital shaking incubator capable of 100–150 RPM, temperature range 24–28 °C; used under dark conditions to support heterotrophic Euglena growth. |
| Spray bottle (32oz) | Boardwalk | BWK03010 | Used for benchtop sterilization and routine aseptic handling (70% ethanol solution) |
| Spreadsheet software | Microsoft Excel | N/A | Data collection, organization and analysis |
| Sterile pipette tips | Eppendorf | N/A | Sterile, disposable tips compatible with P20, P200, and P1000 pipettes. |
| Sterile serological pipettes (5, 10, 25 mL) | Corning | N/A | Individually wrapped sterile pipettes used for culture transfers and sampling. |
| Trypan Blue solution 0.4%, liquid, sterile-filtered, suitable for cell culture | Sigma-Aldrich | T8154 | Vital dye used for cell viability assessment via Trypan Blue exclusion assay. |
| Tubes for sample collection (50 mL) | Falcon | 14-432-22 | For pH and cyanide sampling |
| Vent-cap Erlenmeyer flasks (250–500 mL) | Corning® 250 mL Polycarbonate Erlenmeyer Flask with Vent Cap | 431144 | Polycarbonate Erlenmeyer flasks with vented caps; autoclavable; used for both sterile and non-sterile liquid cultures. |
| Waste containers | Various - in compliance with set laboratory standards | N/A | Autoclave bags and sharps or glass waste containers for biosafety-compliant disposal. |
Reprints and Permissions
