A single-center retrospective study developed and internally validated a staged nursing prediction tool that combines baseline patient surgical risk with modifiable perioperative care processes to support preoperative assessment and post-positioning risk updates for positioning-related complications in a hybrid digital subtraction angiography operating room.
Method Article
A Predictive Nursing Tool for Patient Positioning Safety in Hybrid Digital Subtraction Angiography Operating Rooms
In This Article
Summary
Abstract
The aim of this study was to develop and internally validate a phase-updating nursing predictive assessment tool based on baseline patient-surgical risk and modifiable nursing processes for use before surgery and after positioning in the hybrid digital subtraction angiography operating room. This single-center retrospective cohort included inpatient adults undergoing their first procedure in the hybrid operating room, with surgery as the unit of analysis and follow-up to 72 h postoperatively. The outcome was a composite endpoint of position-related complications.
Missing predictor data were handled using multiple imputation (m = 10), and extraction consistency was assessed with Cohen κ and intraclass correlation coefficients. Candidate variables from univariable screening plus prespecified variables entered least absolute shrinkage and selection operator regression, followed by multivariable logistic modeling and nomogram construction with threshold-based risk stratification. Model performance was evaluated by area under the curve, calibration intercept and slope, Brier score, bootstrap internal validation, and decision curve analysis.
A total of 1,936 cases were analyzed, and the composite outcome occurred in 10.23%. Maximum missingness of key variables was 3.25%, and extraction consistency was good (κ ≥ 0.86, intraclass correlation coefficient ≥ 0.89). Twelve predictors were retained; pressure-point protection and intraoperative position checks were protective (odds ratio 0.68–0.71). The baseline model had an area under the curve of 0.74/0.72 (apparent/corrected), and the full model achieved 0.79/0.77. The optimism-corrected calibration slope was 0.947, the intercept was 0.004, and the Brier score was 0.085.
This tool showed stable discrimination, calibration, and net benefit on internal validation. Nursing process variables added value, and the tool may support preoperative assessment and post-positioning risk updating, pending external validation.
Introduction
The hybrid digital subtraction angiography (DSA) operating room integrates interventional imaging with open surgery and serves as a platform for managing complex vascular disease and critical emergencies1. The procedural chain is longer, many patients are elderly, and general anesthesia or sedation diminishes protective reflexes and spontaneous adjustment2. Constrained by the C-arm, the sterile field, and the layout of access routes, opportunities to turn the body and relieve pressure are reduced once positioning is fixed, while exposure to sustained pressure and stretch/traction increases3. Concurrent hybrid procedures further reduce adjustment windows, and positioning management relies more on team coordination. Position-related complications include pressure injuries, peripheral nerve and musculoskeletal injury, and may also present as positioning-induced respiratory and hemodynamic fluctuations, affecting postoperative recovery4,5.
The nursing team bears key responsibility for positioning, pressure-point protection, access securement, intraoperative position check, and postoperative observation; early identification of positional risk and precise intervention are core topics in nursing management, with a greater need for standardized, process-based verification and documentation6. Existing perioperative risk assessments mostly rely on preoperative generic scales or focus on a single outcome7. Much of the evidence comes from the operating room or interventional suite and fails to cover the composite exposures in the hybrid DSA operating room, such as prolonged inability to turn, fluctuations in perfusion and temperature, and sheath indwelling with compression fixation. Tools such as Braden emphasize skin tolerance but are not well suited to characterize specific factors such as the prone position and cumulative exposure to hypotension, making it difficult to support stratified management8. The complication spectrum features coexisting skin injury and physiologic instability, and a single score is insufficient to identify process priorities9.
Some studies have directly treated nursing measures as preoperative predictors, which readily leads to purpose mismatch and information leakage, making outputs difficult to align with the timing and intensity of interventions and unfavorable quality improvement after risk adjustment10. There is a lack of an assessment tool that provides a preoperative baseline risk and updates risk after positioning, with corresponding actionable items. In this study, based on a single-center retrospective cohort, a nursing predictive assessment tool was developed; before surgery, baseline risk was estimated using patient and surgical exposure variables, and after positioning, modifiable nursing items were incorporated to update risk. Penalized regression was used for variable selection with internal validation; discrimination, calibration, and net benefit were evaluated; and a nomogram and threshold-based stratification were produced for nursing decision support, providing a basis for risk adjustment and quality improvement.
Protocol
This study involves human subjects’ prior medical records and anesthesia and nursing record data. The study was conducted in compliance with the relevant institutional guidelines, reviewed and approved by the institutional ethics committee (Run Run Shaw Hospital Ethics Review 2025 Research No. 2113), with a waiver of written informed consent; all data were de-identified before export and used only for the purposes of this study.
This study was reported in accordance with the TRIPOD statement for multivariable prediction model development and internal validation; the completed TRIPOD checklist is provided in Supplemental Table S1.
1. Research design and study setting
- Define the study design as a single-center retrospective observational study using a historical cohort design. Fix the study time frame to January 1, 2021, through December 31, 2024.
- Set the study objective as developing a nursing predictive assessment tool for position-related complications in the hybrid DSA operating room and performing internal validation and performance evaluation. Define “surgery” as the unit of analysis and assign each surgery a unique identifier (e.g., inpatient number + surgery date + anesthesia start time).
- When the same patient has multiple eligible surgeries, retain only the first eligible surgery record. Define “first” as the eligible surgery with the earliest anesthesia or sedation start time within the study time window.
- Define the data extraction start point as the time the patient enters the operating room and anesthesia or sedation begins. Fix the follow-up endpoint at 72 h postoperatively, thereby covering the primary occurrence window of position-related complications.
- Limit the study setting to the hybrid DSA operating room and document that it is equipped with a flat-panel digital subtraction angiography system and open surgery capability. Record that the commonly used positions are supine, prone, and lateral, and that intraoperative position adjustment is limited by the imaging equipment, the sterile field, and the layout of access routes, resulting in fewer opportunities to turn and a relatively prolonged operative duration.
2. Study population, case screening flow, and sample size strategy
- Export all “hybrid DSA operating room” surgery entries within the study time window from the consecutively registered operating room register. Retain matching fields such as the procedure code, operating room identifier, surgery date, inpatient number, and anesthesia start time.
- Use the inpatient number and surgery date for the initial match, and perform a secondary check using the anesthesia start time and operating room identifier. If multiple anesthesia records exist on the same day for the same inpatient number, preferentially match the one with a consistent operating room identifier and an anesthesia start time closest to the surgery registration time.
- Include inpatient adult patients aged ≥18 years whose surgeries were completed in the hybrid DSA operating room and were neurovascular, cardiovascular, or peripheral vascular interventional or hybrid procedures. Confirm that general anesthesia or sedation was administered during surgery, that the medical, anesthesia, and nursing documentation are complete, and that follow-up to 72 h postoperatively is available.
- Exclude cases in which the primary outcome event was already present preoperatively to avoid a nonzero baseline for the outcome. Exclude cases in which the procedure was interrupted intraoperatively for reasons unrelated to positioning, such that further evaluation was not possible, as well as cases transferred out of the hospital within 72 h postoperatively, leading to an indeterminate outcome.
- Determine the threshold for missingness of key predictor variables by calculating the proportion of missingness for each case across prespecified key predictor variables and record the reasons for missingness. If the missingness proportion for a case across these key predictor variables exceeds 30%, exclude the case according to the prespecified rules and document the reason for exclusion in the screening log.
- Have two researchers independently complete the screening and generate screening logs (including inclusion/exclusion and reasons). For discrepant cases, have a third researcher trace back to the original records for adjudication, and retain the adjudication record for traceability.
- Do not predefine an upper limit for sample size, adopting a consecutive all-case inclusion strategy. Control model complexity by the number of events, determining the number of parameters ultimately entered into the model according to the principle of at least 15 events per parameter.
3. Study measures and variable definitions
- Establish a variable dictionary and specify for each variable the source system, field name, value rules, and temporal sequence. For continuous variables, use the most recent preoperative laboratory or assessment value; for surgical and anesthesia variables, use the worst value recorded over the entire procedure or cumulative exposure; for nursing and device variables, use the actual intraoperative implementation. Define prespecified thresholds and category cutoffs a priori according to clinically commonly used criteria, perioperative nursing and anesthesia practice, and published literature. When no single widely accepted cutoff is available, use pragmatic categories to facilitate recording, interpretation, and clinical application.
- Primary outcome: composite outcome of position-related complications
- Define the primary outcome as a composite outcome of position-related complications occurring from intraoperative through 72 h postoperatively. If multiple component events occur in the same case, count the composite outcome once only, and record the time of first occurrence and all component types for secondary analyses.
- Define new-onset stage 2 or higher-pressure injury or deep tissue injury within 72 h postoperatively as one of the component events. Use nursing skin assessment form, staging, and nursing records as evidence, and require records that can be localized to specific anatomic sites.
- Define peripheral nerve injury as the occurrence of sensory loss, numbness, or decreased muscle strength lasting ≥24 h. Require that the anatomic distribution is consistent with the contact/traction area of the position at the time, and use progress notes or specialist assessment records as the main evidence.
- Define joint or musculoskeletal injury as localized pain accompanied by positive imaging findings or specialist physical examination findings suggesting traction/compression injury. Record the imaging modality or examination conclusion, and mark the position-related points of force application.
- Define position-related respiratory or hemodynamic instability events as airway compression, restricted respiration, or restricted venous return caused by positioning that requires repositioning, compression, vasopressor escalation, or interruption of the procedure. Use anesthesia system event records, anesthesia record sheets, and nursing/physician records containing explicit “position-related” descriptions and the corresponding management measures as evidence.
- Define a hematoma with a diameter ≥5 cm on the puncture side or oozing requiring additional compression fixation, with records indicating aggravation related to positional constraints, as one of the component events. Use nursing records and physician ward-round records within 72 h postoperatively as evidence, and record the additional management measures.
- Determine positional relevance according to three criteria: explicit mention of positional relevance in the records, anatomic site consistent with positional exposure points, and lack of a more compelling alternative cause. If there is an attribution conflict between nursing and physician records, prioritize the original record closer to the time of the event, and have two adjudicators review and reach consensus.
- Definitions of predictor variables
- Define patient-level variables as age, sex, body mass index, diabetes mellitus, peripheral neuropathy, peripheral arterial disease, chronic kidney disease stage ≥ 3, congestive heart failure, smoking status, preoperative albumin, preoperative hemoglobin, Charlson comorbidity index, and preoperative Braden score. Define “preoperative” as the most recent valid record before entry into the operating room, within the hospital’s routine perioperative assessment window.
- Define surgery- and anesthesia-level variables as procedure category, anesthesia type, position type, head–neck rotation angle categories, upper-limb abduction angle categories, lower-limb abduction or flexion > 45°, operative duration, fluoroscopy duration, intraoperative non-turnable status, estimated blood loss, lowest MAP, cumulative time with MAP< 65 mmHg, lowest core temperature, use of vasoactive agents, and maximum norepinephrine equivalent. Classify position as supine/prone/lateral; classify head–neck rotation as ≤30°, 31–60°, and >60°; classify upper-limb abduction as ≤90° and >90°.
- Export the MAP time series with timestamps from the anesthesia information management system. Use the time difference between adjacent records as the interval length, and sum the durations of all intervals with MAP < 65 mmHg to obtain “MAP < 65 cumulative time”; if a single interval is missing or the gap is abnormal (e.g., >5 min without reasonable explanation), mark that interval as missing and do not include it in the cumulative total.
- Define nursing- and device-level variables as type of table padding, whether key pressure-point protection was completed, whether the upper limbs were secured to padded arm boards, whether the head was supported in a neutral position, category of puncture site, sheath size, sheath dwell time, puncture-site securement/closure method, and completeness of intraoperative position check documentation. Define “key pressure-point protection completed” as completed when there are protection records at all four sites—occiput, scapulae, sacrococcygeal region, and heels; otherwise, it is considered not fully completed.
- Record whether any vasoactive agents were used, and code non-users as “not used”. For users, record the maximum norepinephrine equivalent (µg/kg/min); at each anesthesia-record time point, calculate NE_eq_t = norepinephrine_t + epinephrine_t + 0.01 * dopamine_t + 0.06 * phenylephrine_t + 2.5 * vasopressin_t, where norepinephrine, epinephrine, dopamine, and phenylephrine are expressed in µg/kg/min and vasopressin in U/min; unused agents at a given time point were coded as 0, and maximum_norepinephrine_equivalent = max(NE_eq_t, na.rm = TRUE) over the intraoperative period.
NOTE: The conversion and aggregation rules were fixed in advance and implemented in the analysis script.
4. Data collection and quality control
- Provide uniform training to two researchers responsible for data extraction and distribute the standard operating procedures (SOP) and the variable dictionary. After training, complete a small-sample pilot extraction and revise the definitions and extraction pathways of ambiguous fields.
- Extract demographics and comorbidities from the electronic medical record, preoperative laboratory indicators from the laboratory system, vital signs and medications from the anesthesia system, positioning and nursing measures from the nursing system, and fluoroscopy duration and imaging-related information from PACS. Perform cross-system matching using the inpatient number and surgery date, and retain the matching keys and a matching log.
- When field conflicts occur, trace back to the original paper records and take the paper records as the standard. Record the conflict type, original value, corrected value, and source of evidence in a conflict handling log.
- Perform double data entry by two persons for all fields and generate a discrepancy list. Have a third researcher check each item against the original records for adjudication and lock the final database version for analysis.
- Establish a table of clinically reasonable ranges for continuous variables and perform automatic range checks after import. Trace back out-of-range values for verification; if unverifiable, set them to missing and retain the original value for reference.
- Perform duplicate extraction for the first 50 cases and calculate consistency, using Cohen κ for categorical variables and ICC (two-way random effects, absolute agreement) for continuous variables. If κ < 0.80 or ICC < 0.85, conduct retraining for the related variables and re-audit until the standard is met11.
- Calculate the number and proportion of missing cases for each candidate predictor variable and generate a missingness report. For key predictor variables with a missingness proportion not exceeding 30%, initiate multiple imputation; the primary outcome variable will not be imputed.
- Multiple imputation by chained equations (MICE) implementation details
- Fix the number of imputed datasets at m = 10 and set the number of iterations to at least 20 to promote convergence. Set a random seed to ensure reproducibility of imputation and save the mice object for auditability.
- Use predictive mean matching (PMM) for continuous variables to preserve distributional form. Use logistic regression imputation for binary variables, multinomial logistic imputation for unordered multicategory variables, and ordinal logistic imputation for ordered categorical variables. In R, unordered multicategory variables were defined as nom_vars <- c("smoking_status","procedure_category","anesthesia_type",
"position_type","table_padding_type","puncture_site_
category","puncture_site_closure_method"), and ordered categorical variables were defined as ord_vars <- c("head_neck_rotation_cat","upper_limb_abduction_cat"); dat[nom_vars] <- lapply(dat[nom_vars], factor); dat[ord_vars] <- lapply(dat[ord_vars], ordered); meth <- mice::make.method(dat); meth[sapply(dat, is.numeric)] <- "pmm"; meth[names(dat)[sapply(dat, function(x) is.factor(x) && nlevels(x) == 2)]] <- "logreg"; meth[nom_vars] <- "polyreg"; meth[ord_vars] <- "polr"; and meth[c("inpatient_number","surgery_id","outcome")] <- "". - Include all candidate predictor variables and the outcome variable in the imputation prediction matrix to improve imputation quality, but perform imputation only for predictor variables with missingness. Set identifier fields that should not act as predictors (e.g., inpatient number, unique surgery ID) to not participate in the imputation model to avoid introducing nonclinical information. To follow this protocol, implement the predictor matrix as pred <- mice::make.predictorMatrix(dat); pred[,] <- 1; diag(pred) <- 0; pred[, c("inpatient_number","surgery_id")] <- 0; pred[c("inpatient_number","surgery_id","outcome"), ] <- 0; and pred[setdiff(colnames(pred), c("inpatient_number","surgery_id","outcome")), "outcome"] <- 1, so that the outcome is used only as an auxiliary predictor and not imputed.
- Plot iteration trace plots and check whether the means and variances of key continuous variables are stable to assess imputation convergence. Imputation was run as imp <- mice::mice(dat, m = 10, maxit = 20, method = meth, predictorMatrix = pred, seed = 20250101, printFlag = FALSE); convergence was assessed with plot(imp) and by checking stability of the means and variances of key continuous variables across iterations.
5. Development of the nursing predictive assessment tool
- Preprocessing and coding of candidate variables
- Set the reference level for procedure category to "neurovascular", and the reference level for position to "supine". Set the reference level for head–neck rotation to "≤30°", and the reference level for upper-limb abduction to "≤90°". Set the reference level for puncture site category to "radial artery", and the reference level for puncture-site closure method to "vascular closure device".
- Scale age per 10 years, operative duration per 60 min, fluoroscopy duration per 10 min, estimated blood loss per 100 mL, sheath dwell time per 60 min, and sheath size per 1 Fr. For variables hypothesized as "the lower the value, the higher the risk" (e.g., lowest core temperature, albumin, hemoglobin, Braden score, lowest MAP), apply reverse coding so that the regression OR represents "risk increase per unit decrease".
NOTE: Reverse coding can be implemented by taking the negative of the original variable and scaling by the unit, for example, Temp_dec = -(Temp/0.5) or Braden_dec = -(Braden/1), to keep the OR interpretation direction consistent.
- Univariable analysis and candidate variable screening
- Fit a univariable logistic regression model for each candidate predictor and record the OR, 95% CI, and P value. For categorical variables, use dummy coding with the reference level and output effect estimates of each level relative to the reference.
- Use restricted cubic splines to test linearity for continuous variables, using four knots placed at the 5%, 35%, 65%, and 95% quantiles. If the test indicates significant nonlinearity, retain the same spline form in the subsequent multivariable model.
- Take the union of "clinically prespecified variables" and "variables with univariable P<0.20" as the multivariable candidate set12. Compare the candidate set against the constraint of the number of events, and, when necessary, preferentially retain clinically highly relevant variables to control overfitting.
- LASSO selection and construction of the main model
- Fit a penalized Logistic regression (LASSO, alpha=1) on the candidate set, with family="binomial". Standardize continuous variables (standardize=TRUE) to ensure fair penalization across variables with different scales.
- Perform ten-fold cross-validation repeated 1,000x, randomly generating fold partitions each time and recording the cross-validation deviance corresponding to lambda.min. Define the penalty strength as the median of lambda.min across the 1,000 repetitions (or, equivalently, the λ corresponding to the minimum mean deviance), and use this λ for the final LASSO fit to obtain a stable set of variables with nonzero coefficients.
- Using the variables with nonzero coefficients selected by LASSO, fit the non-penalized multivariable Logistic regression main model in the completed dataset. If spline terms are retained, fit them in the main model with the same spline form and record the corresponding coefficients or function terms.
- Fit the main model separately in the 10 imputed datasets and extract regression coefficients and standard errors. Combine the coefficients, standard errors, and confidence intervals using Rubin’s rules, and report the pooled OR and P value.
- Risk scoring, nomogram, and risk stratification
- Linearly scale the main model regression coefficients to integer points according to the Sullivan method, fixing the base scale and rounding rules. Calculate the total score and map the total score to the predicted probability via the logit function; the mapping formula must be consistent with the intercept of the main model.
- Use the rms package to generate a nomogram based on the main model, and export it as a high-resolution image or PDF for publication. Apply versioned file naming to the nomogram outputs to avoid confusion caused by subsequent modifications.
- Define predicted probability <5% as low risk, 5% to 14.9% as intermediate risk, and ≥15% as high risk13. Fix the tool outputs to two formats—a one-page paper form and an electronic calculator—and limit the scoring process to no more than three steps to facilitate clinical use.
6. Model validation and performance evaluation
- Internal validation and optimism correction
- Use the bootstrap for internal validation, and set the number of resamples to 1,000 to obtain stable estimates. For each resample, refit the model in the bootstrap sample, and compute performance metrics in both the bootstrap sample and the original sample to estimate optimism.
- Define optimism as the average difference between performance in the bootstrap sample and in the original sample. Subtract optimism from the apparent performance to obtain the corrected performance, and report the optimism-corrected AUC, calibration intercept, calibration slope, and Brier score.
- Discrimination
- Plot ROC curves and calculate the AUC as the measure of discrimination. Estimate the AUC and its 95% CI using the DeLong method, and perform the calculations on the same prediction outputs (probabilities) to ensure comparability.
- At the predefined thresholds (5% and 15%), calculate sensitivity, specificity, PPV, and NPV. For each threshold, also output the confusion matrix counts to allow verification of the calculation.
- Calibration and overall error
- Fit a calibration model with the model linear predictor (logit) as the independent variable; the intercept indicates systematic bias, and the slope indicates the degree of overfitting. Define ideal calibration as intercept = 0 and slope = 1, and report the metrics before and after correction.
- Calculate the Brier score as the measure of overall error, and plot calibration curves using loess smoothing alongside the 45° ideal line. The Brier score was calculated as mean((outcome - predicted_probability)2), and loess smoothing was implemented as stats::loess(outcome ~ predicted_probability, span = 0.75, degree = 2, family = "gaussian", surface = "direct").
- Clinical net benefit and decision curves
- Use decision curve analysis to evaluate net benefit across threshold probabilities of 2% to 25%14, and plot Treat-All and Treat-None strategies as references. Fix the threshold step size at 0.01 and explicitly specify it in the script to ensure reproducibility.
- Perform sensitivity analysis of net benefit around the low-risk and high-risk thresholds, and record the direction of the effect of threshold changes on net benefit. Present the sensitivity analysis results alongside the predefined thresholds to verify their rationality.
7. Statistical implementation and reproducible script workflow
- Software environment and project initialization
- Perform analyses in R 4.3.2 using the pROC, rms, glmnet, mice, and rmda packages.
- Set a fixed random seed (20250101) at the beginning of the script, and record session information to document the software environment.
- Data import, type settings, and quality checks
- Import the data using read.csv("data/analysis.csv") or readr::read_csv(). Verify whether the row count corresponds one-to-one with the unique surgery identifier, and check for duplicate IDs.
- Convert categorical variables to factors and use relevel() to set reference levels to match the preset scheme. Keep continuous variables numeric, and apply unit scaling and reverse coding per the preset before modeling.
- For categorical variables, calculate frequencies and percentages; for continuous variables, calculate mean ± standard deviation or median [IQR]. Use graphical methods and shapiro.test() to assess distributional form, and determine the descriptive approach accordingly.
- Missing data handling and multiple imputation (m = 10)
- Calculate the missingness proportion for each variable and export it as output/missing_report.csv. Confirm that the outcome variable has no missingness, and lock the strategy of “impute predictor variables only, do not impute the outcome.”
- Use mice() with m = 10 and maxit ≥ 20 to run chained equations imputation, and specify imputation methods according to variable types. Use complete(mids, action=k) to export the kth completed dataset and save it as data/imp_k.csv.
- Plot plot(mids) to check the stability of the traces, and compare the pre- and post-imputation distributions for key continuous variables. Save the diagnostic plots to output/imputation_diagnostics.pdf for verification.
- Univariable regression, spline testing, and generation of the candidate set
- Fit univariable Logistic regression in each imputed dataset and use pool() to combine coefficients and standard errors. Export the OR, 95% CI, and P values as output/univariate_pool.csv for candidate screening records.
- Use the rms package rcs() to fit spline terms for continuous variables and test the nonlinear terms. Fix the number and locations of knots and record them in script comments to avoid differences across runs.
- Take the union of clinically prespecified variables and variables with univariable P<0.20 to generate the candidate list, and save it as output/candidate_list.txt. Check whether the number of candidates and the number of events satisfy the complexity constraint, and record the final variable set used for LASSO.
- LASSO selection and main model fitting
- Use model.matrix() to generate the matrix of independent variables and ensure the reference levels are correct. Use cv.glmnet(x, y, family="binomial", alpha=1, standardize=TRUE) to perform ten-fold cross-validation.
- Use a loop to repeat random fold partitions 1000x, record lambda.min and the cross-validation error for each run, and write them to output/lasso_lambda_trace.csv. Take the median of the 1000 lambda.min values as the stable λ, and fit glmnet on the full dataset using this λ to obtain the variables with nonzero coefficients.
- In the 10 imputed datasets, fit the main model glm(family=binomial) using the selected variables. Combine β, SE, OR, and 95% CI using Rubin’s rules, and save the results as output/multivariable_pool.csv.
- Score transformation, nomogram, and risk stratification outputs
- Convert β to integer points according to a fixed scale, and map the total score back to the logit and probability using the same scale. Randomly sample several cases to compare the “original model probability” with the “score-converted probability” to ensure the error is within the preset acceptable range.
- Use the rms package to construct the nomogram and export it as output/nomogram.pdf. Export the score sheet as output/score_sheet.xlsx or equivalent formats to facilitate production of a one-page paper form.
- Perform stratification using the 5% and 15% thresholds and output the number of cases and observed incidence in each stratum. Export Se, Sp, PPV, and NPV at the thresholds as output/threshold_metrics.csv for subsequent presentation.
- Internal validation, calibration, and decision curves
- Set the number of bootstrap resamples to 1,000, and in each resample perform refitting and prediction, calculating AUC, Brier score, calibration intercept, and calibration slope. Write the optimism-corrected results to output/bootstrap_corrected_metrics.csv and retain a summary of intermediate results for each resample for audit.
- Use the pROC package roc() and auc() to calculate the AUC, and use ci.auc(method="delong") to output the 95% CI. Save the ROC curve as output/roc_curve.png and fix the resolution and size in the script.
- Use the rmda package to compute net benefit and plot DCA curves over the threshold range of 2% to 25%. Export the figure as output/dca_curve.png and fix the threshold step size and curve labels to ensure reproducibility.
- Sensitivity analyses
- Replace the outcome with “pressure injury stage ≥3” and repeat the imputation, LASSO selection, main model fitting, and performance evaluation workflow. Output the performance metrics alongside the main analysis to assess robustness.
- Replace the hypotension exposure variable with “cumulative time with MAP<60 mmHg” and repeat the full modeling and validation workflow. Compare coefficient directions and changes in AUC, Brier score, and calibration metrics to test the sensitivity to the threshold setting.
Results
Study population and baseline characteristics
According to the prespecified criteria, 3,274 patient records from the hybrid DSA operating room were identified, and 1,936 (59.1%) met the inclusion criteria and entered model development and validation (Figure 1). The enrolled patients had an age of (66.82 ± 11.94) years; males accounted for 61.16%; BMI was (24.73 ± 3.89) kg/m2; diabetes mellitus accounted for 23.45%. The Charlson comorbidity index was 3 [2,5], the Braden score was 17 [16,19], and preoperative albumin was (39.18 ± 4.41) g/L, indicating a relatively high comorbidity burden and a certain risk of pressure injury (Table 1). Procedures upon entry were mainly neurovascular and cardiovascular; the supine position accounted for 69.78%; general anesthesia accounted for 77.89%. The median operative duration was 174 min, the median fluoroscopy duration was 37 min, 76.81% of cases had an intraoperative non-turnable status, the lowest MAP was (63.72 ± 8.96) mmHg, and 45.99% used vasoactive agents, suggesting that patients generally had prolonged positional exposure with a certain risk of circulatory instability (Table 2). Regarding nursing and devices, the usage rate of gel pressure-relief padding was 40.24%; the completion rate of protection at four key pressure points was 72.77%; head supported in a neutral position was 78.68%; and the completeness of intraoperative position check documentation was 86.39%. Arterial access was predominantly femoral (62.32%); the median sheath size was 6 Fr, and the median dwell time was 142 min; puncture sites were mostly secured with compression bandage or vascular closure device (Table 3).
Outcome incidence and data quality
From intraoperative through 72 h postoperatively, the incidence of the composite outcome of position-related complications was 10.23%. Among the components, pressure injury (4.08%) and position-related respiratory/hemodynamic instability events (5.01%) were most common; peripheral nerve injury was 1.60%, puncture-site complications were 2.74%, and joint or musculoskeletal injury was 0.88% (Table 4). Among the 1,936 included cases, the overall missingness for key predictors was low (maximum 3.25%), and there was no missingness for the outcome variables. Cases with >30% missingness across prespecified key predictor variables had been excluded during screening. After handling the remaining predictor missingness using multiple imputation by chained equations (m = 10), the number of observations available for modeling remained 1,936 in the imputed datasets (Table 5). Consistency re-extraction for key variables showed good consistency for categorical variables (Cohen κ ≥ 0.86 for all) and for continuous variables (ICC ≥ 0.89 for all), satisfying the consistency thresholds (Table 6).
Development of the predictive model
Univariable Logistic regression showed that increased age, higher Charlson comorbidity index, lower Braden score, longer operative duration, lower lowest MAP, and lower core temperature were all associated with an increased risk of position-related complications; the prone position, longer cumulative time with MAP < 65 mmHg, and larger sheath size further indicated elevated risk. Among nursing process factors, completing key pressure-point protection and intraoperative position check documentation was associated with protective effects, whereas femoral-artery access was associated with a higher risk. Candidate variables were screened per the prespecified rule (P < 0.20) to enter LASSO modeling (Figure 2A). At λ_min, a total of 12 variables with nonzero coefficients were selected, including seven baseline risk factors (age, higher Charlson index, lower Braden score, longer operative duration, prone position, longer cumulative time with MAP < 65 mmHg, and lower lowest core temperature) and 5 nursing process factors (femoral-artery access, larger sheath size, longer sheath dwell time, completion of key pressure-point protection, and completeness of intraoperative position check documentation) to construct the subsequent multivariable model (Figure 2B). The final multivariable Logistic regression model included 12 variables (all P < 0.05). The seven baseline risk factors included increased age, higher Charlson comorbidity index, lower Braden score, longer operative duration, prone position, hypotension exposure (longer cumulative time with MAP<65 mmHg), and lower core temperature (OR = 1.06–1.64); the 5 nursing process factors included femoral-artery access, larger sheath size, and longer sheath dwell time (OR = 1.08–1.34, increased risk), and completion of key pressure-point protection and intraoperative position check documentation being complete (OR = 0.68–0.71, protective factors) (Table 7).
Presentation of the predictive tool and internal validation
Based on the final multivariable model, a nomogram was constructed using Sullivan linear scaling, converting seven baseline risk factors and five nursing process factors into a total point score and mapping it to the predicted probability of position-related complications; stratification by <5%, 5–14.9%, and ≥15% was used for risk assessment and nursing decision support preoperatively and after positioning, with protective items among the nursing process factors reflecting their modifiable nature (Figure 3A). The AUC was estimated using the DeLong method; the apparent AUC of the baseline risk model was 0.74 and was 0.72 after bootstrap correction; the apparent AUC of the updated full model was 0.79 and was 0.77 after correction, indicating better discrimination than the model containing only baseline risk (Figure 3B). The calibration curves overall approximated the 45° ideal line (Figure 3C). After bootstrap optimism correction, the updated full model had a calibration slope of 0.947 and an intercept of +0.004, closer to the ideal values (slope 1, intercept 0) than the baseline risk model's values of 0.903 and +0.006, indicating better calibration. The overall error of both models was low, with a corrected Brier score of 0.085 for the full model, lower than 0.089 for the baseline risk model; for reference, the Brier score of the null model based on the observed event incidence of 10.23% was 0.092 (Table 8).
Clinical applicability and risk stratification performance
Decision curve analysis showed that within a threshold probability range of 5%–20%, both models had higher net benefit than the Treat-All and Treat-None strategies, and the updated full model consistently exceeded the baseline risk model, suggesting that incorporating nursing process variables provides additional clinical net benefit (Figure 4). Under the predefined thresholds, the updated full model stratified patients into low-, intermediate-, and high-risk groups, with observed incidences of 1.29%, 9.28%, and 35.07%, respectively. At the 5% threshold, sensitivity, specificity, positive predictive value, and negative predictive value of the updated full model were 95.45%, 39.76%, 15.30%, and 98.71%, respectively; at the 15% threshold, the corresponding values were 51.01%, 89.24%, 35.07%, and 94.11%, respectively (Table 9). Under the strict outcome and alternative hypotension threshold scenarios, the AUCs of both models remained overall at 0.71–0.81, with small changes in the Brier score and calibration intercept, and the calibration slope remaining close to 1. The updated full model maintained slightly better discrimination and calibration than the baseline risk model in both sensitivity analyses, suggesting some robustness in the model’s performance (Table 10).
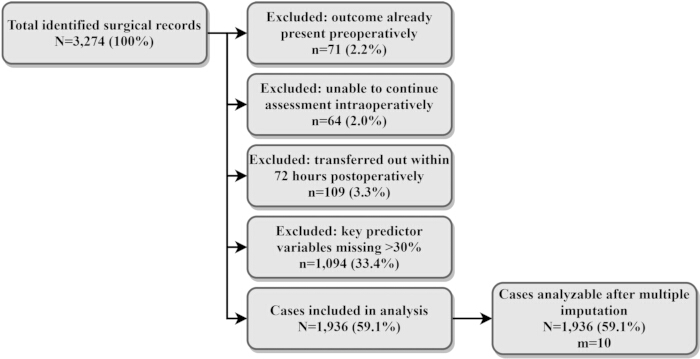
Figure 1: Case screening flowchart. The study period was January 1, 2021, to December 31, 2024, with follow‑up through 72 h postoperatively. Percentages were calculated using the number of identified surgical records as the denominator. The analysis cohort included one eligible index procedure per patient; m = 10 indicates the number of imputed datasets. Please click here to view a larger version of this figure.
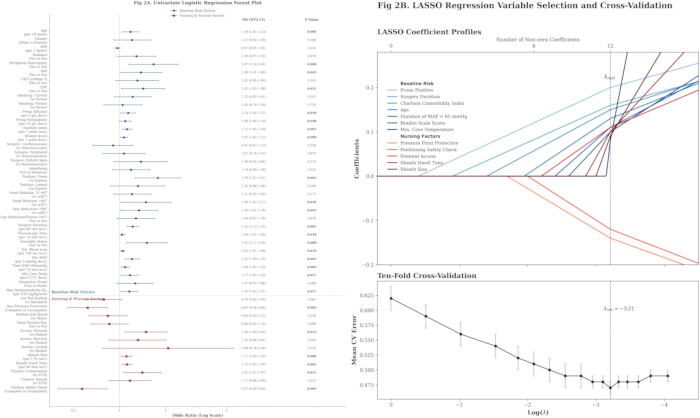
Figure 2: Predictor screening and selection process. (A) Univariate logistic regression results are shown as odds ratios with 95% confidence intervals and two‑sided P values; continuous predictors were modeled using prespecified clinically meaningful increments, and categorical predictors were used with predefined reference categories. Analyses were fitted across m = 10 imputed datasets and pooled using Rubin’s rules. (B) LASSO logistic regression used standardized predictors; λ_min was selected by 10‑fold cross‑validation repeated 1,000x. Abbreviations: ORs = odds ratios; CIs = confidence intervals. Please click here to view a larger version of this figure.
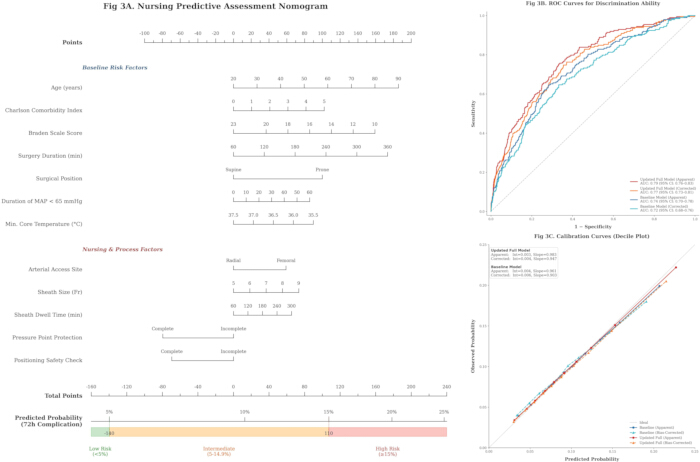
Figure 3: Development and validation of a nursing Predictive assessment tool. (A) The nomogram was derived from the final multivariable model using Sullivan’s point‑based scaling; total points were mapped to predicted probability and prespecified risk strata (low <5%, intermediate 5–14.9%, high ≥15%). (B) ROC curves are shown for baseline‑risk and updated models, with apparent and bootstrap-corrected AUCs; AUC 95% CIs were estimated using the DeLong method. (C) Calibration curves display observed versus predicted risks by deciles, with both apparent and bootstrap‑corrected curves and the 45° ideal line; calibration intercept and slope are annotated. Please click here to view a larger version of this figure.
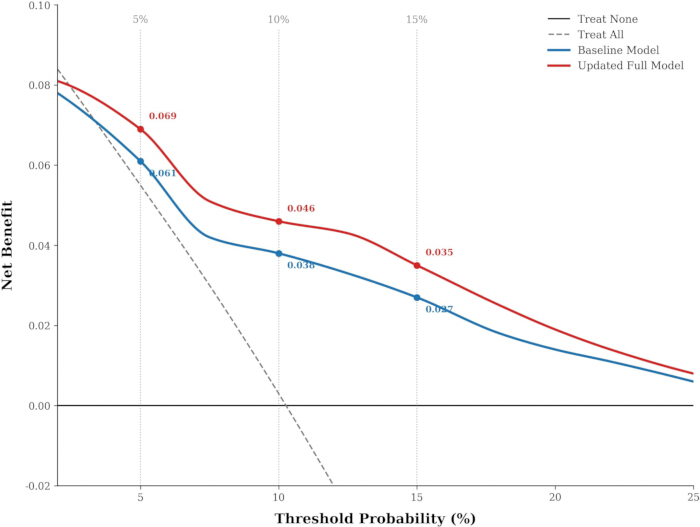
Figure 4: Decision curve analysis (apparent). Net benefit was calculated across threshold probabilities of 2%–25% and compared between the baseline‑risk model, updated model, Treat‑All, and Treat‑None strategies. “Apparent” indicates estimates from the development cohort without optimism correction. Higher net benefit indicates greater clinical utility at a given threshold. Please click here to view a larger version of this figure.
| Variable name | Summary statistics | Valid observations n |
| Age | 66.82 ± 11.94 | 1936 |
| Sex | Male 1184 (61.16%); Female 752 (38.84%) | 1936 |
| BMI (kg/m²) | 24.73 ± 3.89 | 1912 |
| Diabetes mellitus | 454 (23.45%) | 1936 |
| Peripheral neuropathy | 207 (10.69%) | 1936 |
| Peripheral arterial disease | 251 (12.96%) | 1936 |
| Chronic kidney disease ≥stage 3 | 238 (12.29%) | 1936 |
| Congestive heart failure | 211 (10.90%) | 1936 |
| Smoking status | Never 926 (49.02%); Former 503 (26.63%); Current 460 (24.35%) | 1889 |
| Preoperative albumin (g/L) | 39.18 ± 4.41 | 1873 |
| Preoperative hemoglobin (g/L) | 128.61 ± 16.97 | 1897 |
| Charlson comorbidity index | 3 [2,5] | 1936 |
| Preoperative Braden score | 17 [16,19] | 1936 |
Table 1: Patient baseline characteristics (patient-related factors). Continuous variables are presented as mean ± SD or median [IQR], depending on distribution; categorical variables are presented as n (%). Percentages were calculated using the number of available observations for each variable as the denominator. BMI, body mass index. Please click here to download this Table.
| Variable name | Summary statistics | Valid observations n |
| Procedure category | Neurovascular 789 (40.75%); Cardiovascular 512 (26.45%); Peripheral vascular 473 (24.43%); Hybrid open abdominal or thoracic plus interventional 162 (8.37%) | 1936 |
| Anesthesia type | General anesthesia 1508 (77.89%); Sedation 428 (22.11%) | 1936 |
| Position type | Supine 1351 (69.78%); Prone 341 (17.61%); Lateral 244 (12.60%) | 1936 |
| Head–neck rotation angle categories | ≤30° 1182 (61.85%); 31–60° 546 (28.57%); >60° 183 (9.58%) | 1911 |
| Upper-limb abduction angle categories | ≤90° 1469 (76.75%); >90° 445 (23.25%) | 1914 |
| Lower-limb abduction or flexion >45° | Yes 611 (31.63%); No 1321 (68.37%) | 1932 |
| Operative duration (min) | 174 [113, 243] | 1936 |
| Fluoroscopy duration (min) | 37 [21, 69] | 1927 |
| Intraoperative non-turnable status | Yes 1487 (76.81%); No 449 (23.19%) | 1936 |
| Estimated blood loss (mL) | 130 [70, 310] | 1908 |
| Lowest mean arterial pressure (mmHg) | 63.72 ± 8.96 | 1930 |
| Cumulative time with mean arterial pressure <65 mmHg (min) | 21 [9, 44] | 1930 |
| Lowest core temperature (°C) | 35.78 ± 0.62 | 1899 |
| Use of vasoactive agents | Used 889 (45.99%); Not used 1044 (54.01%) | 1933 |
| Maximum norepinephrine equivalent (µg/kg/min) | 0.06 [0.03, 0.11] | 889 |
Table 2: Surgical and anesthesia characteristics. Continuous variables are presented as mean ± SD or median [IQR]; categorical variables as n (%), with percentages based on available observations. MAP, mean arterial pressure. The maximum norepinephrine equivalent was summarized only among cases receiving vasoactive agents. Please click here to download this Table.
| Variable name | Summary statistics | Valid observations n |
| Operating-table padding type | Standard padding 1157 (59.76%); Gel pressure-relief padding 779 (40.24%) | 1936 |
| Completion of key pressure-point protection | All four sites completed 1398 (72.77%); Not all completed 523 (27.23%) | 1921 |
| Upper-limb securement method | Padded arm boards 1544 (80.80%); Other 367 (19.20%) | 1911 |
| Head supported in neutral position | Yes 1517 (78.68%); No 411 (21.32%) | 1928 |
| Puncture-site category | Radial artery 556 (29.46%); Brachial artery 131 (6.94%); Femoral artery 1176 (62.32%); Carotid artery 24 (1.27%) | 1887 |
| Sheath size (Fr) | 6 [5, 7] | 1882 |
| Sheath dwell time (min) | 142 [87, 229] | 1884 |
| Puncture-site securement or closure method | Compression bandage 1022 (54.54%); Suture closure device 286 (15.26%); Vascular closure device 566 (30.20%) | 1874 |
| Completeness of intraoperative position check documentation | Complete 1657 (86.39%); Incomplete 261 (13.61%) | 1918 |
Table 3: Nursing and device characteristics. Categorical variables are presented as n (%) and continuous variables as mean ± SD or median [IQR], with percentages based on available observations. “Key pressure‑point protection completed” indicates protection at occiput, scapula, sacrum/coccyx, and heels. Sheath‑related variables and access‑site fixation/closure method were summarized only among cases with documented arterial access. Please click here to download this Table.
| Outcome category | Number of events n | Incidence % | Brief basis for determination |
| Composite outcome (≥1 position-related complication) | 198 | 10.23 | Any component event present counted toward the composite outcome |
| Pressure injury (stage 2 or higher or deep tissue injury) | 79 | 4.08 | New within 72 h; staging confirmed by nursing records and skin assessment forms |
| Peripheral nerve injury | 31 | 1.6 | Symptoms persisted ≥24 h; anatomic distribution consistent with contact/traction at the position; documented specialist assessment |
| Joint or musculoskeletal injury | 17 | 0.88 | Positive physical examination findings and position-related; or imaging evidence supporting traction/compression injury |
| Position-related respiratory or hemodynamic instability events | 97 | 5.01 | Position-induced need for repositioning, vasopressor escalation, compression, or brief pause of the procedure |
| Puncture-site complications with aggravation related to positional constraints | 53 | 2.74 | Hematoma diameter ≥5 cm on the puncture side or oozing requiring additional compression fixation; documented as related to positional constraints |
Table 4: Incidence and composition of position-related complications (intraoperative to 72 h postoperatively). The composite outcome was counted once per procedure; component events were not mutually exclusive. Rates were calculated as n/N using the total included cohort as the denominator. “Access‑site complication aggravated by positioning restriction” was defined as hematoma ≥5 cm or bleeding requiring additional compression fixation. Please click here to download this Table.
| Variable name | Number missing n | Missingness % |
| Body mass index | 24 | 1.24 |
| Smoking status | 47 | 2.43 |
| Preoperative albumin | 63 | 3.25 |
| Preoperative hemoglobin | 39 | 2.01 |
| Head–neck rotation angle categories | 25 | 1.29 |
| Upper-limb abduction angle categories | 22 | 1.14 |
| Lower-limb abduction or flexion >45° | 4 | 0.21 |
| Fluoroscopy duration | 9 | 0.47 |
| Estimated blood loss | 28 | 1.45 |
| Lowest mean arterial pressure | 6 | 0.31 |
| Cumulative time with mean arterial pressure <65 mmHg | 6 | 0.31 |
| Lowest core temperature | 37 | 1.91 |
| Use of vasoactive agents | 3 | 0.16 |
| Completion of key pressure-point protection | 15 | 0.77 |
| Upper-limb securement method | 25 | 1.29 |
| Head supported in a neutral position | 8 | 0.41 |
| Puncture-site category | 49 | 2.53 |
| Sheath size | 54 | 2.79 |
| Sheath dwell time | 52 | 2.69 |
| Puncture-site securement or closure method | 62 | 3.2 |
| Completeness of intraoperative position check documentation | 18 | 0.93 |
Table 5: Missingness of key variables and sample size after imputation. Missingness is reported as n (%) using N = 1,936 as the denominator for each variable. Multiple imputation by chained equations was performed with m=10 datasets; the outcome was not imputed, and inferential analyses were pooled using Rubin’s rules. Maximum norepinephrine equivalent was coded as 0 µg/kg/min for patients not receiving vasoactive agents. Please click here to download this Table.
| Variable name | Repeated extraction sample size n | Cohen κ | ICC |
| Position type (supine/prone/lateral) | 50 | 0.93 | — |
| Head–neck rotation angle categories (≤30°/31–60°/>60°) | 49 | 0.88 | — |
| Upper-limb abduction angle categories (≤90°/>90°) | 48 | 0.91 | — |
| Lower-limb abduction or flexion >45° | 50 | 0.9 | — |
| Intraoperative non-turnable status | 50 | 0.95 | — |
| Anesthesia type (general anesthesia/sedation) | 50 | 0.96 | — |
| Operating-table padding type (standard/gel) | 50 | 0.89 | — |
| Completion of key pressure-point protection (all four completed/not all completed) | 47 | 0.87 | — |
| Upper-limb securement method (padded arm boards/other) | 48 | 0.92 | — |
| Head supported in a neutral position (yes/no) | 49 | 0.94 | — |
| Puncture-site category (radial/brachial/femoral/carotid) | 46 | 0.9 | — |
| Puncture-site securement or closure method (compression bandage/suture closure/vascular closure device) | 46 | 0.86 | — |
| Completeness of intraoperative position check documentation (complete/incomplete) | 50 | 0.91 | — |
| Determination of composite outcome (≥1 position-related complication) | 50 | 0.93 | — |
| Occurrence of pressure injury (stage ≥2) | 50 | 0.9 | — |
| Determination of position-related respiratory/hemodynamic instability events | 50 | 0.92 | — |
| Occurrence of peripheral nerve injury | 50 | 0.89 | — |
| Occurrence of joint or musculoskeletal injury | 50 | 0.88 | — |
| Puncture-site complications with aggravation related to positional constraints | 50 | 0.9 | — |
| Operative duration (min) | 50 | — | 0.97 |
| Fluoroscopy duration (min) | 49 | — | 0.94 |
| Estimated blood loss (mL) | 49 | — | 0.91 |
| Cumulative time with mean arterial pressure <65 mmHg (min) | 50 | — | 0.92 |
| Lowest mean arterial pressure (mmHg) | 50 | — | 0.96 |
| Lowest core temperature (°C) | 50 | — | 0.93 |
| Sheath size (Fr) | 46 | — | 0.98 |
| Sheath dwell time (min) | 46 | — | 0.95 |
| Preoperative Braden score (points) | 50 | — | 0.9 |
| Charlson comorbidity index (points) | 50 | — | 0.91 |
| Maximum norepinephrine equivalent (µg/kg/min) | 23 | — | 0.89 |
Table 6: Consistency of data extraction. Duplicate abstraction was performed in an initial sample (up to 50 procedures). Cohen’s κ was used for categorical variables and ICC for continuous variables (two‑way random effects, absolute agreement); κ≥0.80 or ICC≥0.85 indicated acceptable reliability. “—” denotes not applicable. Please click here to download this Table.
| Variable name | β | SE | OR (95% CI) | P value |
| Age (per 10-year increase) | 0.13 | 0.06 | 1.14 (1.02, 1.29) | 0.029 |
| Charlson index (per 1-point increase) | 0.1 | 0.03 | 1.10 (1.04, 1.18) | 0.003 |
| Braden score (per 1-point decrease) | 0.06 | 0.03 | 1.06 (1.01, 1.12) | 0.027 |
| Operative duration (per 60 min increase) | 0.17 | 0.05 | 1.18 (1.08, 1.30) | <0.001 |
| Position: prone vs supine | 0.49 | 0.17 | 1.64 (1.18, 2.26) | 0.003 |
| Cumulative time with MAP<65 mmHg (per 10 min increase) | 0.07 | 0.03 | 1.07 (1.02, 1.13) | 0.01 |
| Lowest core temperature (per 0.5 °C decrease) | 0.11 | 0.05 | 1.12 (1.01, 1.25) | 0.037 |
| Puncture site: femoral artery vs radial artery | 0.29 | 0.14 | 1.34 (1.01, 1.78) | 0.043 |
| Sheath size (per 1 Fr increase) | 0.09 | 0.04 | 1.09 (1.02, 1.17) | 0.014 |
| Sheath dwell time (per 60 min increase) | 0.08 | 0.03 | 1.08 (1.02, 1.15) | 0.012 |
| Pressure-point protection: completed vs not all completed | -0.39 | 0.15 | 0.68 (0.50, 0.91) | 0.012 |
| Intraoperative position check documentation: complete vs incomplete | -0.34 | 0.17 | 0.71 (0.51, 0.98) | 0.04 |
| Intercept | -2.26 | 0.38 | 0.10 (0.05, 0.22) | — |
Table 7: Regression coefficients and odds ratios of the final multivariable logistic regression model. The final model was refit as an unpenalized multivariable logistic regression using the predictors selected at λ_min. Results are reported as β, SE, OR (95% CI), and two‑sided P values; the intercept is provided without a P value. Coefficients are apparent (development‑cohort) estimates. Please click here to download this Table.
| Model | Estimate type | AUC (95% CI) | Brier score | Calibration intercept | Calibration slope |
| Null model | Reference | 0.5 | 0.092 | — | — |
| Baseline risk model | Apparent | 0.74 (0.70–0.78) | 0.087 | 0.004 | 0.961 |
| Baseline risk model | Bootstrap-corrected | 0.72 (0.68–0.76) | 0.089 | 0.006 | 0.903 |
| Updated full model | Apparent | 0.79 (0.76–0.83) | 0.083 | 0.003 | 0.983 |
| Updated full model | Bootstrap-corrected | 0.77 (0.73–0.81) | 0.085 | 0.004 | 0.947 |
Table 8: Model calibration and overall error metrics. Brier score, calibration intercept, and calibration slope are reported for apparent and bootstrap optimism‑corrected estimates. Lower Brier scores indicate better overall accuracy; calibration intercept 0 and slope 1 indicate ideal calibration. Please click here to download this Table.
| Risk tier | Number of cases within tier n | Obser- ved incidence % | Se @5% (baseline) % | Se @5% (full) % | Sp @5% (baseline) % | Sp @5% (full) % | PPV @5% (baseline) % | PPV @5% (full) % | NPV @5% (baseline) % | NPV @5% (full) % | Se @15% (baseline) % | Se @15% (full) % | Sp @15% (baseline) % | Sp@ 15% (full) % | PPV @15% (baseline) % | PPV @15% (full) % | NPV @15% (baseline) % | NPV @15% (full) % |
| Low risk <5% | 700 | 1.29 | — | — | — | — | — | — | — | — | — | — | — | — | — | — | — | — |
| Intermediate risk 5–14.9% | 948 | 9.28 | — | — | — | — | — | — | — | — | — | — | — | — | — | — | — | — |
| High risk ≥15% | 288 | 35.07 | — | — | — | — | — | — | — | — | — | — | — | — | — | — | — | — |
| Overall (threshold=5%) | — | — | 87.9 | 95.45 | 41.1 | 39.76 | 14.54 | 15.3 | 96.75 | 98.71 | — | — | — | — | — | — | — | — |
| Overall (threshold=15%) | — | — | — | — | — | — | — | — | — | — | 41.92 | 51.01 | 89.96 | 89.24 | 32.24 | 35.07 | 93.15 | 94.11 |
Table 9: Observed incidence after predefined risk stratification and classification performance at thresholds. Risk groups were defined by the updated model's predicted probability: low (<5%), intermediate (5–14.9%), and high (≥15%); observed event rates were calculated as x/n within each group. Sensitivity (Se), specificity (Sp), positive predictive value (PPV), and negative predictive value (NPV) were computed at prespecified thresholds of 5% and 15% for both the baseline‑risk and updated models. No additional hypothesis testing was performed. Please click here to download this Table.
| Scenario setting | Model version | AUC | Brier | Calibration intercept | Calibration slope | Optimism-corrected or not |
| Strict outcome (pressure injury limited to stage 3 or higher) | Baseline risk model (apparent) | 0.76 | 0.079 | 0.004 | 0.958 | No |
| Baseline risk model (bootstrap corrected) | 0.74 | 0.081 | 0.006 | 0.904 | Yes | |
| Updated full model (apparent) | 0.81 | 0.074 | 0.003 | 0.981 | No | |
| Updated full model (bootstrap corrected) | 0.79 | 0.076 | 0.004 | 0.944 | Yes | |
| Alternative hypotension threshold (cumulative time with MAP<60 mmHg replacing <65 mmHg) | Baseline risk model (apparent) | 0.73 | 0.091 | 0.005 | 0.941 | No |
| Baseline risk model (bootstrap corrected) | 0.71 | 0.094 | 0.007 | 0.887 | Yes | |
| Updated full model (apparent) | 0.78 | 0.086 | 0.004 | 0.972 | No | |
| Updated full model (bootstrap corrected) | 0.76 | 0.088 | 0.006 | 0.935 | Yes |
Table 10: Sensitivity analyses. Model development and internal validation procedures were repeated under two prespecified scenarios: (1) strict outcome definition (pressure injury stage ≥ 3) and (2) alternative hypotension exposure (cumulative time MAP < 60 mmHg, replacing MAP < 65 mmHg). Within each scenario, the baseline risk model and the updated full model are presented separately. AUC values are point estimates; Brier score, calibration intercept, and calibration slope are reported as apparent and bootstrap optimism-corrected estimates. “Apparent” indicates estimates obtained in the development cohort, whereas “bootstrap optimism-corrected” indicates estimates after bootstrap correction for optimism. Please click here to download this Table.
Supplemental Table S1: TRIPOD checklist for reporting of multivariable prediction model development and internal validation. The table indicates the location of each TRIPOD item within the manuscript.Please click here to download this file.
Discussion
In the hybrid DSA operating room, position-related complications include coexisting skin and soft-tissue injury and positioning-induced respiratory and hemodynamic instability, indicating that positional safety is not only a matter of local pressure but also reflects whole-body physiologic tolerance. Risk determinants derive from patient vulnerability and surgical exposure. Advanced age and a higher comorbidity burden indicate reduced tissue reserve; a lower Braden score reflects reduced skin tolerance and limited mobility, diminishing tolerance to sustained pressure. Prolonged operative duration and a fixed position cause accumulation of interface pressure and shear, and sedation or general anesthesia weakens pain feedback and spontaneous adjustment15. Hypotension exposure reduces tissue perfusion, and hypothermia induces peripheral vasoconstriction and affects repair, making pressure injury and nerve compression more likely16. The prone position is often accompanied by pressure on the head/face and shoulder girdle, changes in chest and abdominal compliance, and restricted venous return, increasing the risk of local compression and circulatory fluctuations17. Prior perioperative studies and guidelines consistently list advanced age, comorbidities, a low Braden score, longer operative duration, and the prone position as important risk factors for pressure injury and peripheral nerve injury, and also suggest that low perfusion and hypothermia are associated with an increased risk of tissue injury18. The hybrid DSA equipment and the sterile field restrict position adjustment, securement of access routes and lines reduces opportunities to turn, and an intraoperative non-turnable status is more common, making local pressure relief more difficult and physiologic exposure more readily translated into clinical outcomes19. However, although intraoperative non-turnable status is a characteristic feature of this setting, it was not retained in the final model, suggesting that within this restricted cohort its risk information may have been partly captured by more specific exposure variables, such as operative duration, position type, hypotension burden, and sheath-related immobilization, rather than providing additional independent discrimination. It should therefore be interpreted as a contextual feature of the hybrid DSA environment rather than a final stratification variable in this cohort. This suggests that preoperative and early intraoperative baseline risk assessment should incorporate tissue tolerance, perfusion, and temperature management within the same framework, providing a starting point for subsequent phase-based nursing decision-making.
After controlling for baseline risk, completion of key pressure-point protection and completeness of intraoperative position-check documentation remained protective, whereas femoral-artery access, larger sheath size, and longer sheath dwell time were associated with increased risk, suggesting that nursing processes and access management make independent contributions to positional safety. After inclusion of nursing process items, model discrimination and calibration were consistently improved, indicating that, at similar patient and surgical exposure levels, process differences can further distinguish risk and align assessment results with nursing decision-making. Pressure-point protection disperses interface pressure, reduces shear and friction, and improves local perfusion, mitigating ischemia and inflammatory responses caused by sustained compression20. The completeness of position checks enables ongoing assessment and correction, allowing early identification of pressure points caused by support device displacement, line/catheter traction, and limb overextension, thereby reducing cumulative injury21. Although access and sheath characteristics are determined by procedural needs, they directly determine the method of securement, the range of immobilization, and the duration of compression, serving as key inputs for setting the intensity of nursing intervention and follow-up priorities22. Perioperative prevention guidelines and quality improvement studies have long emphasized the process value of pressure-relief pads and checklists23, and these results support their quantitative application in the hybrid DSA operating room context. This framework separates risk identification from the localization of modifiable points, facilitating embedding of the score into nursing pathways and use for process compliance auditing24. The methodology of prediction models emphasizes that preoperative estimation should avoid incorporating the execution of interventions into prior prediction to prevent purpose mismatch; the phase-based framework performs baseline risk assessment preoperatively and in the early intraoperative period using patient and surgical exposure, and then updates risk after positioning by incorporating modifiable process items, which is conducive to risk adjustment and nursing quality improvement.
After internal validation, the updated full model maintained stable discrimination and calibration close to ideal and showed further improvement over the baseline risk model in overall error metrics, indicating that, with patient vulnerability and surgical exposure already incorporated, nursing process information can provide quantifiable incremental predictive value25. The nomogram converts variables into points and probabilities, facilitating completion of baseline risk stratification preoperatively or in the early intraoperative period for risk adjustment and resource front-loading; after positioning, modifiable items such as pressure-point protection and position checks are then incorporated to update risk, making the outputs directly correspond to nursing actions and process quality control26. Under the prespecified thresholds, the stratification results showed a clear gradient, with a markedly higher observed incidence in the high-risk tier; lower thresholds are used to increase detection and reduce missed cases, and higher thresholds to focus on escalation of interventions and improve efficiency. In this cohort, the overall event incidence was 10.23%; therefore, the 5% threshold was used as a conservative trigger to minimize missed high-risk cases, whereas the 15% threshold was used to identify a subgroup with substantially enriched risk for intensified intervention and resource prioritization. This choice also reflects the asymmetry of clinical consequences in this setting, where the cost of additional positioning checks and protective measures is relatively low, but missed high-risk cases may lead to preventable complications. At the same time, the 5% threshold yielded high sensitivity and NPV but low specificity (39.76%) and PPV (15.30%), implying a substantial false-positive burden and increased nursing workload; accordingly, this lower threshold is more suitable as a screening-oriented trigger for enhanced surveillance than as the sole basis for high-intensity resource escalation. These thresholds should therefore be interpreted as pragmatic cut points for this study setting rather than universal standards and may require recalibration in other centers. The decision curves indicated that within clinically relevant threshold ranges, both models outperformed Treat-All or Treat-None strategies, with the full model showing a higher net benefit. Because these decision-curve results were apparent estimates from the development cohort, the observed net benefit may be optimistic and may overestimate performance in new populations; they should therefore be interpreted as preliminary and require confirmation in external validation and implementation evaluation. Sensitivity analyses under the strict outcome and the alternative definition of hypotension maintained similar performance, supporting the robustness of the model. After prospective external validation, independent recalibration, and implementation evaluation, embedding the score in the nursing information system may support automatic calculation and prompts, linking high-risk patients with key process items to facilitate closed-loop management of risk stratification, implementation of measures, and outcome tracking, and may provide a quantitative basis for process compliance auditing and quality improvement after risk adjustment27. Prior perioperative risk tools have mostly focused on preoperative prediction with limited reflection of modifiable processes28; this study adopted phase-based updating to avoid purpose mismatch, consistent with current model evaluation frameworks that emphasize calibration, net benefit, and implementability.
The practical value of this tool lies in returning risk assessment to the time points when nursing decisions actually occur. Determination of position-related complications did not rely on a single record, but on cross-judgment combining position-related descriptions, whether the affected site was consistent with the pressure or traction point, and whether there was a more compelling alternative cause; two researchers then independently extracted and cross-checked the data according to a unified variable dictionary to reduce attribution bias and drift in variable coding. Missing-data handling emphasized ensuring interpretability before improving sample utilization: cases with excessive missingness of key information, insufficient to support reliable assessment, were excluded first, and multiple imputation was then applied to the remaining missing values in the retained cohort, avoiding the use of imputation to replace core information that could not be traced back. Phase-based updating was not merely a statistical split but corresponded to the actual nursing rhythm in the hybrid DSA operating room. Baseline risk was formed preoperatively or in the early intraoperative period according to patient vulnerability and surgical exposure, and was used to prepare pressure-relief materials, determine key observation sites, and front-load resources; after positioning was completed, nursing process information that had already been implemented and could be verified was then incorporated to update risk, and was used to determine whether checks should be intensified, protection should be reinforced, and postoperative observation should be prolonged. Compared with performing a single preoperative score or incorporating nursing process variables into the model all at once, this framework was more effective at reducing purpose mismatch and information leakage and was also easier to embed into the nursing workflow and to use for subsequent quality-control tracking.
Limitations:
This study had a single-center, retrospective design; cases came from inpatient adults undergoing hybrid DSA in the operating room, and only the first surgery per patient was included, so the sample structure may differ from other centers or disease spectra, with limited generalizability. Because the study period spanned January 2021 to December 2024, secular changes in nursing practice, equipment, case mix, and institutional workflow could not be excluded; treating this four-year window as a single analytic sample may have obscured temporal heterogeneity. Some variables depended on nursing and anesthesia documentation, and missing records or inconsistent descriptions may have led to misattribution of position-related complications; nursing process items may also have been influenced by documentation habits rather than fully reflecting actual execution. In particular, completion of key pressure-point protection and completeness of intraoperative position check documentation may partly reflect overall nursing quality or documentation practices rather than the isolated effects of specific measures; therefore, their estimated protective associations should not be interpreted causally. Prospective validation is still needed before these process variables are embedded as actionable triggers in clinical scoring. Some predictors, including completeness of intraoperative position check documentation and whole-procedure summaries such as lowest core temperature, were measured during or after the intraoperative course; because the primary outcome also included intraoperative events, temporal overlap and information leakage could not be fully excluded. In addition, 1,094 records were excluded during screening because case-level missingness across prespecified key predictors exceeded 30%, which may have introduced selection bias toward cases with more complete documentation; because characteristics of included and excluded cases were not compared, the direction and magnitude of this bias could not be determined. Although multiple imputation was used to reduce sample loss due to missingness in the included cohort, if missingness was not random, it could still introduce bias; unmeasured confounding may also exist, such as differences in padding brands, the frequency of intraoperative micro-adjustments of position, and postoperative turning and analgesia strategies. Moreover, the primary outcome was a composite endpoint including events with different mechanistic pathways; therefore, this single score is better interpreted as reflecting the overall risk of position-related complications in the hybrid DSA operating room rather than equivalent predictive meaning for each component outcome. The observed model performance and incremental value of nursing process variables may not have been uniform across all component events, particularly for positioning-related respiratory or hemodynamic instability. The model was based on indicators such as cumulative hypotension time over the entire intraoperative exposure; for early or real-time application, explicit landmark time points are still needed to separate predictor ascertainment from subsequent outcome occurrence and to verify the operability of phase-based updating. This study was only conducted internally and lacks external validation and implementation evaluation. The threshold stratification was derived from data at our center; other centers with different complication rates and nursing workflows will need recalibration and redefinition of triggers. It is recommended to conduct external validation and calibration updating in multicenter prospective cohorts, integrate with the electronic medical record to achieve automatic calculation of preoperative baseline risk and post-positioning updating of process items, and use before–after or interrupted time-series designs to evaluate the real impact on pressure injury, position-related physiologic instability, and nursing resource allocation.
Conclusions
In the hybrid DSA operating room, position-related complications are jointly driven by patient vulnerability and surgical and physiologic exposure. The nursing predictive assessment tool, constructed under the phase-based framework of “baseline risk + modifiable nursing processes,” may support preoperative risk identification and post-positioning risk update and, compared with the model containing only baseline risk, showed better discrimination and calibration and higher net benefit on internal validation within clinical threshold ranges. Pressure-point protection and position checks are modifiable process elements associated with lower risk, while femoral-artery access and sheath management indicate risk sources for focused intervention. Before wider use, prospective external validation, independent recalibration, and implementation evaluation are still needed. With these prerequisites, this tool may support risk adjustment, resource allocation, and nursing quality improvement, and may inform future dissemination and integration into information systems.
Disclosures
The authors declare that they have no conflicts of interest.
Acknowledgements
The authors would like to thank all colleagues and staff who contributed to this study but are not listed as authors.
Materials
| Name | Company | Catalog Number | Comments |
|---|---|---|---|
| Anesthesia information management system | Institutional source | N/A | Source of intraoperative vital signs, vasoactive agents, MAP time series, and anesthesia records. |
| Electronic medical record system | Institutional source | N/A | Source of demographics, comorbidities, operative records, and follow-up clinical documentation. |
| glmnet | CRAN | N/A | R package used for penalized logistic regression and LASSO variable selection. |
| Hybrid digital subtraction angiography operating room | Institutional source | N/A | Study setting for all included procedures; equipped for interventional imaging and open surgery. |
| Laboratory information system | Institutional source | N/A | Source of preoperative laboratory indicators, including albumin and hemoglobin. |
| mice | CRAN | N/A | R package used for multiple imputation by chained equations. |
| Nursing information system | Institutional source | N/A | Source of positioning records, pressure-point protection, intraoperative position checks, and postoperative nursing documentation. |
| Picture archiving and communication system (PACS) | Institutional source | N/A | Source of fluoroscopy duration and imaging-related information. |
| pROC | CRAN | N/A | R package used for ROC analysis, AUC estimation, and DeLong confidence intervals. |
| R | R Foundation for Statistical Computing | N/A | Statistical analysis software environment. |
| rmda | CRAN | N/A | R package used for decision curve analysis. |
| rms | CRAN | N/A | R package used for regression modeling strategies, spline functions, and nomogram construction. |
References
- Jeon, H. J., et al. Four-year experience using an advanced interdisciplinary hybrid operating room: potentials in treatment of cerebrovascular disease. J Korean Neurosurg Soc. , (2019).
- Hara, T., Ozawa, A., Shibutani, K., et al. Practical guide for safe sedation. J Anesth. , (2023).
- Gharios, M., El-Hajj, V. G., Frisk, H., et al. The use of hybrid operating rooms in neurosurgery, advantages, disadvantages, and future perspectives: a systematic review. Acta Neurochir (Wien). , (2023).
- Spruce, L. Positioning the patient. AORN J. , (2021).
- Mahendru, K., Kumar, A., Bhargava, T. Patient positioning under anesthesia during COVID-19 pandemic: foresight risks to prepare, plan and execute. Trends Anaesth Crit Care. , (2021).
- Cai, J., Huang, X., He, L. An evidence-based general anaesthesia and prone position nursing checklist: development and testing. Nurs Open. , (2023).
- Chen, Y., Wang, W., Qian, Q., Wu, B. Comparison of four risk assessment scales in predicting the risk of intraoperative acquired pressure injury in adult surgical patients: a prospective study. J Int Med Res. , (2023).
- Xu, Y., et al. Prediction models for intraoperative acquired pressure injury of adults: a systematic review and critical appraisal. Adv Wound Care (New Rochelle). , (2026).
- Patterson, H., et al. Patient positioning and its impact on perioperative outcomes in children: a narrative review. Paediatr Anaesth. , (2024).
- van Geloven, N., et al. Prediction meets causal inference: the role of treatment in clinical prediction models. Eur J Epidemiol. , (2020).
- Huang, J., et al. Development and validation of a nomogram for predicting critical respiratory events during early anesthesia recovery in elderly patients. BMC Med Inform Decis Mak. , (2024).
- Kim, E. M., Li, G., Kim, M. Development of a risk score to predict postoperative delirium in patients with hip fracture. Anesth Analg. , (2020).
- Bing, R., et al. Validation of European Society of Cardiology pre-test probabilities for obstructive coronary artery disease in suspected stable angina. Eur Heart J Qual Care Clin Outcomes. , (2020).
- Vickers, A. J., van Calster, B., Steyerberg, E. W. A simple, step-by-step guide to interpreting decision curve analysis. Diagn Progn Res. , (2019).
- Pressure injury prevention: AORN guideline takeaways for perioperative nurses. , Association of periOperative Registered Nurses. (2024).
- Peterson, L. Intraoperative pressure injury prevention. Nurs Clin North Am. , (2025).
- Dhoon, T. Q., Vakharia, S., Villaluz, E., Morrison, D. E. The underappreciated dangers of the prone position. , Anesthesia Patient Safety Foundation. (2024).
- Bentsen, S. B., et al. Patient positioning on the operating table and patient safety: a systematic review and meta-analysis. J Adv Nurs. , (2025).
- Esposito, D., et al. Hybrid operating room applications in the increasingly complex endovascular era: the trump card of modern vascular surgery. Ann Surg Treat Res. , (2021).
- Keller, B. P. J. A., van Overbeeke, J., van der Werken, C. Interface pressure measurement during surgery: a comparison of four operating table surfaces. J Wound Care. , (2006).
- Four ways to improve intraoperative patient safety with positioning assessments. , Association of periOperative Registered Nurses. (2024).
- Wang, J., et al. Early mobilization after cardiac catheterization via femoral artery: a systematic review and meta-analysis. Rev Cardiovasc Med. , (2024).
- Kimsey, D. B. A change in focus: shifting from treatment to prevention of perioperative pressure injuries. AORN J. , (2019).
- Fulbrook, P., et al. Use of a risk-based intervention bundle to prescribe and implement interventions to prevent pressure injury: an observational study. J Adv Nurs. , (2025).
- Kim, M., Park, S., Kim, C., Choi, M. Diagnostic accuracy of clinical outcome prediction using nursing data in intensive care patients: a systematic review. Int J Nurs Stud. , (2023).
- Shickel, B., et al. Dynamic predictions of postoperative complications from explainable, uncertainty-aware, and multi-task deep neural networks. Sci Rep. , (2023).
- Lee, J. H., et al. Development of a pressure injury machine learning prediction model and integration into clinical practice: a prediction model development and validation study. Korean J Adult Nurs. , (2024).
- Bedford, J. P., Redfern, O. C., O’Brien, B., Watkinson, P. J. Perioperative risk scores: prediction, pitfalls, and progress. Curr Opin Anaesthesiol. , (2025).