This protocol describes the generation and analysis of iGATA4-blastoids, a scalable stem cell–based model that recapitulates key features of the mouse blastocyst, including lineage organization and cavitation, and enables reproducible, high-throughput assessment of environmental and molecular perturbations affecting early embryonic development.
Method Article
Building Efficient Stem Cell-Derived Mouse Blastocyst Models for Environmental Studies
* These authors contributed equally
In This Article
Summary
Abstract
Stem cell–based embryo models offer a powerful platform for investigating early mammalian development and its sensitivity to environmental perturbations. Here, a robust and accessible protocol is presented for generating high-fidelity mouse blastoids using embryonic stem cells (ESCs), trophoblast stem cells (TSCs), and embryonic stem cells engineered for inducible GATA4 expression (iGATA4-ESCs). This system produces iGATA4-blastoids that accurately recapitulate natural E4.5 blastocyst morphology, lineage proportions, and transcriptional signatures, providing a reliable in vitro model of the primitive endoderm (PE), epiblast (EPI), and trophectoderm (TE) compartments. This protocol first demonstrates how to maintain and prepare the three stem cell populations required for blastoid formation. The step-by-step assembly of iGATA4-blastoids under pre-implantation culture conditions is then outlined, highlighting critical experimental parameters. To enable rigorous characterization, a tested workflow for blastoid fixation, staining, and imaging is provided. Finally, an example is presented demonstrating how iGATA4-blastoids can be used for high-throughput assays. By exposing large cohorts of blastoids to defined environmental factors, changes in morphology, lineage allocation, and developmental progression can be quantified rapidly and reproducibly. Together, this protocol establishes a scalable platform for modeling pre-implantation development, dissecting early lineage decisions, and performing multiparametric screens to assess environmental or molecular influences on blastocyst formation.
Introduction
Understanding how early mammalian embryos self-assemble and how common environmental factors may negatively affect their formation requires model systems that are reproducible, experimentally accessible, and scalable. Integrated embryo-like models generated by combining embryonic and extraembryonic stem cells provide such a platform1,2. This protocol describes how embryonic stem cells (ESCs), trophoblast stem cells (TSCs), and ESCs engineered for inducible GATA4 expression (iGATA4-ESCs) can be assembled under pre-implantation conditions to produce blastoids with robust and properly proportioned primitive endoderm (PE), epiblast (EPI), and trophectoderm (TE) lineages. Recent work has demonstrated that these structures, termed iGATA4-blastoids3, resemble the E4.5 blastocyst in lineage proportions, transcriptional signatures, and functional marker expression. When cultured in vitro, 12.5% of these structures transition to post-implantation morphology. Importantly, they are amenable to toxicology and environmental screens.
The development of this technique was motivated by limitations in pre-existing blastoid systems2,4,5. Although many protocols6,7,8,9,10,11,12,13,14,15,16,17,18,19,20,21 generate cavitated structures resembling early blastocysts, most do so with relatively low efficiency or produce structures with incomplete PE formation, undefined cell identities, or incorrect lineage proportions. These inconsistencies reduce their suitability for mechanistic studies and high-throughput perturbation screens. Because PE specification in vivo follows the activation of GATA6, SOX17, GATA4, and SOX722, and defects in either the PE or its derivative, the visceral endoderm (VE), impair peri-implantation development23,24,25,26,27, enforcing this transcriptional program in vitro improves blastoid fidelity. ESCs carrying a conditional GATA4 transgene robustly transdifferentiate into VE and, when combined with ESCs and TSCs under post-implantation conditions, generate integrated embryo models that gastrulate and initiate organogenesis28,29,30,31. Here, this principle is adapted to pre-implantation conditions, demonstrating that iGATA4-ESCs reliably generate PE and yield blastoids that closely resemble natural blastocysts3.
This method overcomes previous limitations in blastocyst modeling using stem cells and offers high blastoid formation efficiency (80% of structures formed are blastoids, 75% of which demonstrate proper lineage organization and proportions) and high embryo-likeness. Moreover, the modular assembly of iGATA4-blastoids, in which each blastocyst lineage is derived from an independently cultured stem cell population, provides direct experimental access to each embryo compartment. These properties make the system particularly well suited for multiparametric screening applications. Because it yields large cohorts of morphologically consistent structures with accurately proportioned TE, EPI, and PE lineages, it enables parallel perturbations and quantification of lineage-specific responses with statistical power unattainable using natural embryos.
As a proof of principle, the effects of common environmental factors presented at physiological ranges32,33,34,35,36,37,38 on blastoid development were measured. The impact of caffeine, nicotine, ethanol, and amino acid modifications on cavitation rate, morphology, fitness, and lineage proportions was assessed across a range of concentrations and temporal treatment windows. Most conditions (caffeine, ethanol, nicotine, and those mimicking low-protein diets) resulted in aberrant blastoid formation and impaired structural quality. In contrast, increasing the concentration of branched-chain amino acids (similar to high-protein diets) improved blastoid formation efficiency and quality. These results mirrored effects observed in in vitro–cultured natural mouse blastocysts3, demonstrating that this system captures subtle, dose-dependent phenotypes and supports scalable, multidimensional screening pipelines not feasible with natural embryos.
Within the broader context of embryo modeling, this technique demonstrates that the same cells used to model integrated post-implantation development can also be deployed as pre-implantation models. This method is particularly suitable for applications requiring scalable modeling of blastocyst-like structures with accurate PE formation and robust lineage integration. However, as with other stem cell–based models of the mouse blastocyst, iGATA4-blastoids fail to implant and develop further after transfer to a host mouse and are therefore not suitable for studies of embryo–maternal interactions. Overall, this protocol provides a reliable and accessible approach for generating high-fidelity blastoids that model early cell-type decisions in the mammalian embryo.
Protocol
All procedures described in this protocol involve established cell lines and were performed in accordance with institutional biosafety guidelines at the California Institute of Technology. No live animal or human subject work was conducted.
Multiple ESC and TSC lines have been tested and found to support iGATA4-blastoid formation. ESCs, iGATA4-ESCs, and TSCs from previous studies28 have been used successfully to complete all the steps described in this protocol. The same authors describe the generation of iGATA4-ESCs from a previously established CD1 (ICR) mouse ESC line.
TSCs are cultured on top of commercially available mouse embryonic fibroblasts (MEFs). All chemicals, reagents, kits, equipment, and software used in this protocol are listed in the Table of Materials.
1. Culture of mouse stem cells for blastoid formation
- Preparation of MEF feeder plates
- Coat a 6-well cell culture plate with 1.5 mL of 0.2% (w/v) gelatin in deionized (DI) water per well. Incubate at 37 °C in normoxia for at least 45 min.
- During incubation, prepare a 15 mL centrifuge tube with 4 mL of FC media (Table 1) pre-warmed to 37 °C.
- Thaw the MEF vial in a water bath using a figure-eight motion until only a small ball of ice remains. Transfer the contents into the prepared tube, then pipette up and down to thoroughly mix. Centrifuge at 500 × g for 4 min.
- Aspirate the supernatant and resuspend the pellet in 1 mL of FC medium. Adjust to a sufficient volume to plate ~160,000 cells per well in 1.5 mL per well.
- Aspirate the gelatin and plate 1.5 mL of MEFs per well. Incubate in normoxia overnight without disturbance.
- Replace the medium with fresh 1.5 mL per well FC medium the following day. Change the medium every 48 h. Use MEFs 2–7 days after plating. MEFs may remain healthy for longer, but their ability to support TSC growth may be compromised.
CAUTION: Perform all mouse cell culture in biosafety level (BSL) 1 laminar flow cabinets using the BSL-2 technique.
- Thawing and passaging of mouse embryonic stem cells (WT ESCs and iGATA4-ESCs)
- Thaw WT ESCs or iGATA4-ESCs following steps 1.1.1–1.1.3. After centrifugation, resuspend the cells in 1 mL of N2B27/2i/LIF medium (Table 1) and seed ~50,000 cells per well in a gelatin-coated 6-well plate with ~1.5 mL per well. Incubate at 37 °C in normoxia and change medium every 48 h.
- Ensure that colonies are tightly packed and round with minimal protrusions before passaging. Passage every 2–3 days.
NOTE: WT ESCs and iGATA4-ESCs are indistinguishable morphologically until induction with doxycycline (DOX). - Coat a 6-well plate with 1.5 mL of 0.2% gelatin in DI water per well. Incubate at 37 °C for at least 45 min.
- Add 500 µL of cell dissociation reagent per well and incubate for 3 min. Add 2 mL of FC medium while gently pipetting around the edges. Confirm >90% detachment under a microscope. If cells remain attached, gently pipette to aid resuspension.
- Transfer the cell suspension into a 15 mL centrifuge tube and centrifuge at 500 × g for 4 min.
- Aspirate the supernatant and resuspend the pellet in 1 mL of N2B27/2i/LIF medium. Determine cell concentration using 10 µL on a hemocytometer. Adjust volume to seed ~50,000 cells per well.
- Aspirate the gelatin and seed the cells. Incubate in normoxia. Change medium the following day and every 48 h thereafter.
- Thawing and passaging of mouse trophoblast stem cells (TSCs)
- Thaw TSCs following steps 1.1.1–1.1.3. After centrifugation, resuspend the cells in 1 mL of TSF4H medium (Table 1) and seed ~20,000 cells per well in a MEF-coated 6-well plate. Incubate at 37 °C, 5% CO₂, 5% O₂ (hypoxia) and change medium every 24 h.
- Ensure colonies are large (>75 µm diameter) and flattened before passaging. Add 500 µL of cell dissociation reagent per well and incubate for 5 min. Add 2 mL of FC medium while gently pipetting. Confirm >90% detachment.
- Transfer cells to a centrifuge tube and spin at 500 × g for 4 min.
- Resuspend in 1 mL TSF4H medium. Determine concentration and adjust to ~20,000 cells per well.
- Plate onto MEFs and incubate in hypoxia. Change medium every 24 h and passage every 2–3 days before colony merging.
2. Formation of iGATA4-blastoids
- Preparation of Microwell aggregation plate for cell aggregation
- Add 500 µL of anti-adherence rinsing solution to each well of a Microwell aggregation plate. Centrifuge at 2,000 × g for 5 min with proper balancing to remove trapped air from the microwells. Incubate at 37 °C in normoxia for at least 1 h or overnight.
- Blastoid preparation, day 0 — Preparation and plating of WT and iGATA4-ESCs
- Pre-warm N2B27/2i/LIF, FC, and FCYL media (FC + 10 ng/mL mouse recombinant LIF (mLIF) + 2 µM ROCK inhibitor Y27632) to 37 °C. Prepare 0.2% gelatin in DI water and have the cell dissociation reagent ready.
- Aspirate anti-adherence solution without touching the well bottom. Wash twice with 1 mL PBS and once with 1 mL FCYL medium. Pipette along the wall to avoid damaging the microwells.
- Prepare a gelatin-coated 6-well plate (≥45 min incubation) for passaging cells.
- Harvest WT and iGATA4-ESCs by aspirating medium and adding 500 µL cell dissociation reagent per well. Incubate for 3 min at 37 °C. Add 2 mL FC medium and gently pipette. Confirm complete detachment under a microscope. Transfer to a 15 mL tube and centrifuge at 500 × g for 4 min.
- Resuspend in 1 mL FCYL medium. Determine cell concentration using 10 µL on a hemocytometer. Adjust to 500,000–700,000 cells/mL. Calculate the volume required for 5 WT ESCs and 5 iGATA4-ESCs per microwell (6,000 cells per well).
NOTE: Optimize for other ESC lines if needed. A starting range is 4–7 ESCs per microwell with a 1:1 ratio of ESCs to iGATA4-ESCs. - Prepare 500 µL of cell suspension per well. Add dropwise to the Microwell aggregation plate using a 1000 µL pipette. Centrifuge at 100 × g for 3 min and verify even distribution. Incubate for 6 h until aggregates form.
- Passage remaining ESCs as described in Section 1.2.
- Blastoid preparation, day 0 — Preparation of TX medium
- Prepare ~20 mL TX basal medium using DMEM/F12 (Table 2). Prepare fresh for each experiment.
- Add 200 µL 200 mM L-alanyl-L-glutamine supplement (final 2 mM). Store stock at 4 °C.
- Add 200 µL 10,000 U/mL penicillin/streptomycin (final 100 U/mL each). Store at −20 °C.
- Add 40 µL 32 mg/mL L-ascorbic acid (final 64 µg/mL). Prepare in DI water, filter sterilize, and store at −20 °C.
- Add 20 µL sodium selenite (final 14 ng/mL). Prepare and store at −20 °C.
- Add 240 µL NaHCO₃ (final 543 µg/mL). Mix thoroughly after thawing.
- Add 20 µL holo-transferrin (final 10.7 µg/mL). Mix after thawing.
- Add ~37.5 µL insulin (final 19.4 µg/mL; batch dependent). Store at 4 °C.
- Immediately before use, add Y27632 to a final concentration of 20 µM, CHIR99021 to 3 µM, IL-11 to 30 ng/mL, FGF4 to 25 ng/mL, heparin to 1 µg/mL, mLIF to 10 ng/mL, TGFβ to 15 ng/mL, and 8Br-cAMP to 25 µM.
- Prepare ~20 mL TX basal medium using DMEM/F12 (Table 2). Prepare fresh for each experiment.
- Blastoid preparation, day 0 — Preparation and plating of TSCs
- Pre-warm TSF4H, FC (Table 1), and TX media (Section 2.3). Prepare gelatin-coated plates (≥45 min) for MEF depletion.
- Harvest TSCs by adding 500 µL cell dissociation reagent per well and incubating for 5 min in hypoxia. Add 2 mL FC medium and gently pipette. Confirm detachment. Transfer to a tube and centrifuge at 500 × g for 4 min.
NOTE: TSCs cultured >4 days may require up to 10 min cell dissociation reagent treatment. - Resuspend in 1 mL TSF4H medium and adjust to appropriate volume for plating at a 1:2 split.
- Plate onto gelatin-coated wells for MEF depletion. Incubate ~45 min in hypoxia. Ensure MEFs attach while TSCs remain mostly unattached.
- Replace 900 µL medium from Microwell aggregation plate wells with 500 µL TX medium. Return to hypoxia.
- Transfer TSC-containing supernatant to a tube without disturbing attached MEFs. Determine concentration (target 500,000–700,000 cells/mL).
- Calculate volume for 12 TSCs per microwell (14,400 cells per well). Centrifuge if further concentration is required.
NOTE: Optimize for other TSC lines (10–15 cells per microwell recommended). - Add 500 µL cell suspension per well dropwise. Centrifuge at 100 × g for 3 min. Confirm distribution and incubate in hypoxia for 24 h.
- Passage remaining TSCs as needed (Section 1.3).
- Blastoid preparation, day 1 — Induction
- Around 24 h after TSC addition, add 20 µL of 5 mM 8Br-cAMP and 1 µL of 1 µg/mL DOX per well. Incubate for 48–72 h in hypoxia.
- Blastoid preparation, day 3 — Fixation
- Resuspend aggregates using a cut 1000 µL pipette tip. Transfer to 2 mL tubes and allow sedimentation for 5 min.
- Remove supernatant and add 250 µL of 4% paraformaldehyde (PFA). Resuspend gently.
CAUTION: Handle PFA in a fume hood with appropriate PPE. - Incubate 15 min, flicking every 5 min.
- Remove PFA and add 300 µL PBST (PBS + 0.1% Tween-20). Mix gently. Store at 4 °C for <1 week before staining.
- Immunofluorescence of blastoids
- Transfer 150 µL per sample to a 96-well U-bottom plate.
- Add 100 µL permeabilization buffer and incubate 20 min. Replace with primary antibody solution and incubate overnight at 4 °C.
- Wash 3× with PBST (5 min each). Add secondary antibodies.
- Incubate 2 h at room temperature in the dark.
- Wash 3× and transfer to imaging dish.
- Image using confocal microscopy (≥25× objective, NA ≥0.8).
3. High-throughput screens using the iGATA4-blastoid model
- iGATA4-blastoid preparation and testing of environmental factors
- Prepare Microwell aggregation plate as described in Section 2.1 and generate iGATA4-blastoids following Sections 2.2–2.4. Prepare sufficient wells, including appropriate controls. Include a blank control (blastoids prepared using the standard protocol), a carrier control, and one or more experimental conditions.
- Incubate blastoids overnight in hypoxia. Approximately 24 h after TSC seeding, prepare TX medium supplemented with 8Br-cAMP, doxycycline (DOX), and the compound of interest (or carrier control). The following conditions have been tested:
- Caffeine: 3.5 mg/L, diluted from ultrapure water stocks.
- Nicotine: 330 ng/L, diluted from 100% ethanol (EtOH) stocks.
- Ethanol: 17 mM, diluted from absolute EtOH.
- High branched-chain amino acids (BCAA): +5%, +25%, +50% relative to baseline concentrations (0.45 mM L-leucine, 0.45 mM L-valine, 0.42 mM L-isoleucine), prepared from concentrated stocks in ultrapure water.
- Low methionine and leucine: −5%, −25%, −50%, −100% relative to baseline concentrations (0.12 mM L-methionine, 0.45 mM L-leucine), prepared using Met-/Leu-free DMEM/F12. Met-/Leu-free DMEM (LM-DMEM) is supplemented with 1x Ham's F-12 Nutrient Mix before use.
CAUTION: Prepare and handle concentrated caffeine and nicotine stocks in a fume hood using appropriate personal protective equipment (PPE; gloves, lab coat, eye protection). Ethanol is flammable and must be kept away from heat sources.
- Aspirate the medium from each well and add 1 mL of compound-containing TX medium. Process one well at a time to avoid drying. Return the plate to the hypoxia incubator and culture until day 3.
- Capture representative brightfield images on day 3 using a transmitted light microscope. Fix the structures and perform immunofluorescence as described in Sections 2.6 and 2.7.
NOTE: Adjust treatment windows depending on the experimental objective. Treatments can be applied during early aggregation (day 1) or later stages (e.g., cavity expansion). Example windows include day 1–3, day 1–2 (followed by media replacement), and day 2–3.
- Multiparametric iGATA4-blastoid analysis
- Use brightfield images to quantify the percentage of wells containing cavitated structures (i.e., structures with a clearly defined central cavity) and measure blastoid diameter.
- Open images in the image analysis software.
- Use the straight-line tool to draw a line across each structure.
- Measure diameter using Analyze > Measure.
- Select representative immunostained samples (20–40 structures per biological replicate, with at least three biological replicates per condition) and image as described in Section 2.7.
- Quantify total cell number and lineage composition using immunofluorescence markers: TE (CDX2-positive), EPI (SOX2-positive and SOX17-negative), and PE (SOX17-positive).
- Assess structural organization and morphology by determining whether PE cells are spatially segregated from EPI cells within the inner cell mass (ICM) (binary classification: yes/no).
- Classify morphology as good (clear blastocyst-like structure with a defined cavity and properly organized TE, EPI, and PE compartments), mediocre (minor abnormalities such as irregular shape or partially formed cavity), or bad (major abnormalities such as absence of cavity or disorganized/unsorted lineages).
- Quantify additional parameters, including cavity size or volume, where applicable. Use bioinformatic tools or other tools for plotting and statistical analysis, and 3D image analysis software for cell counting and/or image preparation for display.
- Use brightfield images to quantify the percentage of wells containing cavitated structures (i.e., structures with a clearly defined central cavity) and measure blastoid diameter.
Results
Maintaining ESCs and iGATA4-ESCs (normoxia) and TSCs (hypoxia) under appropriate culture conditions is essential for successful blastoid generation. When cultured as described, ESCs and iGATA4-ESCs should be largely indistinguishable, forming mid-sized, round, and well-defined colonies after 3 days. The appearance of flattened colonies or protrusive edges indicates incipient differentiation, and such cultures should not be used for blastoid formation. TSCs should form flat epithelial colonies with slightly raised edges and flatter centers. Overgrown or merging TSC colonies (typically after >3 days in culture) often result in poor blastoid outcomes (Figure 1).
During iGATA4-blastoid assembly, several early hallmarks indicate protocol success (Figure 2A, B). Approximately 6 h after ESC and iGATA4-ESC aggregation, tight cell aggregates should be visible at the bottom of the microwells. Loose aggregates suggest excessive cell dissociation reagent exposure, which reduces cell–cell adhesion. Progression to the next step (TSC addition; Section 2.4) should only occur once tight aggregates are observed (Figure 2B, D0.5 timepoint). Immunostaining at this stage should show homogeneous SOX2⁺ and GATA4⁻ aggregates (Figure 2B, D0.5 timepoint).
Following TSC addition and overnight incubation, a single cohesive aggregate surrounded by CDX2⁺ cells should be evident (Figure 2B). The presence of large, unaggregated cells at the surface of aggregates often indicates residual MEFs. MEF contamination can reduce blastoid formation efficiency; therefore, adequate MEF depletion is critical to obtain a predominantly TSC population prior to aggregation. A 40 µm cell strainer may be used to remove residual MEFs, although this may reduce TSC yield. Incomplete or excessive CDX2⁺ coverage can be corrected by adjusting the number of TSCs added per microwell (recommended range: 10–15).
Following the addition of DOX and 8Br-cAMP, cavities are typically observed by day 2 and may persist until day 3. Under brightfield microscopy, cavities appear as clear, empty spaces within blastoids (Figure 2B, C; white dashed line). GATA4⁺ cells appear shortly after DOX induction and progressively sort to the surface of the ICM-like compartment (Figure 2B). Successful blastoid formation is characterized by high cavitation efficiency (typically ~80% of structures per Microwell aggregation plate; Figure 2D), a single-layered CDX2⁺ TE-like outer epithelium, a blastocoel-like cavity, and a rounded ICM-like compartment containing SOX2⁺ EPI-like cells overlaid by GATA4⁺ PE-like cells (Figure 2C–E).
Common suboptimal outcomes include non-cavitated structures, irregularly shaped blastoids with multiple cavities or ICM-like compartments, and wells containing few structures or cellular debris. While approximately 20% abnormal structures are expected (Figure 2C), higher rates may indicate issues such as incorrect TX medium preparation, poor starting cell quality, failure to add DOX or 8Br-cAMP on day 1, or displacement of structures during medium changes.
For high-throughput screening applications, untreated and vehicle control wells should yield blastoids comparable to positive-control conditions (Figure 3A,B). Experimental treatments may affect multiple quality metrics, including blastoid size (Figure 3C), cavitation efficiency, total and lineage-specific cell numbers (Figure 3D), PE sorting, and overall morphology (Figure 3E). For example, treatment with caffeine, nicotine, or ethanol during blastoid formation resulted in smaller structures with reduced cavitation efficiency, lower total or ICM cell numbers, impaired PE sorting, and poorer morphology. In contrast, increasing concentrations of branched-chain amino acids produced larger, more highly cavitated blastoids with increased cell numbers and improved morphology (Figure 3C–E). Biological variability between experiments is expected, highlighting the importance of including both blank and carrier controls in each experiment.
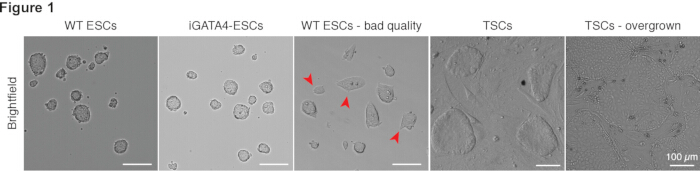
Figure 1: Examples of good- and poor-quality WT ESCs, iGATA4-ESCs, and TSCs. Brightfield micrographs of WT ESCs, iGATA4-ESCs, and TSCs showing expected colony morphologies after 2–3 days of culture in N2B27/2i/LIF (ESCs) or TSF4H medium (TSCs). The panel titled “WT ESCs – bad quality” shows cells with suboptimal morphology, including flattened colonies with protruding edges (red arrowheads). The panel “TSC overgrown” shows merged and enlarged TSC colonies after 4 days of culture. Scale bar: 100 µm for all panels. Please click here to view a larger version of this figure.
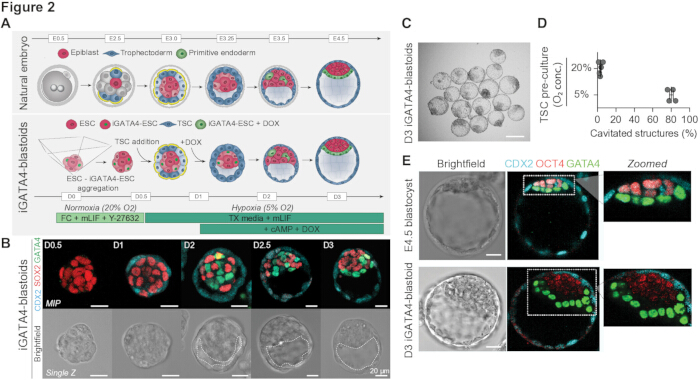
Figure 2: Schematic and expected morphology of iGATA4-blastoids. Reprinted from Developmental Cell, Vol. 61, Jorgensen V, Bao M, Junyent S et al., Efficient stem cell-derived mouse embryo models for environmental studies, pp. 193–207.e6, Copyright (2025)3, with permission from Elsevier. (A) Schematic representation of natural mouse blastocyst development (top) and stem cell–based blastocyst modeling using WT ESCs, iGATA4-ESCs, and TSCs.
(B) Micrographs showing expected morphology and marker expression at different stages of the protocol. Maximum intensity projection (MIP); dashed lines delineate the cavity. Scale bar: 20 µm. (C) Brightfield image of iGATA4-blastoids at day 3. Scale bar: 100 µm.
(D) Cavitation rates of iGATA4-blastoids generated using TSCs pre-cultured in normoxia or hypoxia; aggregates were cultured under hypoxic conditions. n ≥ 4; error bars represent the standard error of the mean. (E) Immunostaining of E4.5 blastocysts and day 3 iGATA4-blastoids for lineage markers (CDX2, cyan; OCT4, red; GATA4, green). Maximum intensity projection (MIP); single Z-plane shown where indicated. Scale bar: 25 µm. Please click here to view a larger version of this figure.
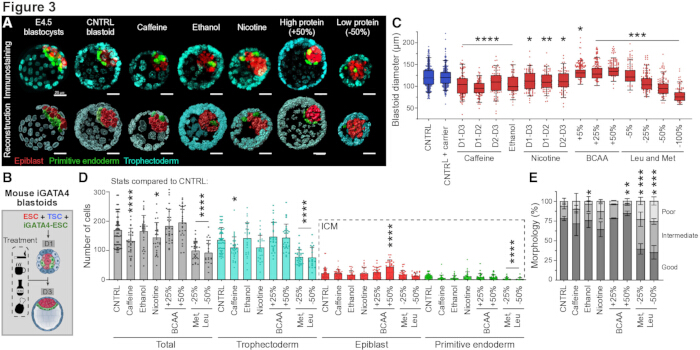
Figure 3. Effects of environmental factors on blastoid formation and quality. (A) Representative immunofluorescence 3D images (top) and IMARIS surface reconstructions (bottom) of iGATA4-blastoids treated with environmental factors (caffeine, nicotine, ethanol, and conditions mimicking high- and low-protein diets). Scale bars: 25 µm for all images. (B) Schematic of the experimental workflow. (C) Blastoid diameter under different treatment conditions. The range represents the 10th–90th percentiles; boxes indicate the interquartile range; the line indicates the median. Statistical analysis was performed using one-way ANOVA with multiple comparisons. (D) Quantification of total (gray), trophectoderm (cyan), epiblast (red), and primitive endoderm (green) cell numbers in control and treated blastoids. Bars represent the mean; error bars represent the standard deviation. Statistical analysis was performed using one-way ANOVA with multiple comparisons. (E) Quantification of the proportion of blastoids classified as “good” (proper lineage sorting with minimal morphological abnormalities), “mediocre” (largely correct morphology with minor abnormalities, including incomplete EPI–PE sorting), or “bad” (severely abnormal morphology with disrupted lineage organization) under control and treatment conditions. Statistical analysis was performed using two-way ANOVA relative to control conditions. For all panels, n ≥ 3. Statistical significance is indicated as *p < 0.05, **p < 0.01, ***p < 0.001, ****p < 0.0001. Please click here to view a larger version of this figure.
| Media | Reagent | Final concentration |
| FC | ||
| DMEM | n.a. | |
| Heat-inactivated FBS (iFBS) | 15% | |
| GlutaMax | 2 mM | |
| 2-Mercaptoethanol (2-ME) | 0.1 mM | |
| Non-essential amino acids (NEAA) | 1x | |
| Na Pyruvate | 1x | |
| Penicillin–Streptomycin | 1x | |
| N2B27/2i/LIF | ||
| DMEM/F12 | 50% | |
| NeurobasalA | 50% | |
| B27 supplement | 1x | |
| N2 supplement | 0.5x | |
| 2-ME | 100 µM | |
| Penicillin–Streptomycin | 1% | |
| GlutaMax | 2 mM | |
| PD0325901 | 1 µM | |
| CHIR99021 | 3 µM | |
| Mouse recombinant LIF | 10 ng/mL | |
| TSF4H | ||
| Megacell RPMI-1640 Medium | n.a. | |
| iFBS | 20% | |
| GlutaMax | 2 mM | |
| Na Pyruvate | 1x | |
| Penicillin–Streptomycin | 1x | |
| FGF4 | 25 ng/mL | |
| Heparin | 1 μg/mL |
Table 1: Media recipes for FC, N2B27/2i/LIF, and TSF4H. Recipes to prepare FC media, N2B27/2i/LIF media, and TSF4H media, with final concentrations.
| Component | Final concentration | Stock concentration | Solvent and storage | Volume to ~20 mL |
| 8Br-cAMP | 25 µM | 5 mM | PBS, store at -20 °C | 100 µL |
| CHIR99021 | 3 µM | 10 mM | DMSO, store at -20 °C | 6 µL |
| DMEM/F12 | N/A | N/A | Store at 4 °C | 20 mL |
| FGF4 | 25 ng/mL | 100 µg/mL | 0.1% BSA in PBS, store at -20 °C | 5 µL |
| L-alanyl-L-glutamine Supplement | 2 mM | 200 mM | Store at 4 °C | 200 µL |
| Heparin | 1 µg/mL | 1 mg/mL | PBS, store at -20 °C | 20 µL |
| Holo-transferrin | 10.7 µg/mL | 10.7 mg/mL | DI water, store at -20 °C | 20 µL |
| Human TGF-β1 | 15 ng/mL | 20 µg/mL | 4 mM HCl + 0.1% BSA, store at -20 °C | 15 µL |
| IL-11 | 30 ng/mL | 25 µg/mL | 0.1% BSA in PBS, store at -20 °C | 24 µL |
| Insulin | 19.4 µg/mL | 9.5 - 11.5 mg/mL | Concentration is batch dependent, store at 4 °C | 33.7–40.8 µL, adjust volume according to stock concentration. |
| L-ascorbic acid-2-phosphate magnesium | 64 µg/mL | 32 mg/mL | DI water, store at -20 °C | 40 µL |
| Mouse recombinant LIF | 10 ng/mL | 10 µg/mL | PBS + 0.1% BSA, store at -20 °C | 20 µL |
| NaHCO3 | 543 µg/mL | 45.25 mg/mL | DI water, store at -20 °C | 240 µL |
| Penicillin/Streptomycin | 1x | 100x | Store at -20 °C | 200 µL |
| Sodium selenite | 14 ng/mL | 14 µg/mL | DI water, store at -20 °C | 20 µL |
| Y27632 | 20 µM | 20 mM | DMSO, store at -20 °C | 20 µL |
Table 2: Media recipe for TX. Recipe to prepare TX media, with details on how to prepare and store small molecules and other reagents, and final concentrations.
Discussion
iGATA4-blastoids provide a highly efficient, embryo-like, stem cell–based model of the mouse blastocyst by self-organizing three in vitro–cultured cell types: ESCs, inducible GATA4-ESCs (iGATA4-ESCs), and hypoxia-cultured TSCs. These structures recapitulate key features of the E4.5 blastocyst, including appropriate lineage proportions and transcriptional identity, and can be used for multiparametric environmental screening, reliably reflecting blastocyst-stage developmental defects3. A recent study further demonstrates that aggregation of ESCs, iGATA4-ESCs, and TSCs in basal blastoid media also yields high-efficiency blastoid formation, highlighting the robustness and adaptability of this approach across laboratories and culture conditions39. iGATA4-ESCs have previously been shown to recapitulate the functions of VE cells in post-implantation stem cell–based embryo models28,29,30,31. Together, these results illustrate how iGATA4-ESCs can serve as flexible and reliable stand-ins for PE/VE cells in stem cell–based embryo modeling across developmental stages.
Several steps in the protocol are critical for achieving high-quality blastoids. These include the quality of the starting cell populations, particularly hypoxia-cultured TSCs (Figure 1); the preparation of TX medium, which should be freshly prepared on day 0 (Table 2; Section 2.3); and careful handling of plates following aggregation. Key readouts of protocol success include cavitation efficiency (typically ~80%), appropriate morphology (~100 µm diameter structures with a blastocoel-like cavity, a CDX2⁺ TE-like outer layer, and a sorted SOX2⁺ and GATA4⁺ inner cell mass with an approximate 3 TE:1 EPI:1 PE ratio), and the presence of a properly sorted GATA4⁺ PE-like layer. These are metrics commonly used in the field1,2,4,5. Among cavitated blastoids, approximately 75% of structures display all of these features. These metrics can be used as initial indicators for troubleshooting. Suboptimal cell quality is typically reflected in abnormal colony morphology, resulting in poorly aggregated or non-cavitated structures. Improper medium preparation may lead to incomplete aggregation or lineage defects, while rough handling can result in multiple aggregates per microwell or empty wells.
Further optimization may include adjusting the number of seeded cells (recommended starting ranges: 4–7 ESCs and iGATA4-ESCs, and 10–15 TSCs per microwell), refining MEF depletion methods (e.g., filtration through a 40 µm cell strainer), and modifying the TX medium composition. For example, removal of FGF4 and heparin can still support efficient blastoid formation while promoting a more mural TE-like identity. iGATA4-blastoids can be maintained in culture for up to 6 days; however, structures from days 4–6 often increase in size while retaining blastocyst-like proportions of the lineage. The protocol yields consistent results across biological replicates, but appropriate controls should be included in each experiment.
Compared with other mouse blastoid systems, which vary in starting cell populations and culture conditions6,7,8,9,10,11,12,13,14,15,16,17,18,19,20, iGATA4-blastoids achieve both high formation efficiency and accurate lineage representation. While many existing protocols generate cavitated structures and are valuable for specific biological applications, they often exhibit incomplete PE formation, heterogeneous or undefined cell identities, or incorrect lineage proportions. By combining three lineage-directed stem cell populations in a stepwise manner, iGATA4-blastoids overcome these limitations and provide a reproducible, modular, and experimentally accessible system.
Despite these advantages, several limitations remain. Extended in vitro culture in TX medium beyond 4–6 days results in overgrowth, even if lineage proportions remain blastocyst-like. Approximately 12.5% of iGATA4-blastoids transition to peri-implantation–like morphologies in vitro, characterized by a cup-shaped, pseudostratified epiblast surrounding a pro-amniotic cavity, an expanded extraembryonic ectoderm-like compartment adjacent to the proximal epiblast, and an outer visceral endoderm–like layer. However, iGATA4-blastoids fail to implant and develop further following transfer into a host mouse. Therefore, iGATA4-blastoids, and blastoids more broadly, are not suitable for studying implantation or embryo–maternal interactions.
The molecular basis of blastoids' failure to implant remains unclear, although current evidence suggests that incomplete trophectoderm modeling may be a contributing factor. TE-like cells in iGATA4-blastoids exhibit an overly polar molecular identity. Future efforts to engineer TSCs that more closely resemble mural TE cells, or to introduce alternative cell lines that better recapitulate implantation-competent TE, represent promising directions to overcome these limitations. The modular nature of iGATA4-blastoids, in which TE-specific modifications can be implemented independently of EPI and PE formation, makes this system particularly well-suited for such developments.
Taken together, the iGATA4-blastoid protocol provides a robust and scalable platform for studying lineage specification and early developmental processes in the mammalian embryo. Its reproducibility and adaptability make it well-suited for high-throughput environmental, pharmacological, and genetic screening applications. As such, iGATA4-blastoids represent a powerful system for investigating early developmental mechanisms and assessing how diverse perturbations influence pre-implantation development.
Disclosures
Authors declare no competing interests.
Acknowledgements
The authors thank Christoph Häfelfinger, Victoria Jorgensen, Min Bao, Lenja Fluetsch, and the members of the Zernicka-Goetz lab for their help in developing and improving iGATA4-blastoids. This work was supported by the National Institute of Health Director’s Pioneer Award (5DP1HD104575-04 to M.Z.-G.), the Open Philanthropy Award (M.Z.-G.), the Human Frontiers Science Program (LT-0022/2022 to S.J.), the NSFC (82301873 to M.B.), the Ministry of Science and Technology of China (2024YFA1107002 to M.B.), the Swiss Study Foundation (C.M.H.), the Werenfels Fund of the Free Academic Society (Freie Akademische Gesellschaft) Basel (C.M.H.), and the Claudine and Hans-Heiner Zaeslin-Bustany Foundation (C.M.H.).
Materials
| Name | Company | Catalog Number | Comments |
|---|---|---|---|
| 2-Mercaptoethanol | Thermo Fisher Scientific | 31350010 | Used for general media preparation |
| 8-Bromo-cAMP | STEMCELL Technologies | 73602 | Used for TX media preparation and blastoid cavitation |
| AggreWell400 | STEMCELL Technologies | 34415 | Microwell aggregation plate; Used for blastoid preparation |
| Anti-Adherence Rinsing Solution | STEMCELL Technologies | 7010 | Used for blastoid preparation |
| ART Wide Bore Filtered Pipette Tips | Thermo Fisher Scientific | 2079GPK | Wide bore pipettes for blastoid movement during immunostaining. |
| B27 Supplement | Thermo Fisher Scientific | 17504044 | Used for media preparation |
| Caffeine | Sigma | 58-08-2 | Used as environemental factor to test in iGATA4-blastoids |
| CDX2 antibody, mouse | Biogenex | MU392A5UC | For immunofluorescence, used at 1:200 |
| CellXpert (normoxia incubator) | Eppendorf | 6731010015 | Other brands/models may work too. |
| CHIR99021 | STEMCELL Technologies | 72054 | Used for media preparation |
| Countess Cell Counting Chamber slides | Invitrogen | C10228 | Used for general tissue culture purposes |
| DAPI | Thermo Fisher Scientific | D1306 | Used for immunofluorescence, used at 1:500-1:1,000 |
| DMEM | Gibco | 11995040 | Used for FC media preparation |
| DMEM/F12 | Thermo Fisher Scientific | 21331-020 | Used for N2B27 and TX media preparation |
| DMEM-LM | Thermo Fisher Scientific | 30030 | Supplement DMEM-LM with Ham's F-12 Nutrient Mix powder to a final 1x concentration to obtain Met- and Leu-free DMEM/F12 |
| Donkey anti-Goat IgG (H+L) Cross-Adsorbed Secondary Antibody, Alexa Fluor 488 | Invitrogen | A-11055 | Used for immunofluorescence, used at 1:500-1:1,000 |
| Donkey anti-Mouse IgG (H+L) Highly Cross-Adsorbed Secondary Antibody, Alexa Fluor™ 647 | Invitrogen | A-31571 | Used for immunofluorescence, used at 1:500-1:1,000 |
| Donkey anti-Rabbit IgG (H+L) Highly Cross-Adsorbed Secondary Antibody, Alexa Fluor™ 568 | Invitrogen | A10042 | Used for immunofluorescence, used at 1:500-1:1,000 |
| Donkey anti-Rat IgG (H+L) Highly Cross-Adsorbed Secondary Antibody, Alexa Fluor 647 | Invitrogen | A78947 | Used for immunofluorescence, used at 1:500-1:1,000 |
| Donkey Serum | Jackson ImmunoResearch | 017-000-121 | Used for imunofluorescence. Thaw at 4°C;, and store aliquoted at -20°C;. |
| Doxycycline | Sigma | D9891-5G | For iGATA4 induction during blastoid preparation |
| Eppendorf Centrifuge 5702 | Eppendorf | 5702 | used in our lab, others will work. Requires tube and plate adaptors. |
| Falcon 96-well Clear Round Bottom Not Treated Microplate, with Lid, Individually Wrapped | Corning | 351177 | Used for immunofluorescence |
| FGF4 | R&D Systems | 5846-F4 | Used for media preparation |
| Fiji | Schindelin et al., 2012 | https://imagej.net/Fiji | Used for image analysis |
| GATA4 antibody, rabbit | Cell Signalling | 36966S | Used for immunofluorescence, used at 1:500 |
| Gelatin solution, 2% | Sigma | G1393 | Used for general tissue culture purposes |
| Glass Bottom Dish 35 mm | Ibidi | 81218-200 | For immunofluorescence and imaging |
| GlutaMAX | Thermo Fisher Scientific | 35050-061 | L-alanyl-L-glutamine supplement; Used for media preparation |
| Ham's F-12 Nutrient Mix powder | Thermo Fisher Scientific | 21700075 | Used as supplement for DMEM-LM, for low-protein diet conditions. |
| Heparin | Sigma | H3149 | Used for media preparation |
| Heracell VIOS 160i (hypoxia incubator) | Thermo Fisher Scientific | 51030400 | Other brands/models may work too. |
| Holo-transferrin | Sigma | T4132 | Used for TX media preparation. |
| Human recombinant TGF-ß1 | PeproTech | 100-21 | Used for TX media preparation. |
| IL-11 | PeproTech | 200-11 | Used for TX media preparation. |
| Imaris | Oxford Instruments | https://imaris.oxinst.com/ | Used for image analysis and image preparation. |
| Inactivated Fetal Bovine Serum | Corning | 35-010-CV | Used for media preparation |
| Inducible GATA4 ESCs (tetO-GATA4-ESCs) | Amadei et al., 2021 | NA | Cell line available from the Zernicka-Goetz lab upon request |
| Insulin | Sigma | I9278 | Used for TX media preparation. |
| Irradiated C57bl/6 Mouse Embryonic Fibroblasts | Thermo Fisher Scientific | A34960 | Used as feeder layer for TSC culture. Thaw as indicated in the protocol and use within a week. |
| L-ascorbic acid-2-phosphate magnesium | Sigma | A8960 | Used for TX media preparation. |
| L-isoleucine | Thermo Fisher Scientific | 73-32-5 | Used to supplement TX media. |
| L-leucine | Thermo Fisher Scientific | 61-90-5 | Used to supplement TX media. |
| L-valine | Thermo Fisher Scientific | 72-18-4 | Used to supplement TX media. |
| Megacell RPMI-1640 Medium | Sigma | M3817 | Used for media preparation |
| Miscellaneous pipette tips | Multiple providers | NA | For general liquit handling |
| Mouse recombinant LIF | STEMCELL Technologies | 78056 | Used for media preparation |
| N2 Supplement | Thermo Fisher Scientific | 17502048 | Used for media preparation |
| NaHCO3 | Sigma | S5761 | Used for TX media preparation. |
| Neurobasal A | Thermo Fisher Scientific | 10888-022 | Used for media preparation |
| Nicotine | Sigma | 54-11-5 | Used as environemental factor to test in iGATA4-blastoids |
| Non-essential amino acids | Thermo Fisher Scientific | 11140-050 | Used for general media preparation |
| Parafilm | Thermo Fisher Scientific | 13-374-10 | For immunofluorescence |
| Paraformaldehyde, 16% | Electron Microscopy Sciences | 15710 | Used for immunofluorescence, prepare 4% working concentration in PBS before use. |
| PBS | Thermo Fisher Scientific | 10010031 | Used for general tissue culture purposes and immunofluorescence |
| PD0325901 | STEMCELL Technologies | 72184 | Used for media preparation |
| Penicillin–Streptomycin | Thermo Fisher Scientific | 15140122 | Used for media preparation |
| Pluriselect pluriStrainer (Cell Strainer) 40 um mesh-size PET | Thermo Fisher Scientific | NC1401489 | Optional, for MEF depletion |
| Prism10 | GraphPad | https://www.graphpad.com/scientific-software/prism/ | Used for data analysis and plotting. |
| ROCK inhibitor Y27632 | STEMCELL Technologies | 72304 | Used for media preparation and blastoid formation |
| Sodium Pyruvate | Thermo Fisher Scientific | 11360070 | Used for media preparation |
| Sodium selenite | Sigma | S5261 | Used for TX media preparation. |
| SOX17, goat | R&D Systems | AF1924 | Used for immunofluorescence, used at 1:500-1:1,000 |
| SOX2, rat | Invitrogen | 14981180 | Used for immunofluorescence, used at 1:500-1:1,000 |
| Triton X-100 | Sigma | T8787 | Used for immunofluorescence |
| TrypLE Select enzyme | Thermo Fisher Scientific | 12563011 | Cell dissociation reagent; Used for general tissue culture purposes |
| TSC-eGFP | Tanaka et al., 1998 | NA | Cell line available from the Zernicka-Goetz lab upon request |
| Tween-20 | Sigma | P1379 | Used for immunofluorescence |
| Ultrapure water for tissue culture | Thermo Fisher Scientific | 10977023 | Used for general tissue culture purposes |
| WT CD1 ESCs | Amadei et al., 2021 | NA | Cell line available from the Zernicka-Goetz lab upon request |
| WT TSCs | Sozen et al., 2019 | NA | Cell line available from the Zernicka-Goetz lab upon request |
| Zeiss 980 confocal microscope | ZEISS | NA | Microscope, other makes and models may work too. |
References
- Zernicka-Goetz, M. The evolution of embryo models. Nat Methods. 20 (12), 1844-1848 (2023).
- Handford, C. E., Junyent, S., Jorgensen, V., Zernicka-Goetz, M. Embryonic models. Curr Opin Genet Dev. 84, 102134 (2024).
- Jorgensen, V., et al. Efficient stem cell-derived mouse embryo models for environmental studies. Dev Cell. 61, 193-207.e6 (2025).
- Luijkx, D., Shankar, V., van Blitterswijk, C., Giselbrecht, S., Vrij, E. From mice to men: generation of human blastocyst-like structures in vitro. Front Cell Dev Biol. 10, 838356 (2022).
- Oura, S., Hamilton, J. N., Wu, J. Recent advances in stem cell-based blastocyst models. Curr Opin Genet Dev. 81, 102088 (2023).
- Rivron, N. C., et al. Blastocyst-like structures generated solely from stem cells. Nature. 557 (7703), 106-111 (2018).
- Kime, C., et al. Induced 2C expression and implantation-competent blastocyst-like cysts from primed pluripotent stem cells. Stem Cell Reports. 13 (3), 485-498 (2019).
- Li, R., et al. Generation of blastocyst-like structures from mouse embryonic and adult cell cultures. Cell. 179 (3), 687-702.e18 (2019).
- Sozen, B., et al. Self-organization of mouse stem cells into an extended potential blastoid. Dev Cell. 51 (6), 698-712.e8 (2019).
- Yang, M., et al. Chemical-induced chromatin remodeling reprograms mouse ESCs to totipotent-like stem cells. Cell Stem Cell. 29 (3), 400-418.e13 (2022).
- Xu, Y., et al. Derivation of totipotent-like stem cells with blastocyst-like structure forming potential. Cell Res. 32 (6), 513-529 (2022).
- Seong, J., et al. Epiblast inducers capture mouse trophectoderm stem cells in vitro and pattern blastoids for implantation in utero. Cell Stem Cell. 29 (7), 1102-1118.e8 (2022).
- Vrij, E. J., et al. A pendulum of induction between the epiblast and extraembryonic endoderm supports post-implantation progression. Development. 149 (20), dev192310 (2022).
- Li, H., et al. In vitro generation of mouse morula-like cells. Dev Cell. 58 (22), 2510-2527.e7 (2023).
- Zhang, P., et al. Highly efficient generation of blastocyst-like structures from spliceosome-repressed mouse totipotent blastomere-like cells. Sci China Life Sci. 66 (3), 423-435 (2023).
- Liu, K., et al. Bilineage embryo-like structure from EPS cells can produce live mice with tetraploid trophectoderm. Protein Cell. 14 (4), 262-278 (2023).
- Linneberg-Agerholm, M., et al. The primitive endoderm supports lineage plasticity to enable regulative development. Cell. 187 (15), 4010-4029.e16 (2024).
- Wu, B., et al. Blastoids generated purely from embryonic stem cells both in mice and humans. Sci China Life Sci. 67 (2), 418-420 (2024).
- Wong, K. W., et al. Nuclear receptor–SINE B1 network modulates expanded pluripotency in blastoids and blastocysts. Nat Commun. 15 (1), 1-21 (2024).
- Peng, B., et al. Mouse totipotent blastomere-like cells model embryogenesis from zygotic genome activation to post-implantation. Cell Stem Cell. 32 (3), 391-408.e11 (2025).
- Li, H., et al. A complete model of mouse embryogenesis through organogenesis enabled by chemically induced embryo founder cells. Cell. 188 (21), 5912-5930.e20 (2025).
- Artus, J., Piliszek, A., Hadjantonakis, A. K. The primitive endoderm lineage of the mouse blastocyst: sequential transcription factor activation and regulation of differentiation by Sox17. Dev Biol. 350 (2), 393-404 (2011).
- Moore, R., Tao, W., Smith, E. R., Xu, X. X. The primitive endoderm segregates from the epiblast in β1 integrin-deficient early mouse embryos. Mol Cell Biol. 34 (3), 560-572 (2014).
- Yang, D. H., et al. Disabled-2 is essential for endodermal cell positioning and structure formation during mouse embryogenesis. Dev Biol. 251 (1), 27-44 (2002).
- Smyth, N., et al. Absence of basement membranes after targeting the LAMC1 gene results in embryonic lethality due to failure of endoderm differentiation. J Cell Biol. 144 (1), 151-160 (1999).
- Niakan, K. K., et al. Sox17 promotes differentiation in mouse embryonic stem cells by directly regulating extraembryonic gene expression and indirectly antagonizing self-renewal. Genes Dev. 24 (3), 312-326 (2010).
- Shirai, T., et al. Identification of an enhancer that controls up-regulation of fibronectin during differentiation of embryonic stem cells into extraembryonic endoderm. J Biol Chem. 280 (8), 7244-7252 (2005).
- Amadei, G., et al. Inducible stem-cell-derived embryos capture mouse morphogenetic events in vitro. Dev Cell. 56 (3), 366-382.e9 (2021).
- Amadei, G., et al. Embryo model completes gastrulation to neurulation and organogenesis. Nature. 610 (7930), 143-153 (2022).
- Lau, K. Y. C., et al. Mouse embryo model derived exclusively from embryonic stem cells undergoes neurulation and heart development. Cell Stem Cell. 29 (10), 1445-1458.e8 (2022).
- Tarazi, S., et al. Post-gastrulation synthetic embryos generated ex utero from mouse naive ESCs. Cell. 185 (18), 3290-3306.e25 (2022).
- Fabro, S., Sieber, S. M. Caffeine and nicotine penetrate the pre-implantation blastocyst. Nature. 223 (5204), 410-411 (1969).
- McLachlan, J. A., Dames, N. M., Sieber, S. M., Fabro, S. M. Accumulation of nicotine in the uterine fluid of the six-day pregnant rabbit. Fertil Steril. 27 (10), 1204-1213 (1976).
- Kamimori, G. H., et al. The rate of absorption and relative bioavailability of caffeine administered in chewing gum versus capsules. Int J Pharm. 234 (1-2), 159-167 (2002).
- Russell, M. A. H., Jarvis, M., Iyer, R., Feyerabend, C. Relation of nicotine yield of cigarettes to blood nicotine concentrations in smokers. Br Med J. 280 (6219), 972 (1980).
- Hughes, K., et al. Drinking behaviours and blood alcohol concentration in four European environments: a cross-sectional study. BMC Public Health. 11, 918 (2011).
- Colombo, J. P., et al. Effect of different protein diets on amino acid distribution in plasma, liver, and brain in the rat. Ann Nutr Metab. 36 (1), 23-33 (1992).
- Eckert, J. J., et al. Metabolic induction and early responses of mouse blastocyst programming following maternal low protein diet. PLoS One. 7 (12), e52791 (2012).
- Guo, F., et al. High-efficiency generation of blastoids with gastrulation potential through Gata4-induced PrE specification in mESCs. Cell Discov. 11 (1), 94 (2025).
Reprints and Permissions
This article has been published
Video Coming Soon