This prospective study compared 8-week outcomes in adolescents and adults with major depressive disorder. Although both groups improved, adults showed higher remission and overall effectiveness rates, while poorer interpersonal functioning and lower social support were associated with less favorable prognosis, particularly in adolescents.
Research Article
Short-Term Prognosis in Adolescents and Adults with Major Depressive Disorder and Associated Psychosocial Factors: A Prospective Study
In This Article
Summary
Abstract
This prospective study examined whether short-term treatment outcomes differ between adolescents and adults with major depressive disorder (MDD) and evaluated the contribution of psychosocial factors to these differences. Adolescents and adults receiving treatment in the Department of Psychiatry were consecutively recruited between June 2023 and December 2024, including 115 adolescents (64.61%) and 63 adults (35.39%) in the final week-8 analysis set. Depressive symptom severity was assessed using the 24-item Hamilton Depression Rating Scale (HAMD-24). Anhedonia, sleep quality, interpersonal functioning, and social support were evaluated using the Snaith-Hamilton Pleasure Scale (SHAPS), the Pittsburgh Sleep Quality Index (PSQI), the Interpersonal Relationship Scale (IRS), and the Social Support Rating Scale (SSRS), respectively. Assessments were completed at baseline and at 2, 4, and 8 weeks after treatment initiation. At baseline, the two groups differed in educational attainment and illness duration (P < 0.05), whereas HAMD-24 scores were comparable. Sleep-related measures showed limited between-group differences, but adolescents reported more severe anhedonia, poorer interpersonal functioning, and lower social support than adults (P < 0.05). After 8 weeks of treatment, HAMD-24 scores decreased significantly in both groups, but adults achieved higher remission and overall effectiveness rates than adolescents (P < 0.001). In both age groups, poorer interpersonal functioning and lower social support were associated with less favorable prognosis, with stronger associations observed in adolescents. These findings suggest that psychosocial disadvantage may weigh more heavily on short-term treatment outcomes in adolescent MDD. Interventions that strengthen interpersonal functioning and social support may therefore be particularly relevant for improving prognosis in this population.
Introduction
Depression is one of the most widespread mental health disorders worldwide. Estimates from the World Health Organization indicate that it affects roughly 5% of people globally1. Major depressive disorder (MDD), a severe depressive syndrome, is one of the leading causes of disability worldwide and affects individuals across the life span2. According to the Diagnostic and Statistical Manual of Mental Disorders, Fifth Edition (DSM-5), MDD is characterized by depressive episodes accompanied by clinically significant functional impairment3. Clinically, it is often marked by persistent low mood, diminished interest or pleasure, and anhedonia and is associated with recurrence, elevated suicide risk, cognitive impairment, and substantial functional burden4.
Accumulating evidence suggests that age is meaningfully associated with depressive symptom expression, psychosocial burden, and treatment-related outcomes5. Patients at different developmental stages may present distinct symptom profiles and show differential responses to treatment6. Adolescence is a particularly sensitive developmental period marked by rapid biological maturation together with major psychological and social transitions7. During this stage, vulnerability to psychiatric disorders and maladaptive behaviors increases, and depression is among the most common mental health conditions8. Epidemiological studies indicate that adolescent depression has become increasingly prominent in recent years9. Although adolescents may exhibit core depressive symptoms similar to those seen in adults, their clinical presentation is often more heterogeneous, which may complicate timely recognition and diagnosis10. Adolescent depression is also associated with increased suicide risk, impaired social and academic functioning, and adverse health consequences that may persist into adulthood11.
In China, depressive disorders represent a substantial and growing public health burden across both adolescent and adult populations12. Despite broader use of pharmacological and psychotherapeutic interventions, short-term treatment outcomes remain unsatisfactory in a considerable proportion of patients, particularly among adolescents13. At the same time, emerging evidence suggests meaningful differences between adolescent and adult patients in symptom expression, psychosocial functioning, and clinical trajectory14. Interpersonal functioning and social support are especially relevant in this context because both are closely linked to illness course, coping behavior, and treatment response in depressive disorders15. Clarifying whether prognosis differs between adolescents and adults with MDD, and identifying the psychosocial factors associated with these differences, may help refine age-sensitive treatment strategies and improve short-term clinical management16.
Protocol
Research patients and ethics
This prospective study consecutively recruited adolescents and adults diagnosed with major depressive disorder (MDD) who received treatment in the Department of Psychiatry between June 2023 and December 2024. Before enrollment, the study aims, procedures, and follow-up schedule were explained to potential participants and, when applicable, to their legal guardians. Written informed consent was obtained from all participants or their legal guardians before study participation. The study protocol was reviewed and approved by the Medical Ethics Committee of Huai’an Third People’s Hospital (Approval No. 2021-02). Eligibility also required that each participant was able to complete the full assessment battery, including the 24-item Hamilton Depression Rating Scale (HAMD-24)17, the Snaith-Hamilton Pleasure Scale (SHAPS)18, the Pittsburgh Sleep Quality Index (PSQI)19, the Interpersonal Relationship Scale (IRS)20, and the Social Support Rating Scale (SSRS)21.
Patient screening
Participants were screened consecutively during the recruitment period, and eligibility was confirmed on the basis of age and clinical diagnosis. Patients aged 12–18 years were assigned to the adolescent group, and those aged 19–65 years were assigned to the adult group, provided that both groups met the diagnostic criteria for MDD. This grouping strategy was predefined to compare two clinically meaningful developmental groups with distinct psychosocial and clinical contexts. Diagnosis was established by experienced psychiatrists according to DSM-522 and was further verified using the Structured Clinical Interview for DSM Disorders (SCID-I/P)23. Exclusion criteria included brain injury or organic brain disease, a history of substance abuse, psychiatric disorders other than MDD, severe somatic or neurological disease, and pregnancy or breastfeeding. Psychiatric comorbidities were excluded to reduce diagnostic heterogeneity and to improve interpretability of the age-group comparison; this design choice is addressed further in the Discussion as a study limitation.
Treatment initiation and real-world treatment documentation
After the baseline assessment, participants received routine clinician-directed treatment in the department. Antidepressant pharmacotherapy was initiated when clinically indicated and was adjusted during follow-up according to symptom severity, tolerability, and clinical judgment. In routine care, commonly used antidepressant classes included selective serotonin reuptake inhibitors, serotonin-norepinephrine reuptake inhibitors, noradrenergic and specific serotonergic antidepressants, and other guideline-consistent agents selected by the treating psychiatrist24. When clinically necessary, short-term concomitant medication for insomnia or acute anxiety or agitation was also permitted.
Non-pharmacological interventions, including supportive counseling and psychotherapy, could also be provided in routine care. However, because the content, frequency, timing, and continuity of these interventions were not standardized across participants during the observational follow-up period, the present study focused primarily on the pharmacotherapy-centered real-world treatment trajectory. Exposure to adjunctive non-pharmacological treatment was documented when available and was considered in the interpretation of the findings as a potential source of treatment heterogeneity.
To improve transparency and reduce bias arising from treatment heterogeneity, treatment exposure was documented prospectively at baseline and at each follow-up visit. Documentation included whether antidepressant medication was initiated, the overall treatment strategy, including monotherapy versus combination or augmentation, any dose adjustment, switching, or add-on medication during the 8-week period, the use of hypnotic or anxiolytic co-medication, and the timing of these treatment changes. Treatment adherence was recorded on the basis of routine clinical records together with participant report.
Clinical symptoms and psychosocial factors assessment
At baseline, before treatment initiation, depressive symptom severity was assessed using the HAMD-24. During the same assessment session, anhedonia was evaluated using the SHAPS, sleep quality was assessed using the PSQI, interpersonal functioning was assessed using the IRS, and social support was characterized using the SSRS, including objective support, subjective support, and support utilization.
The full assessment battery was repeated at weeks 2, 4, and 8 after treatment initiation. Follow-up assessments were conducted in person during outpatient visits whenever possible. If an in-person assessment could not be completed within the predefined time window, follow-up was completed through structured remote contact combined with standardized questionnaire completion. The HAMD-24 was administered by trained psychiatrists or trained raters, whereas the SHAPS, PSQI, IRS, and SSRS were completed as structured self-report instruments under staff guidance or verification. To support comparability of symptom trajectories, assessment windows were kept consistent across participants. Assessors were trained in standardized administration procedures to improve consistency across visits. The study workflow, including participant enrollment, group assignment, follow-up, and analysis, is shown in Figure 1.
Efficacy assessment
Treatment response was evaluated at week 8 on the basis of the HAMD-24 score reduction rate relative to baseline. The reduction rate was calculated as (baseline HAMD-24 score − week 8 HAMD-24 score) / baseline HAMD-24 score × 100%. Outcomes were classified as remission for a reduction rate of at least 75%, marked response for a reduction rate of 50%-74%, response for a reduction rate of 25%-49%, and non-response for a reduction rate below 25%. The overall effectiveness rate was defined as the proportion of participants who achieved at least a 25% reduction, including remission, marked response, and response, among all participants included in the final week-8 analysis set. Because these categories were operational definitions based on percentage reduction in HAMD-24 score, the remission category was interpreted as a predefined efficacy classification within the present study framework rather than as syndromal remission.
Statistical analysis
Statistical analyses were conducted using appropriate analytical software25. Data with an approximately normal distribution are reported as mean ± standard deviation, whereas skewed variables are presented as median with interquartile range (Q1, Q3). Categorical data are expressed as counts and percentages. Comparisons of baseline demographic and clinical variables between adolescent and adult groups were performed using independent-samples t-tests for normally distributed variables and nonparametric rank-sum tests for skewed variables. Group differences in categorical variables were evaluated using χ2 tests or Fisher’s exact tests when appropriate.
For longitudinal symptom outcomes, including HAMD-24, SHAPS, and PSQI scores, changes over time were evaluated using a repeated-measures framework that accounted for within-subject correlation. Linear mixed-effects models or generalized estimating equations were applied, where appropriate, to estimate group differences in symptom trajectories, with time, group, and the time × group interaction specified as key terms26. Time was defined as baseline, week 2, week 4, and week 8, and group was defined as adolescent versus adult. Model-based estimates were reported with 95% confidence intervals and two-sided P values. Where post hoc comparisons were performed, multiple-comparison control was applied using Bonferroni-adjusted significance thresholds27. A significant time × group interaction was interpreted as evidence of differential improvement patterns between age groups.
To address potential confounding, adjusted analyses included prespecified covariates such as sex, education level or years of education, illness duration, baseline symptom severity, first-episode versus recurrent status when available, and key treatment exposure indicators recorded during follow-up, including monotherapy versus combination or augmentation, regimen changes, and hypnotic or anxiolytic co-medication where applicable. Both unadjusted and adjusted results were presented to evaluate the robustness of the findings. Week-8 response categories and overall effectiveness rate were compared between groups using χ2 tests, and regression-based analyses were performed when adjusted estimates were required28.
Associations between psychosocial factors and treatment response were examined using baseline IRS and SSRS measures as predictor variables and the week-8 HAMD-24 reduction rate as the outcome variable. Pearson or Spearman correlation analyses were used according to variable distribution, and multivariable models were applied when adjustment for relevant covariates was required29. Correlation outputs were labeled explicitly as correlation coefficients to avoid ambiguity between correlation-based and regression-based results.
Missing data and follow-up attrition were documented at each time point. Longitudinal analyses used all available repeated measures under standard missing-at-random assumptions30. For week-8 efficacy classification, the analysis set was defined according to the availability of week-8 outcome data. Sensitivity analyses were considered when missingness was non-negligible. Statistical significance was interpreted using a two-sided P value of <0.05.
Results
Participant enrollment and baseline characteristics
A total of 185 participants with major depressive disorder (MDD) were enrolled, including 120 adolescents and 65 adults. During follow-up, 5 adolescents and 2 adults did not complete the week-8 post-treatment assessment and were therefore excluded from the final week-8 efficacy classification analysis. The final week-8 analysis set included 178 participants, comprising 115 adolescents (64.61%) and 63 adults (35.39%). The study workflow and participant flow are shown in Figure 1.
Table 1 presents the baseline demographic and clinical characteristics. Compared with adults, adolescents had fewer years of education (9.25 ± 2.32 vs. 14.46 ± 2.54; t = -13.42, P < 0.001) and a shorter illness duration (21.68 ± 21.98 vs. 36.31 ± 49.21 months; Z = -2.02, P = 0.043). Sex distribution was comparable between groups (male: 34/115 vs. 23/63; χ² = 1.55, P = 0.213), and prior treatment status at first presentation also did not differ significantly (first presentation without prior treatment: 83/115 vs. 41/63; χ² = 0.42, P = 0.516).
Baseline symptom and psychosocial profiles
Baseline symptom and psychosocial measures are presented in Table 2. Depressive symptom severity, assessed using the 24-item Hamilton Depression Rating Scale (HAMD-24), was comparable between adolescents and adults at baseline (44.12 ± 4.35 vs. 45.22 ± 4.01; t = -0.54, P = 0.591). Sleep quality, assessed using the Pittsburgh Sleep Quality Index (PSQI), also showed no significant between-group difference in total score (12.01 ± 4.12 vs. 12.87 ± 4.42; t = -1.26, P = 0.210). Most PSQI subdomains were likewise comparable, including subjective sleep quality (Z = -1.87, P = 0.062), sleep duration (Z = -1.65, P = 0.098), sleep latency (Z = -0.65, P = 0.514), sleep disturbances (Z = -0.51, P = 0.610), and daytime dysfunction (Z = -0.39, P = 0.699).
In contrast, adolescents showed significantly greater anhedonia than adults, with higher total scores on the Snaith-Hamilton Pleasure Scale (SHAPS) (33.87 ± 8.37 vs. 30.43 ± 9.13; t = 2.99, P = 0.003). The difference was evident in both the social/feeling domain (14.12 ± 4.10 vs. 12.86 ± 4.09; t = 2.79, P = 0.006) and the interest/diet domain (18.96 ± 4.85 vs. 17.44 ± 5.61; t = 2.49, P = 0.014).
Adolescents also demonstrated poorer interpersonal functioning on the Interpersonal Relationship Scale (IRS), with higher scores for communication (5.01 ± 1.34 vs. 4.58 ± 1.65; t = 2.50, P = 0.013), social interaction (6.26 ± 2.01 vs. 4.99 ± 1.89; t = 2.80, P = 0.006), and handling interpersonal relationships (3.98 ± 0.98 vs. 2.54 ± 0.87; t = 11.62, P < 0.001), whereas opposite-sex communication did not differ significantly between groups (3.01 ± 0.78 vs. 2.89 ± 0.85; t = 1.28, P = 0.201). Social support, assessed using the Social Support Rating Scale (SSRS), was also lower among adolescents, including objective support (6.57 ± 2.14 vs. 7.90 ± 2.56; t = -2.16, P = 0.032), subjective support (13.65 ± 2.33 vs. 16.97 ± 2.46; t = -8.37, P < 0.001), and support utilization (5.78 ± 1.37 vs. 6.89 ± 1.89; t = -4.05, P < 0.001).
Longitudinal symptom changes
Longitudinal symptom outcomes are summarized in Table 3 and illustrated for HAMD-24 in Figure 2. HAMD-24 scores decreased substantially in both groups over the 8-week treatment period. Although baseline HAMD-24 scores were comparable between adolescents and adults (44.12 ± 4.35 vs. 45.22 ± 4.01; P = 0.591), adults showed lower HAMD-24 scores than adolescents at each follow-up time point, indicating greater short-term symptom improvement: week 2 (21.77 ± 3.02 vs. 28.67 ± 3.26; t = 13.58, P < 0.001), week 4 (12.77 ± 2.02 vs. 16.64 ± 2.65; t = 10.52, P < 0.001), and week 8 (9.86 ± 1.34 vs. 14.01 ± 1.62; t = 17.41, P < 0.001).
In the repeated-measures analysis for HAMD-24, there was a significant main effect of time (F = 862.47, P < 0.001), a significant main effect of group (F = 74.26, P < 0.001), and a significant time × group interaction (F = 39.18, P < 0.001), indicating that symptom trajectories differed significantly between adolescents and adults. In the adjusted mixed-effects model controlling for sex, years of education, illness duration, baseline HAMD-24 score, prior treatment status, and major treatment exposure indicators, the time × group interaction remained significant (β = -1.84, 95% CI: -2.31 to -1.37, P < 0.001).
Comparable longitudinal patterns were observed for SHAPS and PSQI. For SHAPS, there was a significant main effect of time (F = 211.35, P < 0.001), a significant main effect of group (F = 9.84, P = 0.002), and a significant time × group interaction (F = 8.92, P < 0.001), indicating greater reduction in anhedonia among adults. For PSQI, the main effect of time was significant (F = 95.64, P < 0.001), whereas the main effect of group was not significant (F = 2.21, P = 0.139); however, the time × group interaction remained significant (F = 4.11, P = 0.008), suggesting modest between-group differences in the improvement of sleep-related symptoms.
Follow-up completion and missing data
Follow-up completion remained high across the 8-week observation period. Assessment data were available for 118 of 120 adolescents (98.3%) and 64 of 65 adults (98.5%) at week 2, for 117 of 120 adolescents (97.5%) and 64 of 65 adults (98.5%) at week 4, and for 115 of 120 adolescents (95.8%) and 63 of 65 adults (96.9%) at week 8. Details are presented in Table 4.
The distribution of missing assessments by time point did not differ significantly between groups (week 2: χ² = 0.01, P = 0.934; week 4: χ² = 0.10, P = 0.749; week 8: χ² = 0.09, P = 0.762). Participants with missing week-8 outcome data were excluded from the final efficacy classification analysis, whereas longitudinal symptom analyses used all available repeated measures under the prespecified missing-at-random assumption.
Week-8 treatment effectiveness
Week-8 response categories based on the HAMD-24 reduction rate are shown in Table 5. Adults achieved a higher remission rate than adolescents (28/63 [44.44%] vs. 36/115 [31.30%]) and a higher overall effectiveness rate (55/63 [87.30%] vs. 88/115 [76.52%]). The distribution of response categories differed significantly between groups (χ² = 14.62, P = 0.002), and the between-group difference in overall effectiveness was also statistically significant (χ² = 11.87, P < 0.001), indicating less favorable short-term treatment outcomes among adolescents during the 8-week observation period.
In an adjusted logistic regression model using overall effectiveness at week 8 as the dependent variable, adult group membership remained significantly associated with a higher likelihood of treatment effectiveness after adjustment for sex, years of education, illness duration, baseline HAMD-24 score, prior treatment status, and major treatment exposure variables (OR = 2.41, 95% CI: 1.28-4.56, P = 0.006).
Associations between baseline psychosocial factors and prognosis
Associations between psychosocial factors and treatment response are summarized in Table 6. In these analyses, baseline IRS and SSRS measures were examined in relation to the week-8 HAMD-24 reduction rate. Correlation analyses showed that in both adolescents and adults, poorer interpersonal functioning, reflected by higher IRS scores, was associated with a lower HAMD-24 reduction rate, whereas stronger social support, reflected by higher SSRS scores, was associated with a higher reduction rate.
Among adolescents, IRS communication (r = -0.18, P = 0.009), IRS social interaction (r = -0.24, P = 0.002), and IRS handling interpersonal relationships (r = -0.31, P < 0.001) were negatively associated with the reduction rate. By contrast, SSRS objective support (r = 0.16, P = 0.014), SSRS subjective support (r = 0.27, P < 0.001), and SSRS support utilization (r = 0.28, P < 0.001) were positively associated with the reduction rate.
Among adults, the same overall direction of association was observed, although effect sizes were smaller. IRS communication (r = -0.11, P = 0.041), IRS social interaction (r = -0.12, P = 0.036), and IRS handling interpersonal relationships (r = -0.19, P = 0.008) were negatively associated with the reduction rate. SSRS subjective support (r = 0.16, P = 0.018) and SSRS support utilization (r = 0.17, P = 0.015) were positively associated with the reduction rate, whereas the association with objective support was weaker and did not reach statistical significance (r = 0.09, P = 0.127).
In multivariable linear regression analyses adjusted for sex, years of education, illness duration, baseline HAMD-24 score, prior treatment status, and major treatment exposure indicators, the pattern remained similar. In adolescents, lower reduction rates were independently associated with poorer IRS communication (β = -0.18, 95% CI: -2.94 to -0.41, P = 0.009), IRS social interaction (β = -0.24, 95% CI: -3.48 to -0.96, P = 0.002), and IRS handling interpersonal relationships (β = -0.31, 95% CI: -5.12 to -1.84, P < 0.001), whereas higher reduction rates were associated with greater SSRS objective support (β = 0.16, 95% CI: 0.21 to 1.74, P = 0.014), SSRS subjective support (β = 0.27, 95% CI: 0.68 to 2.11, P < 0.001), and SSRS support utilization (β = 0.28, 95% CI: 0.93 to 3.06, P < 0.001).
Among adults, poorer IRS communication (β = -0.11, 95% CI: -2.41 to -0.08, P = 0.041), IRS social interaction (β = -0.12, 95% CI: -2.67 to -0.11, P = 0.036), and IRS handling interpersonal relationships (β = -0.19, 95% CI: -4.33 to -0.72, P = 0.008) were independently associated with lower reduction rates. Higher reduction rates were associated with greater SSRS subjective support (β = 0.16, 95% CI: 0.12 to 1.56, P = 0.018) and SSRS support utilization (β = 0.17, 95% CI: 0.19 to 2.03, P = 0.015), whereas the association with objective support did not remain statistically significant after adjustment (β = 0.09, 95% CI: -0.08 to 1.21, P = 0.127).
Overall, psychosocial factors appeared to have stronger associations with short-term prognosis in adolescents than in adults, particularly for interpersonal social interaction and for subjective support and support utilization.
Data Availability
The data generated and analyzed in this study are publicly available in figshare: Liu, Pan; Wu, Lili; Hu, Yuan; Ma, Changfeng; Lin, Xiaofang (2026). Prognosis Differences Between Adolescents and Adults With Major Depressive Disorder and Associated Influencing Factors: A Prospective Study. figshare. Dataset. https://doi.org/10.6084/m9.figshare.31901791.v1.
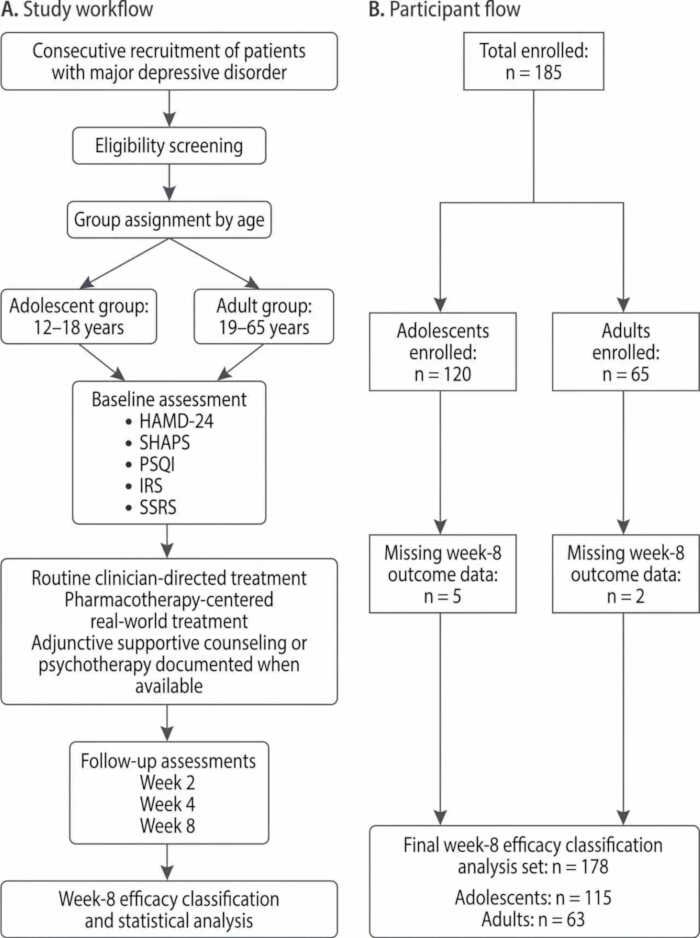
Figure 1: Study workflow and participant flow. (A) Study workflow. Participants with major depressive disorder were consecutively recruited and assigned to the adolescent or adult group according to age. Baseline assessment included depressive symptom severity, anhedonia, sleep quality, interpersonal functioning, and social support. Follow-up assessments were conducted at weeks 2, 4, and 8 after treatment initiation. (B) Participant flow. A total of 185 participants were enrolled, including 120 adolescents and 65 adults. At week 8, five adolescents and two adults had missing outcome data and were excluded from the final efficacy classification analysis. Please click here to view a larger version of this figure.
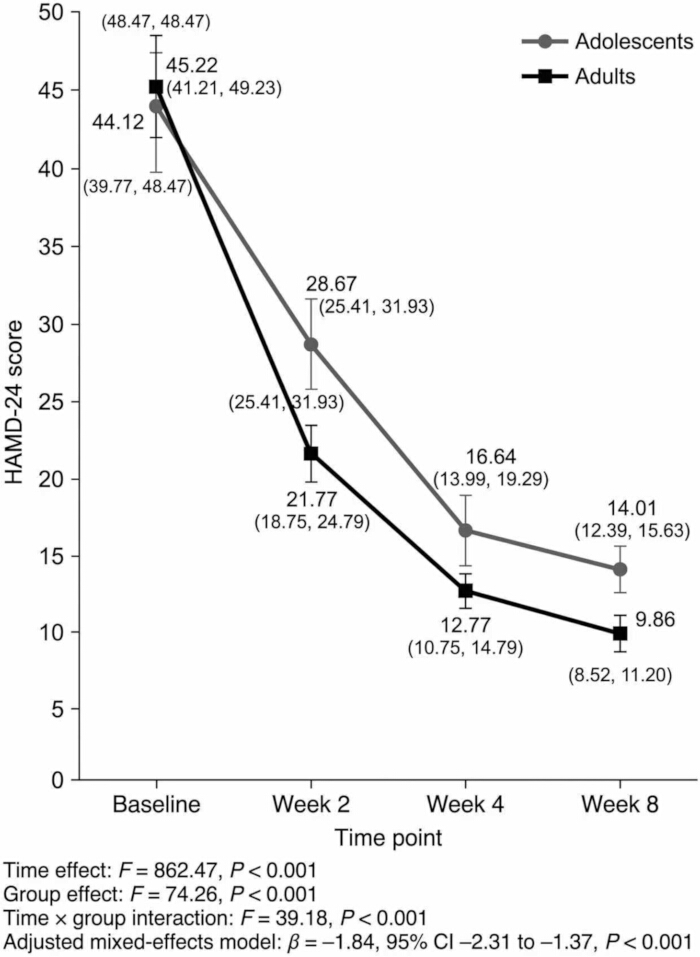
Figure 2: Longitudinal changes in HAMD-24 scores in adolescents and adults with major depressive disorder. Mean HAMD-24 scores in adolescents and adults at baseline and at weeks 2, 4, and 8 after treatment initiation. HAMD-24 scores declined in both groups over time, but adults showed lower scores at each follow-up visit. The repeated-measures analysis showed significant effects of time and group, as well as a significant time × group interaction, indicating different symptom trajectories between adolescents and adults. Data are presented as mean ± SD. Please click here to view a larger version of this figure.
| Variable | Adolescents | Adults | Statistic | P value |
| Age, years | 15.35 ± 2.56 | 30.67 ± 9.23 | — | — |
| Male, n (%) | 34 (29.57) | 23 (36.51) | χ² = 1.55 | 0.213 |
| Female, n (%) | 81 (70.43) | 40 (63.49) | ||
| Educational attainment, years | 9.25 ± 2.32 | 14.46 ± 2.54 | t = -13.42 | <0.001 |
| Illness duration, months | 21.68 ± 21.98 | 36.31 ± 49.21 | Z = -2.02 | 0.043 |
| First presentation without prior treatment, n (%) | 83 (72.17) | 41 (65.08) | χ² = 0.42 | 0.516 |
| Prior treatment before presentation, n (%) | 32 (27.83) | 22 (34.92) |
Table 1: Baseline demographic and clinical characteristics of adolescents and adults with major depressive disorder. Continuous variables are reported as mean ± standard deviation, whereas categorical variables are expressed as counts and percentages. Group comparisons were conducted using independent-samples t tests, χ2 tests, or rank-sum tests, as appropriate.
| Variable | Adolescents (n = 115) | Adults (n = 63) | Statistic | P value |
| HAMD-24 total score | 44.12 ± 4.35 | 45.22 ± 4.01 | t = -0.54 | 0.591 |
| PSQI total score | 12.01 ± 4.12 | 12.87 ± 4.42 | t = -1.26 | 0.21 |
| SHAPS total score | 33.87 ± 8.37 | 30.43 ± 9.13 | t = 2.99 | 0.003 |
| SHAPS social/feeling domain | 14.12 ± 4.10 | 12.86 ± 4.09 | t = 2.79 | 0.006 |
| SHAPS interest/diet domain | 18.96 ± 4.85 | 17.44 ± 5.61 | t = 2.49 | 0.014 |
| IRS communication | 5.01 ± 1.34 | 4.58 ± 1.65 | t = 2.50 | 0.013 |
| IRS social interaction | 6.26 ± 2.01 | 4.99 ± 1.89 | t = 2.80 | 0.006 |
| IRS handling interpersonal relationships | 3.98 ± 0.98 | 2.54 ± 0.87 | t = 11.62 | <0.001 |
| IRS opposite-sex communication | 3.01 ± 0.78 | 2.89 ± 0.85 | t = 1.28 | 0.201 |
| SSRS objective support | 6.57 ± 2.14 | 7.90 ± 2.56 | t = -2.16 | 0.032 |
| SSRS subjective support | 13.65 ± 2.33 | 16.97 ± 2.46 | t = -8.37 | <0.001 |
| SSRS support utilization | 5.78 ± 1.37 | 6.89 ± 1.89 | t = -4.05 | <0.001 |
| PSQI subdomain | Statistic | P value | ||
| Subjective sleep quality | Z = -1.87 | 0.062 | ||
| Sleep duration | Z = -1.65 | 0.098 | ||
| Sleep latency | Z = -0.65 | 0.514 | ||
| Sleep disturbances | Z = -0.51 | 0.61 | ||
| Daytime dysfunction | Z = -0.39 | 0.699 |
Table 2: Baseline symptom and psychosocial measures in adolescents and adults with major depressive disorder. Baseline scale scores, including HAMD-24, PSQI, SHAPS, IRS, and SSRS measures. HAMD-24, 24-item Hamilton Depression Rating Scale; PSQI, Pittsburgh Sleep Quality Index; SHAPS, Snaith-Hamilton Pleasure Scale; IRS, Interpersonal Relationship Scale; SSRS, Social Support Rating Scale. Data are presented as mean ± SD. Additional baseline comparisons of PSQI subdomains, including subjective sleep quality, sleep duration, sleep latency, sleep disturbances, and daytime dysfunction. Statistics are presented as rank-sum test results with corresponding P values.
| Time point | Adolescents | Adults | Statistic | P value |
| Baseline | 44.12 ± 4.35 | 45.22 ± 4.01 | t = -0.54 | 0.591 |
| Week 2 | 28.67 ± 3.26 | 21.77 ± 3.02 | t = 13.58 | <0.001 |
| Week 4 | 16.64 ± 2.65 | 12.77 ± 2.02 | t = 10.52 | <0.001 |
| Week 8 | 14.01 ± 1.62 | 9.86 ± 1.34 | t = 17.41 | <0.001 |
| Outcome | Time effect | Group effect | Time × group interaction | Interpretation |
| HAMD-24 | F = 862.47, P < 0.001 | F = 74.26, P < 0.001 | F = 39.18, P < 0.001 | Symptom trajectories differed significantly between groups |
| HAMD-24, adjusted mixed-effects model | — | — | β = -1.84, 95% CI: -2.31 to -1.37, P < 0.001 | Time × group interaction remained significant after adjustment |
| SHAPS | F = 211.35, P < 0.001 | F = 9.84, P = 0.002 | F = 8.92, P < 0.001 | Greater reduction in anhedonia among adults |
| PSQI | F = 95.64, P < 0.001 | F = 2.21, P = 0.139 | F = 4.11, P = 0.008 | Modest between-group differences in improvement of sleep-related symptoms |
Table 3: Longitudinal symptom outcomes during the 8-week follow-up. HAMD-24 scores in adolescents and adults at baseline and at weeks 2, 4, and 8 after treatment initiation. Data are presented as mean ± SD, with between-group comparisons shown for each time point. Repeated-measures model summary for longitudinal symptom outcomes. Statistics are provided for the main effects of time and group and for the time × group interaction. For HAMD-24, the adjusted mixed-effects model result for the time × group interaction is also presented.
| Time point | Adolescents available / total (%) | Adults available / total (%) | Between-group comparison |
| Week 2 | 118/120 (98.3) | 64/65 (98.5) | χ² = 0.01, P = 0.934 |
| Week 4 | 117/120 (97.5) | 64/65 (98.5) | χ² = 0.10, P = 0.749 |
| Week 8 | 115/120 (95.8) | 63/65 (96.9) | χ² = 0.09, P = 0.762 |
Table 4: Follow-up completion and missing data by time point. Values are presented as the number of participants with available assessment data at each study visit, with percentages shown in parentheses. Participants with missing week-8 outcome data were excluded from the final efficacy classification analysis, whereas longitudinal symptom analyses used all available repeated measures.
| Response Category | Adolescents | Adults |
| n (%) | n (%) | |
| Remission (≥75%) | 36 (31.30) | 28 (44.44) |
| Marked response (50%–74%) | 25 (21.74) | 23 (36.51) |
| Response (25%–49%) | 27 (23.48) | 4 (6.35) |
| Non-response (<25%) | 27 (23.48) | 8 (12.70) |
| Overall effectiveness (≥25%) | 88 (76.52) | 55 (87.30) |
Table 5: Week-8 treatment effectiveness based on HAMD-24 reduction rate. Response categories were defined according to the percentage reduction in HAMD-24 score at week 8 relative to baseline: remission (≥75%), marked response (50%–74%), response (25%–49%), and non-response (<25%). Overall effectiveness was defined as a reduction rate of at least 25%. Data are presented as n (%).
| Predictor | Correlation coefficient (r) | P value | Adjusted β | 95% CI | P value |
| IRS communication | -0.18 | 0.009 | -0.18 | -2.94 to -0.41 | 0.009 |
| IRS social interaction | -0.24 | 0.002 | -0.24 | -3.48 to -0.96 | 0.002 |
| IRS handling interpersonal relationships | -0.31 | <0.001 | -0.31 | -5.12 to -1.84 | <0.001 |
| SSRS objective support | 0.16 | 0.014 | 0.16 | 0.21 to 1.74 | 0.014 |
| SSRS subjective support | 0.27 | <0.001 | 0.27 | 0.68 to 2.11 | <0.001 |
| SSRS support utilization | 0.28 | <0.001 | 0.28 | 0.93 to 3.06 | <0.001 |
| Predictor | Correlation coefficient (r) | P value | Adjusted β | 95% CI | P value |
| IRS communication | -0.11 | 0.041 | -0.11 | -2.41 to -0.08 | 0.041 |
| IRS social interaction | -0.12 | 0.036 | -0.12 | -2.67 to -0.11 | 0.036 |
| IRS handling interpersonal relationships | -0.19 | 0.008 | -0.19 | -4.33 to -0.72 | 0.008 |
| SSRS objective support | 0.09 | 0.127 | 0.09 | -0.08 to 1.21 | 0.127 |
| SSRS subjective support | 0.16 | 0.018 | 0.16 | 0.12 to 1.56 | 0.018 |
| SSRS support utilization | 0.17 | 0.015 | 0.17 | 0.19 to 2.03 | 0.015 |
Table 6: Associations between baseline psychosocial factors and week-8 HAMD-24 reduction rate. Associations in adolescents. Unadjusted correlation coefficients are shown together with multivariable linear regression results. Associations in adults. Unadjusted correlation coefficients are shown together with multivariable linear regression results. The dependent variable in the regression analyses was the week-8 HAMD-24 reduction rate. Adjusted models included sex, years of education, illness duration, baseline HAMD-24 score, prior treatment status, and major treatment exposure indicators.
Discussion
This prospective study compared short-term treatment trajectories between adolescents and adults with major depressive disorder and examined whether psychosocial factors were differentially associated with prognosis across age groups. Both groups showed meaningful clinical improvement during the 8-week follow-up period, but adults demonstrated a more favorable symptom trajectory, a higher remission rate, and a higher overall effectiveness rate than adolescents. Baseline sleep quality did not differ significantly between groups, whereas adolescents showed more severe anhedonia, poorer interpersonal functioning, and lower social support. Taken together, these findings suggest that age-related differences in this cohort were less evident for sleep-related symptoms but more pronounced for hedonic capacity and psychosocial context. One possible explanation for the limited baseline sleep difference is the clinical composition of the sample. In routine practice, adolescents are often more likely to present with first-episode depression, whereas adult samples may include a larger proportion of recurrent cases31. In the present cohort, first-episode presentations accounted for the majority in both groups, which may have reduced expected age-related differences in sleep-related symptoms. Recurrent illness and prior treatment exposure may also contribute to more complex symptom expression and altered treatment responsiveness32.
The between-group differences in anhedonia and psychosocial functioning were clinically important. Adolescents had higher SHAPS scores than adults, indicating more severe anhedonia, a pattern consistent with prior descriptions of emotional blunting in adolescent depression33. This finding is developmentally meaningful because adolescence is a period marked by rapid change in motivation, identity formation, and reward sensitivity. Under these conditions, loss of pleasure may interfere not only with emotional well-being but also with normative developmental engagement. The psychosocial findings were similarly notable. Adolescents reported poorer interpersonal functioning and lower social support, particularly in interpersonal difficulties, subjective support, and support utilization. This pattern is clinically relevant because adolescence is a developmental stage in which sensitivity to interpersonal feedback and social evaluation is heightened34. Contextual stressors such as bullying, cyberbullying, academic pressure, and social media exposure may further intensify interpersonal strain and weaken effective support systems35.
The short-term outcome results were broadly consistent with this psychosocial pattern. Although baseline HAMD-24 scores were comparable, adolescents had higher HAMD-24 scores at weeks 2, 4, and 8 and showed lower remission and overall effectiveness rates at week 8. The association analyses further supported this interpretation. In both groups, poorer interpersonal functioning was associated with a lower HAMD-24 reduction rate, whereas stronger social support was associated with better symptom improvement, and these associations were generally stronger in adolescents. This pattern suggests that psychosocial context may carry greater prognostic weight in younger patients. From a developmental perspective, adolescent functioning is embedded in parent-child relationships, peer relationships, and school-based interactions36. Peer acceptance and belonging are especially salient during this period, and poor friendship quality or interpersonal conflict may increase vulnerability to depressive persistence37. Family support is also highly relevant, with prior work showing that parental social support may buffer severe adverse outcomes in adolescents38. These findings support the clinical value of combining symptom-focused treatment with psychosocially informed care. Interpersonal psychotherapy provides one relevant framework because it aims to reduce depressive symptoms by improving social support, reducing interpersonal stress, strengthening relationships, and enhancing emotion regulation39.
Several limitations should be considered when interpreting these findings. First, the study was conducted at a single center, and local clinical practice patterns may limit generalizability. Second, follow-up was limited to 8 weeks and therefore does not capture longer-term prognosis, relapse, or sustained remission. Third, although psychosocial factors were assessed, family-level and school-level contextual variables were not examined in sufficient detail, which may have obscured more specific recovery mechanisms in adolescents. Fourth, the comparison was based on a predefined adolescent-versus-adult grouping strategy that was appropriate for the developmental question of interest but may have obscured more gradual age-related variation within adulthood. Fifth, treatment in this observational cohort was primarily routine pharmacotherapy-centered care, whereas supportive counseling and psychotherapy were not standardized across participants. Their contribution to short-term outcome heterogeneity could therefore not be modeled in detail. In addition, exclusion of psychiatric comorbidity improved diagnostic clarity but reduced representation of the more clinically mixed presentations often seen in routine practice. Further, although treatment exposure indicators were adjusted for in the analysis, the naturalistic design did not standardize treatment across groups, and outcome differences may partially reflect variation in treatment patterns.
Future research should extend this work using multi-center designs, longer follow-up periods, and richer contextual measures, particularly family functioning, peer relationship quality, school stress, and structured psychosocial intervention exposure. Modeling age as a continuous variable, or dividing adulthood into narrower strata, may also help clarify developmental gradients in prognosis. Other ways of studying the same hypothesis include trajectory-based analyses, repeated measurement of psychosocial exposures during treatment, and intervention studies designed specifically to test whether strengthening interpersonal functioning and social support improves outcomes in adolescent depression40. Overall, the present study suggests that adolescents with major depressive disorder experience a less favorable short-term treatment course than adults and that this difference is closely linked to psychosocial disadvantage. The findings support a more integrated treatment approach in adolescent MDD, in which symptom reduction is combined with active strengthening of interpersonal relationships and social support across family, school, and community contexts.
Disclosures
The authors have no conflicts of interest to declare.
Acknowledgements
Sincere appreciation is extended to all participants and their families for their time and commitment to this study. Appreciation is also extended to the clinical and research staff involved in data collection and patient care.
Materials
| Name | Company | Catalog Number | Comments |
|---|---|---|---|
| Case report form and follow-up worksheet | Locally prepared study document, Huai’an Third People’s Hospital | N/A | Used to record demographic data, treatment exposure, follow-up completion, and week-8 outcome classification. |
| Hamilton Depression Rating Scale, 24-item version (HAMD-24) interview form | Source article: Max Hamilton | DOI: 10.1136/jnnp.23.1.56 | Clinician-rated measure of depressive symptom severity; administered at baseline and follow-up visits. |
| IBM SPSS Statistics, version 23.0 | IBM | IBM SPSS Statistics product page | Statistical analysis software used for baseline comparisons, repeated-measures analyses, regression analyses, and missing-data summaries. |
| Informed consent form / parental consent form | Locally prepared IRB-approved study document, Huai’an Third People’s Hospital | N/A | Signed before enrollment by adult participants or legal guardians of minors. |
| Interpersonal Relationship Scale (IRS) questionnaire | Source article / validation source: Interpersonal Relationship Rating Scale in a Chinese population | DOI: 10.36922/jcbp.3625 | Self-report measure of interpersonal functioning, including communication, social interaction, handling interpersonal relationships, and opposite-sex communication. |
| Pittsburgh Sleep Quality Index (PSQI) instrument | Center for Sleep and Circadian Science, University of Pittsburgh | PSQI official page; PSQI instrument PDF | Self-report questionnaire assessing sleep quality over the previous month. |
| Social Support Rating Scale (SSRS) questionnaire | Original Chinese scale source: Shuiyuan Xiao | Online reference source for Xiao (1994) | Self-report measure of objective support, subjective support, and support utilization. |
| Snaith-Hamilton Pleasure Scale (SHAPS) questionnaire | Source article: Snaith et al. | DOI: 10.1192/bjp.167.1.99 | Self-report measure of anhedonia / hedonic tone. |
| Structured Clinical Interview for DSM Disorders (SCID-I/P) interview guide | Biometrics Research, New York State Psychiatric Institute / SCID information page | SCID information page; SCID-I/P reference source | Semi-structured diagnostic interview used to verify the diagnosis after psychiatrist assessment. |
References
- Depressive disorder (depression). WHO Fact Sheet Available from: https://www.who.int/news-room/fact-sheets/detail/depression (2023)
- Cui, L., et al. Major depressive disorder: hypotheses, mechanisms, prevention and treatment. Signal Transduct Target Ther. 9 (1), 30 (2024).
- Ma, F. Diagnostic and statistical manual of mental disorders-5 (DSM-5). Encyclopedia of gerontology and population aging. , 1414-1425 (2022).
- Otte, C., et al. Major depressive disorder. Nat Rev Dis Primers. 2, 16065 (2016).
- Mirowsky, J., Ross, C. E. Age and depression. J Health Soc Behav. 33, 187-205 (1992).
- Cuijpers, P., et al. Psychotherapy for depression across different age groups: a systematic review and meta-analysis. JAMA Psychiatry. 77 (7), 694-702 (2020).
- Maughan, B., Collishaw, S., Stringaris, A. Depression in childhood and adolescence. J Can Acad Child Adolesc Psychiatry. 22 (1), 35-40 (2013).
- Blakemore, S. J. Adolescence and mental health. Lancet. 393 (10185), 2030-2031 (2019).
- Wilson, S., Dumornay, N. M. Rising rates of adolescent depression in the United States: challenges and opportunities in the 2020s. J Adolesc Health. 70 (3), 354-355 (2022).
- Thapar, A., Eyre, O., Patel, V., Brent, D. Depression in young people. Lancet. 400 (10352), 617-631 (2022).
- Clayborne, Z. M., Varin, M., Colman, I. Systematic review and meta-analysis: adolescent depression and long-term psychosocial outcomes. J Am Acad Child Adolesc Psychiatry. 58 (1), 72-79 (2019).
- Zhou, J., et al. Prevalence of depressive symptoms among children and adolescents in China: a systematic review and meta-analysis. Child Adolesc Psychiatry Ment Health. 18 (1), 150 (2024).
- Mullen, S. Major depressive disorder in children and adolescents. Ment Health Clin. 8 (6), 275-283 (2018).
- Lamers, F., et al. Structure of major depressive disorder in adolescents and adults in the US general population. Br J Psychiatry. 201 (2), 143-150 (2012).
- Gunlicks-Stoessel, M., Mufson, L., Jekal, A., Turner, J. B. The impact of perceived interpersonal functioning on treatment for adolescent depression: IPT-A versus treatment as usual in school-based health clinics. J Consult Clin Psychol. 78 (2), 260-267 (2010).
- Bauer, A., et al. Mobilising social support to improve mental health for children and adolescents: a systematic review using principles of realist synthesis. PLoS One. 16 (5), e0251750 (2021).
- Hamilton, M. A rating scale for depression. J Neurol Neurosurg Psychiatry. 23 (1), 56-62 (1960).
- Snaith, R. P., et al. A scale for the assessment of hedonic tone: the Snaith-Hamilton pleasure scale. Br J Psychiatry. 167 (1), 99-103 (1995).
- Buysse, D. J., et al. The Pittsburgh sleep quality index: a new instrument for psychiatric practice and research. Psychiatry Res. 28 (2), 193-213 (1989).
- Sui, H., et al. The impact of basketball on the social adjustment of Chinese middle school students: the chain mediating role of interpersonal relationships and self-identity. Front Psychol. 14, 1205760 (2023).
- Yan, J., et al. Social support, psychological resilience and quality of life of nurses in infectious disease departments in China: a mediated model. J Nurs Manag. 30 (8), 4503-4513 (2022).
- First, M. B., et al. DSM-5-TR: overview of what’s new and what’s changed. World Psychiatry. 21 (2), 218-219 (2022).
- Shabani, A., et al. Psychometric properties of structured clinical interview for DSM-5 disorders-clinician version (SCID-5-CV). Brain Behav. 11 (5), e01894 (2021).
- Lam, R. W., et al. Canadian network for mood and anxiety treatments (CANMAT) 2023 update on clinical guidelines for management of major depressive disorder in adults. Can J Psychiatry. 69 (9), 641-687 (2024).
- IBM Corp. . IBM SPSS statistics for Windows. , (2025).
- Cnaan, A., Laird, N. M., Slasor, P. Using the general linear mixed model to analyse unbalanced repeated measures and longitudinal data. Stat Med. 16 (20), 2349-2380 (1997).
- Chen, S. Y., Feng, Z., Yi, X. A general introduction to adjustment for multiple comparisons. J Thorac Dis. 9 (6), 1725-1729 (2017).
- Smeltzer, M. P., Ray, M. A. Statistical considerations for outcomes in clinical research: a review of common data types and methodology. Exp Biol Med (Maywood). 247 (9), 734-742 (2022).
- Schober, P., Boer, C., Schwarte, L. A. Correlation coefficients: appropriate use and interpretation. Anesth Analg. 126 (5), 1763-1768 (2018).
- Pugh, S. L., Brown, P. D., Enserro, D. Missing repeated measures data in clinical trials. Neurooncol Pract. 9 (1), 35-42 (2021).
- Curry, J., et al. Recovery and recurrence following treatment for adolescent major depression. Arch Gen Psychiatry. 68 (3), 263-269 (2011).
- Burcusa, S. L., Iacono, W. G. Risk for recurrence in depression. Clin Psychol Rev. 27 (8), 959-985 (2007).
- O’Callaghan, G., Stringaris, A. Reward processing in adolescent depression across neuroimaging modalities. Z Kinder Jugendpsychiatr Psychother. 47 (6), 535-541 (2019).
- Blakemore, S. J., Mills, K. L. Is adolescence a sensitive period for sociocultural processing?. Annu Rev Psychol. 65, 187-207 (2014).
- Ye, Z., et al. Meta-analysis of the relationship between bullying and depressive symptoms in children and adolescents. BMC Psychiatry. 23 (1), 215 (2023).
- Bernaras, E., Jaureguizar, J., Garaigordobil, M. Child and adolescent depression: a review of theories, evaluation instruments, prevention programs, and treatments. Front Psychol. 10, 543 (2019).
- Schwartz-Mette, R. A., et al. Relations of friendship experiences with depressive symptoms and loneliness in childhood and adolescence: a meta-analytic review. Psychol Bull. 146 (8), 664-700 (2020).
- Diamond, G., et al. Family processes: risk, protective and treatment factors for youth at risk for suicide. Aggress Violent Behav. 64, 101586 (2022).
- Mufson, L., Weissman, M. M., Moreau, D., Garfinkel, R. Efficacy of interpersonal psychotherapy for depressed adolescents. Arch Gen Psychiatry. 56 (6), 573-579 (1999).
- Crits-Christoph, P., et al. Repeated assessments of depressive symptoms in randomized psychosocial intervention trials: best practice for analyzing symptom change over time. Psychother Res. 33 (2), 158-172 (2023).