This protocol describes a dual-platform digital intervention for older adults that combines a web-based virtual learning environment for adaptive cognitive training with a moderated online social platform for structured peer interaction. The article details participant onboarding, intervention delivery, adherence monitoring, safety procedures, and representative implementation outcomes across a 12-week program.
Method Article
Dual-Platform Digital Intervention for Cognitive Training and Social Participation in Older Adults
In This Article
Summary
Abstract
Age-related changes in cognitive function and social participation can jointly affect well-being in later life. Digital delivery models may provide a practical approach for supporting older adults, yet reproducible protocols that integrate cognitive training with structured online social participation remain insufficiently described. This article presents a protocol for a four-arm randomized controlled study designed to examine the implementation of a dual-platform digital intervention delivered over 12 weeks. The intervention includes a web-based Virtual Learning Environment (VLE) for adaptive cognitive training and a moderated Online Social Platform (OSP) for guided peer interaction. The protocol describes participant recruitment and screening, digital onboarding procedures, intervention scheduling, adherence monitoring, and safety governance for remote participation. Outcome collection includes measures of global cognitive performance, processing speed, loneliness, and social participation, together with process indicators relevant to protocol implementation. Representative findings are included to illustrate platform uptake, retention patterns, and expected outcome trajectories across study arms. These findings are preliminary and are presented to demonstrate protocol implementation rather than to establish clinical efficacy. This protocol may support researchers and practitioners seeking to replicate or adapt remote, multi-component digital interventions for older adult populations.
Introduction
Global population aging has intensified two closely linked public health concerns: age-related cognitive decline and reduced social connectedness in later life1,2,3. Existing epidemiological evidence indicates that these conditions often co-occur and may jointly contribute to functional deterioration, emotional burden, and poorer long-term health outcomes4,5,6. Social isolation has also been associated with elevated dementia risk, alongside other well-recognized behavioral and health-related risk factors7,8,9. Recent longitudinal work further suggests that sustained social disengagement may be accompanied by adverse structural and functional changes in brain regions involved in higher-order cognition, providing a plausible neurobiological context for the cognitive consequences of loneliness10,11,12.
These parallel challenges have created demand for interventions that are scalable, accessible, and suitable for community-dwelling older adults13. Conventional center-based programs may provide benefit, but their implementation is often constrained by transportation burden, mobility limitations, scheduling barriers, and uneven service access across settings14,15,16. Digital approaches have therefore received increasing attention as a practical route for home-based or remotely supported intervention delivery17. Computer-delivered cognitive training, including interventions implemented through Virtual Learning Environments (VLEs), has been used to provide repeated, adaptive practice across cognitive domains relevant to later-life functioning18,19,20. In parallel, internet-mediated communication tools and Online Social Platforms (OSPs) may offer older adults additional opportunities for structured interaction, peer exchange, and maintenance of social contact when face-to-face participation is limited21,22,23.
Even so, the use of digital interventions in older populations remains constrained by uneven digital access, variable technology readiness, and inconsistent adherence over time24. Older adults may encounter practical barriers such as impaired vision, reduced dexterity, and device unfamiliarity, as well as psychological barriers including low confidence, technology-related anxiety, and concern about making errors during use25,26,27. Another limitation of the current literature is that cognitive training and digitally mediated social participation are often implemented as separate intervention pathways. This separation may overlook potentially important interactions between cognitive effort and social engagement. Social participation itself may require sustained attention, working memory, inhibition, and perspective-taking, while improved cognitive functioning may, in turn, support more confident and consistent participation in social exchange28,29.
Some recent studies have moved toward multi-component or digitally supported intervention models, but protocols that clearly distinguish the independent and combined contributions of cognitive-training and social-participation components remain limited19,30,31. In particular, there is still a shortage of reproducible trial protocols that standardize both a cognitive training platform and a moderated online social participation platform within the same four-arm design. There is also limited methodological guidance on how to operationalize onboarding support, monitor engagement across platforms, and interpret platform-derived process indicators alongside participant-reported and assessor-administered outcomes. These gaps are not merely procedural. They affect whether multi-component digital interventions can be implemented consistently, compared across studies, and adapted for older adults with differing levels of digital readiness.
The present article addresses this methodological gap by detailing a novel four-arm randomized controlled protocol that uniquely isolates the independent and synergistic implementation metrics of a VLE-only condition, an OSP-only condition, and a combined VLE+OSP condition against a usual-care control. Unlike previous frameworks that deploy cognitive or social modules in isolation, the primary innovation of this protocol is its fully integrated approach: it establishes a reproducible, dual-platform digital architecture tailored specifically for older adults, complete with standardized usability-oriented onboarding, safety oversight, and continuous platform-level process tracking. Particular emphasis is placed on usability-oriented onboarding, structured implementation procedures, safety oversight for online participation, and platform-level process tracking. Representative findings are included to illustrate implementation patterns and expected assessment trajectories; they should be interpreted as preliminary and protocol-demonstrative rather than confirmatory evidence of mechanism or clinical benefit. The sections that follow describe the operational steps required to replicate the intervention and its monitoring framework in sufficient methodological detail.
Protocol
The study protocol was reviewed and approved by the Ethics Committee of Guangdong Open University (Approval No. GOU7728374). The study was conducted in accordance with the Declaration of Helsinki. Written informed consent was obtained from all participants prior to enrollment. The data supporting the representative results reported in this article are publicly available in Zenodo at 10.5281/zenodo.19324885. The repository includes de-identified participant-level data, the data dictionary, and the statistical code used for the representative analyses.
1. Participant recruitment and screening
- Recruitment strategy
- Establish recruitment partnerships with community health management institutions, senior activity centers, and local medical facilities. Request referrals from staff members who routinely work with older adults.
- Supplement face-to-face recruitment with online notices in age-appropriate community forums and moderated social media groups. Keep the core study description and eligibility language consistent across all recruitment channels.
- Set the recruitment target at 240 participants. This target allows for screening failure and attrition before randomization.
- Set the final randomization target at 160 participants. Randomize participants only after completion of the baseline assessment.
- Eligibility assessment
- Conduct an initial telephone screening for age, language ability, device access, and willingness to participate. Include only adults aged 65 years or older who can read and communicate in the study language.
- Confirm access to a tablet or computer with stable internet connectivity. Confirm that corrected vision and hearing are sufficient for screen-based participation.
- Schedule an in-person visit or a secure video-based baseline visit for candidates who pass the telephone screen. Use the same screening sequence for all candidates.
- Administer the Montreal Cognitive Assessment. Exclude candidates with a clinical diagnosis of dementia or a score below 18.
- Administer the Patient Health Questionnaire-9. Exclude candidates with a score greater than 15 and arrange clinical referrals when necessary.
- Verify the participant’s ability to operate a touchscreen or mouse independently. Exclude candidates with severe motor impairment that prevents independent device use after standard instruction.
- Record the reason for each exclusion at the time of screening. Record whether ineligibility is related to internet access, device availability, or insufficient device-use ability.
2. Baseline assessment (T0) and randomization
- Outcome measurement at baseline
- Complete baseline assessment before randomization. Administer all assessor-based and self-report measures in a standardized order.
- Administer the Montreal Cognitive Assessment and the Digit Symbol Substitution Test at baseline. Administer the Trail Making Test Part B and the Digit Span during the same visit.
- Administer the UCLA Loneliness Scale and the Social Activity Frequency Scale at baseline. Administer the eHealth Literacy Scale, the EQ-5D-5L, and the Patient Health Questionnaire-9 at their pre-specified timepoints.
- Collect demographic and clinical covariates, including age, sex, education, living arrangement, smartphone ownership duration, daily internet-use frequency, hypertension history, and diabetes history.
- Conduct assessor-administered cognitive testing using independent, trained evaluators who are strictly blinded to the participants' group allocation. Ensure this blinding protocol—where evaluators are separated from intervention delivery and participants are instructed not to disclose their group assignment to the evaluators—is maintained across all assessment timepoints, including the immediate post-intervention assessment (T1) and the 12-week follow-up assessment (T2).
- Participant blinding is not feasible for the psychosocial self-report measures. This limitation should be considered when interpreting loneliness and social participation outcomes.
- Randomization
- Generate the allocation sequence with a computer-based randomization program. Randomize 160 eligible participants in a 1:1:1:1 ratio.
- Assign 40 participants to the active control group (receiving standardized weekly health education check-ins), and 40 participants to the VLE-only group (receiving adaptive cognitive training via the Virtual Learning Environment). Concurrently, assign 40 participants to the OSP-only group (engaging in moderated peer interaction via the Online Social Platform), and the remaining 40 participants to the combined VLE+OSP group (receiving both the cognitive training and social participation components).
- Conceal the allocation sequence until all baseline assessments are complete. Use either sequentially numbered sealed envelopes or a secure central randomization database.
- Deliver standardized health education to the control group once per week for 12 weeks. Limit staff contact to one scheduled 10 min check-in call per week.
- Do not provide cognitive training tasks or online group interaction to the control group during the intervention period. Offer delayed access to the digital intervention after T2 if this arrangement has been approved in the ethics submission.
NOTE: The overall study design, the four-arm structure, and the assessment schedule are shown in Figure 1. The participant screening, exclusion, enrollment, and allocation pathway is shown in Figure 2. The baseline demographic and digital-readiness characteristics are listed in Table 1. The complete outcome framework, data type, and collection time point are listed in Table 2.
3. Onboarding and technical training
- Device setup
- Schedule one individual onboarding session for each participant assigned to an intervention arm. Set the duration at approximately 60 min.
- Install the required VLE platform or OSP platform on the participant’s device. Record the platform name, developer, version number, access route, and device compatibility in the materials log.
- Adjust font size, contrast, audio level, and notification settings to match the participant’s needs. Save the selected settings before the session ends.
- User training
- Provide a printed large-font manual with screenshots of login, task initiation, message posting, volume control, and logout procedures.
- Demonstrate the login procedure once. Then ask the participant to repeat the same procedure independently 3x.
- Demonstrate how to start a task or join a discussion session. Then ask the participant to complete one supervised practice attempt.
- Introduce the technical support route. Provide one direct phone number and one in-platform help route if available.
- Review the online safety rules before intervention starts. Instruct participants not to share passwords, financial information, identity numbers, or private contact details in group spaces.
- Record whether onboarding was completed successfully. Schedule one repeat onboarding session within 7 days if independent login or navigation cannot be completed at the first attempt.
NOTE: The onboarding workflow, interface pathway, and representative VLE task screens are shown in Figure 3.
4. Intervention implementation for the virtual learning environment arm
- Platform configuration
- Configure the VLE to deliver three sessions per week for 12 weeks. Keep each scheduled session between 20 and 30 min.
- Set the starting difficulty at Level 1 for all modules. Set the maximum difficulty at Level 8 for all participants.
- Use the same module order in each session. Start with memory tasks, continue with attention and processing-speed tasks, and finish with executive-control tasks.
- Increase difficulty only when accuracy reaches 80% or higher in the same module for two consecutive sessions. Keep the module at the current level when the threshold is not met.
- Apply the adaptive rule separately to each module. Advance only the module that meets the threshold, leaving the others unchanged.
- Task modules
- Deliver the memory module first. Use pattern-recall and delayed-match-to-sample tasks, with 12 trials per session.
- Deliver the attention and processing-speed module second. Use visual target identification tasks with distractors and 24 trials per session.
- Deliver the executive-control module last. Use rule-switching tasks with 18 trials per session.
- Keep the scoring rules constant within each task type. Record accuracy, response time, completion status, and achieved level for every completed session.
- Session management
- End the session automatically when the module sequence is completed or when the maximum session time is reached. Do not extend sessions ad hoc.
- Provide immediate positive feedback after each completed module. Use the same feedback format for all VLE participants.
- Trigger an automated reminder when no login is recorded for 3 consecutive days. Place one staff contact call if no activity occurs within the next 48 h.
- Record the total amount of staff support time for each VLE participant. Use this data later to evaluate exposure and contact intensity across study arms.
5. Intervention implementation for the online social platform arm
- Group formation and moderation
- Assign OSP participants to small groups of 5 to 8 members. Balance groups by age band and broad interest areas—such as shared hobbies, former occupational fields, or daily lifestyle preferences—when possible to facilitate initial peer engagement.
- Assign one trained moderator to each group. Complete the same moderator training before participant interaction begins.
- Record the moderator training content in the study file. Include facilitation rules, privacy protection, neutral prompting, and escalation procedures.
- Structured interaction activities
- Schedule one 45 min synchronous video session each week. Begin each session with an audio and video check for all participants.
- Use one pre-specified weekly discussion topic per session. Examples include childhood hobbies, memorable festivals, cooking routines, or favorite local places.
- Post one asynchronous discussion prompt each day in the group chat. Keep the prompt format consistent across groups and across weeks.
- Introduce one low-stakes collaborative activity each week. Use activities such as a shared photo theme, a weekly memory-sharing task, or a simple group wellness challenge.
- NOTE: The interaction modes, activity schedule, and moderation pathway of the OSP arm are shown in Figure 4.
- Moderation and safety
- Review group activity logs each day. Screen for conflict, harassment, distress signals, and privacy violations.
- Apply the same intervention rule across all groups when a risk event occurs. Remove the problematic content, contact the participant privately, and document the action in the safety log.
- Escalate serious safety concerns to the designated study clinician or principal investigator on the same day. Follow the pre-specified safety workflow for further action.
- Respond within 4 h when a participant's post receives no reply from peers during daytime moderation hours. Use one moderator reply and one neutral tag to stimulate peer response.
- Keep the moderation intensity as consistent as possible across groups. Record moderator contacts and intervention actions for later review.
6. Intervention implementation for the combined VLE+OSP arm
- Schedule coordination
- Assign VLE training to three fixed days each week. Assign OSP live sessions and asynchronous activities to separate days.
- Keep the weekly structure stable throughout the 12-week intervention. Use the same scheduling template for all combined-arm participants.
- Post brief group messages that acknowledge collective VLE participation milestones. Keep the wording standardized across weeks.
- Record all technical support time, moderator contacts, and researcher contacts for this arm separately. Use these data to assess whether the combined arm receives greater total exposure or staff attention.
7. Data collection and monitoring
- Continuous process data
- Collect VLE logs automatically throughout the intervention. Record login timestamp, session duration, module completed, level achieved, mean accuracy, and mean response time.
- Collect OSP activity logs automatically throughout the intervention. Record number of posts, number of comments, number of reactions, video-session attendance duration, and number of completed collaborative activities.
- Define response latency as the elapsed time in minutes between a participant's post and the first peer response. Treat moderator responses separately from peer responses in the raw log.
- Define engagement intensity as the standardized sum of weekly login frequency, completed VLE sessions, number of original posts, number of comments, and attended video minutes. Convert each component to a z-score before summation.
- Define the composite engagement index as the mean of the available standardized platform-engagement variables for each participant across the 12-week intervention. Calculate the index only when at least 70% of the expected log fields are available.
- Treat missing log records as missing and do not record them as zero unless a verified system record confirms non-use. Document all data-cleaning rules in the statistical code file.
NOTE: The process indicators and adherence-related variables are summarized in Table 3.
- Post-intervention assessment (T1)
- Re-administer all baseline outcome measures within 7 days after completion of the 12-week intervention. Maintain the same assessment order used at baseline.
- Administer the System Usability Scale at T1. Use the same language version for all participants.
- Administer the NASA Task Load Index at T1. Do not substitute another fatigue or burden instrument.
- Record completion rates, reasons for missed assessments, and protocol deviations at T1. Record adverse events and burden indicators in the study database.
- Follow-up assessment (T2)
- Conduct the final outcome assessment 12 weeks after the end of the intervention. Define this time point as Week 24 throughout the manuscript.
- Re-administer the same cognitive, psychosocial, and health-related measures collected at baseline unless otherwise pre-specified in Table 2.
- Maintain assessor blinding for assessor-administered measures whenever feasible. Record any instances of unblinding in the study log.
8. Statistical analysis
- Primary analysis plan
- Analyze repeated continuous outcomes with linear mixed models. Include group, time, and group-by-time interaction as fixed effects.
- Include participant as a random effect. Use an unstructured covariance matrix when model convergence is achieved. Use first-order autoregressive or compound symmetry structures only when the primary model fails to converge.
- Adjust for baseline age, years of education, and the baseline value of the dependent variable. Retain the same covariate rule across all primary models.
- Conduct the primary analysis under an intention-to-treat framework. Include all randomized participants with available repeated-measures data.
- Treat missing outcome data under the missing-at-random assumption within the mixed-model framework. Perform a sensitivity analysis with multiple imputation if attrition exceeds 10%.
- Control multiplicity by pre-specifying the primary outcomes and applying Holm adjustment to pairwise post hoc comparisons when required. Treat exploratory outcomes as supportive rather than confirmatory.
- Adherence and exploratory subgroup analysis
- Define high adherence in the VLE arms as completion of at least 27 of the 36 assigned sessions. Define lower adherence as completion of fewer than 27 sessions.
- Define high engagement in the OSP arms as active participation on at least 4 days per week on average. Define active participation as posting, commenting, or attending a scheduled video session.
- Treat adherence-based subgroup analyses as exploratory and post hoc. Do not interpret these comparisons as randomized causal contrasts.
- Record staff contact time and platform exposure time for all groups. Consider these variables when describing implementation differences, particularly in the combined arm.
Results
A total of 240 individuals were screened for eligibility, and 160 participants were randomized across the four study arms. By the post-intervention assessment, 141 participants remained available for analysis, corresponding to a retention rate of 88.1%. The participant flow is shown in Figure 2.
Baseline demographic, health-related, and digital-readiness characteristics are presented in Table 1. Across the four groups, age, sex distribution, education level, common chronic conditions, baseline cognitive scores, baseline loneliness, and digital access indicators were broadly comparable at enrollment. The full outcome framework and measurement schedule are presented in Table 2.
These representative findings collectively validate the operational feasibility of the dual-platform protocol by illustrating the synergy between automated implementation monitoring and longitudinal outcome assessment. The high retention rates and consistent platform engagement (detailed in Table 3) serve as a direct reflection of the standardized onboarding and moderation techniques described in the protocol, suggesting that the technical barriers typically associated with older adult populations were effectively mitigated. Furthermore, the divergent trajectories observed across the four study arms demonstrate the sensitivity of the outcome framework to specific intervention components. To rigorously evaluate these results in future applications, we recommend the use of linear mixed-effects models (LMMs). This analytic approach is uniquely suited for the four-arm design as it can simultaneously account for within-subject correlations over time and between-group variances, while providing robust estimates under the missing-at-random (MAR) assumption common in digital health trials.
Platform engagement and implementation adherence
Representative platform-use indicators are summarized in Table 3. In the VLE-only arm, participants completed a mean of 29.4 ± 8.1 sessions over 12 weeks, corresponding to a completion rate of 78.6% ± 15.4%. In the combined VLE+OSP arm, the mean number of completed VLE sessions was 27.8 ± 8.7, with a completion rate of 74.2% ± 16.1%. Mean task accuracy remained above 80% in both VLE-exposed groups, and the highest achieved difficulty level was 6.3 ± 1.4 in the VLE-only arm and 6.1 ± 1.5 in the combined arm.
OSP engagement indicators also showed regular participation. Active social days per week averaged 3.2 ± 1.1 in the OSP-only arm and 3.0 ± 1.2 in the combined arm. Total OSP interactions per participant per week were 14.6 ± 6.9 in the OSP-only arm and 12.8 ± 6.4 in the combined arm. Reciprocity rates were 57.3% in the OSP-only arm and 54.8% in the combined arm. Median response latency was 6.7 h in the OSP-only arm and 7.4 h in the combined arm. These implementation indicators correspond to the activity structure illustrated in Figure 4. Crucially, the successful capture of these concurrent engagement streams across separate interfaces demonstrates the feasibility of our novel dual-platform monitoring framework, which successfully tracks and isolates VLE and OSP compliance within a single cohort.
Representative cognitive outcomes
Representative cognitive outcome summaries are shown in Table 4. For global cognition, the control group showed a mean MoCA change of +0.4 ± 1.1 points from T0 to T1. The VLE-only group showed a mean change of +1.2 ± 1.2 points, with a between-group difference versus control of +0.9 points (95% CI, 0.3 to 1.5; p = 0.003). The combined VLE+OSP group showed a mean change of +1.6 ± 1.1 points, with a between-group difference versus control of +1.1 points (95% CI, 0.6 to 1.7; p < 0.001). The OSP-only group showed a smaller MoCA change of +0.6 ± 1.2 points and was not significantly different from control (p = 0.52).
For processing speed and attention, the control group showed a mean DSST change of +1.1 ± 4.8 correct items. The VLE-only group showed a mean change of +4.1 ± 5.1, corresponding to a between-group difference of +3.0 (95% CI, 1.2 to 4.8; p = 0.001). The combined VLE+OSP group showed a mean change of +5.4 ± 5.2, corresponding to a between-group difference of +4.3 (95% CI, 2.5 to 6.1; p < 0.001). The OSP-only group showed a mean change of +2.3 ± 5.0 and did not differ significantly from control (p = 0.23). These cognitive trajectories are illustrated in Figure 5.
Representative psychosocial outcomes
Representative psychosocial outcome summaries are also shown in Table 4. For loneliness, the control group showed a mean UCLA Loneliness Scale change of −0.5 ± 4.1 points. The VLE-only group showed a mean change of −2.5 ± 4.3, corresponding to a between-group difference of −2.0 (95% CI, −3.6 to −0.4; p = 0.014). The OSP-only group showed a mean change of −4.0 ± 4.5, corresponding to a between-group difference of −3.5 (95% CI, −5.2 to −1.8; p < 0.001). The combined VLE+OSP group showed a mean change of −5.5 ± 4.6, corresponding to a between-group difference of −5.0 (95% CI, −6.6 to −3.4; p < 0.001). The corresponding longitudinal pattern is shown in Figure 6.
For social participation frequency, the control group showed a mean SAFS change of +0.4 ± 2.7 points. The VLE-only group showed a mean change of +1.9 ± 2.9, with a between-group difference of +1.5 (95% CI, 0.3 to 2.7; p = 0.015). The OSP-only group showed a mean change of +4.2 ± 3.1, with a between-group difference of +3.8 (95% CI, 2.4 to 5.2; p < 0.001). The combined VLE+OSP group showed a mean change of +4.7 ± 3.0, with a between-group difference of +4.3 (95% CI, 2.9 to 5.7; p < 0.001). The corresponding change pattern is shown in Figure 7.
Exploratory adherence-stratified summaries
Exploratory adherence-stratified summaries are presented in Table 5. Within the VLE-only arm, participants classified as high-adherence showed a MoCA change of +1.6 ± 1.0 and a DSST change of +5.6 ± 4.6, whereas lower-adherence participants showed corresponding changes of +0.7 ± 1.1 and +2.1 ± 4.7. Within the OSP-only arm, high-engagement participants showed a loneliness change of −5.2 ± 4.2 and a SAFS change of +5.1 ± 3.0, whereas lower-engagement participants showed corresponding changes of −2.4 ± 4.5 and +3.0 ± 3.1.
In the combined arm, participants in the higher adherence/engagement stratum showed a MoCA change of +2.0 ± 0.9, a DSST change of +7.1 ± 5.0, a loneliness change of −6.8 ± 4.3, and a SAFS change of +5.6 ± 2.9. The corresponding lower adherence/engagement stratum showed changes of +0.9 ± 1.1, +3.2 ± 5.2, −3.6 ± 4.6, and +3.4 ± 3.0, respectively. These subgroup summaries are descriptive and exploratory.
Usability, burden, and safety
Usability and burden indicators are summarized in Table 6. Session-related fatigue scores ranged from 2.1 ± 1.3 in the control group to 3.7 ± 1.8 in the combined group. Mean perceived workload scores on the NASA-TLX ranged from 33.8 ± 12.6 in the control group to 44.6 ± 15.2 in the combined group. Technical disruptions occurring at least once per week were reported in 15.6% of the VLE-only group, 11.4% of the OSP-only group, and 21.1% of the combined group. Assistance requests to staff averaged 1.2 ± 1.3 per participant in the VLE-only group, 0.9 ± 1.1 in the OSP-only group, and 1.5 ± 1.5 in the combined group.
Adverse events and online risk events are presented in Table 7. Eye strain was reported in 15.6% of the VLE-only group, 8.6% of the OSP-only group, and 18.4% of the combined group. Session interruption incidents were reported in 15.6%, 11.4%, and 21.1% of these groups, respectively. Privacy-related events and unwanted contact reports were infrequent, and no severe adverse events were recorded.
Table 8 contains an extended summary, including effect size and practical significance framing.
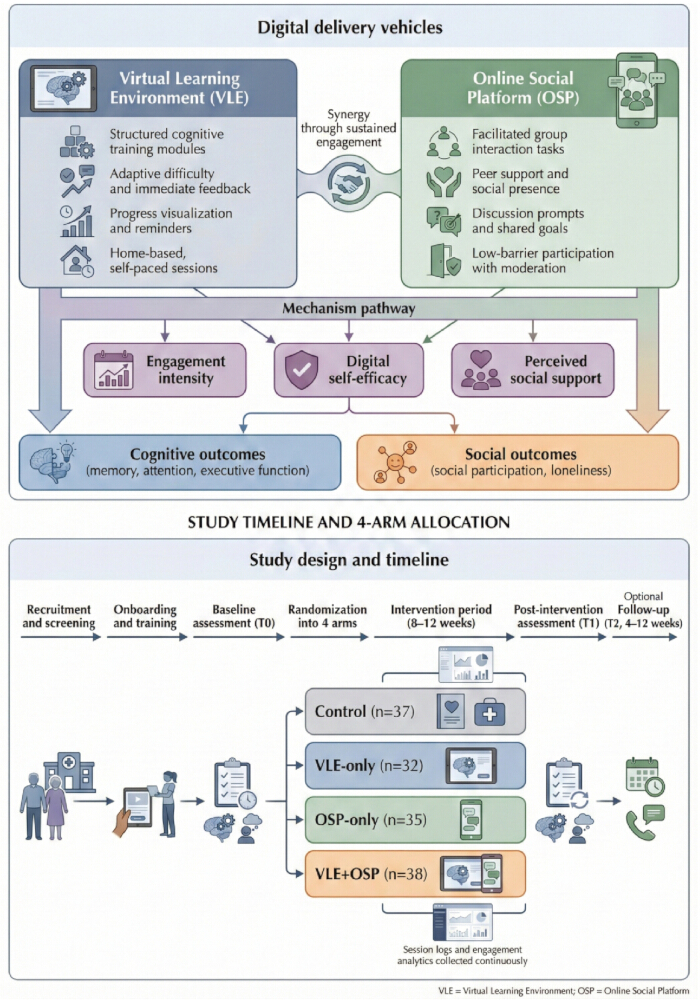
Figure 1: Study design and intervention architecture. This figure shows the four-arm study structure, including the control, VLE-only, OSP-only, and VLE+OSP conditions. It also shows the protocol-defined assessment schedule at T0, T1, and T2. Please click here to view a larger version of this figure.
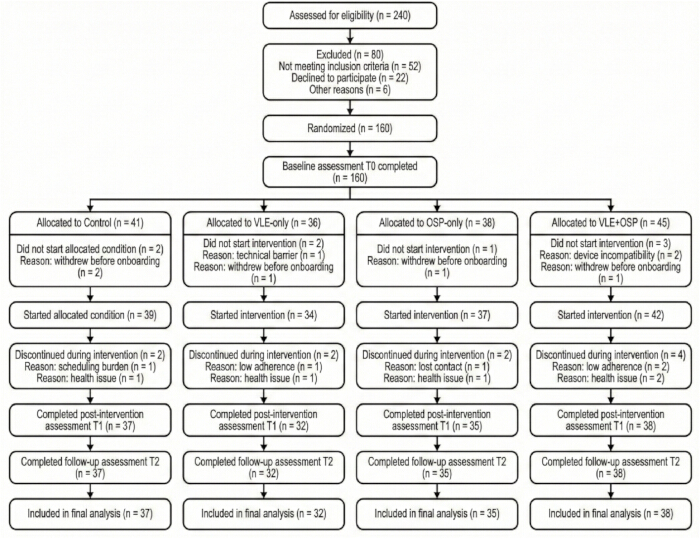
Figure 2: Participant flow from screening to follow-up. This figure shows the number of participants screened, excluded, randomized, and retained at each stage of the study. It presents screening, allocation, post-intervention assessment, and follow-up in a CONSORT-style format. Please click here to view a larger version of this figure.
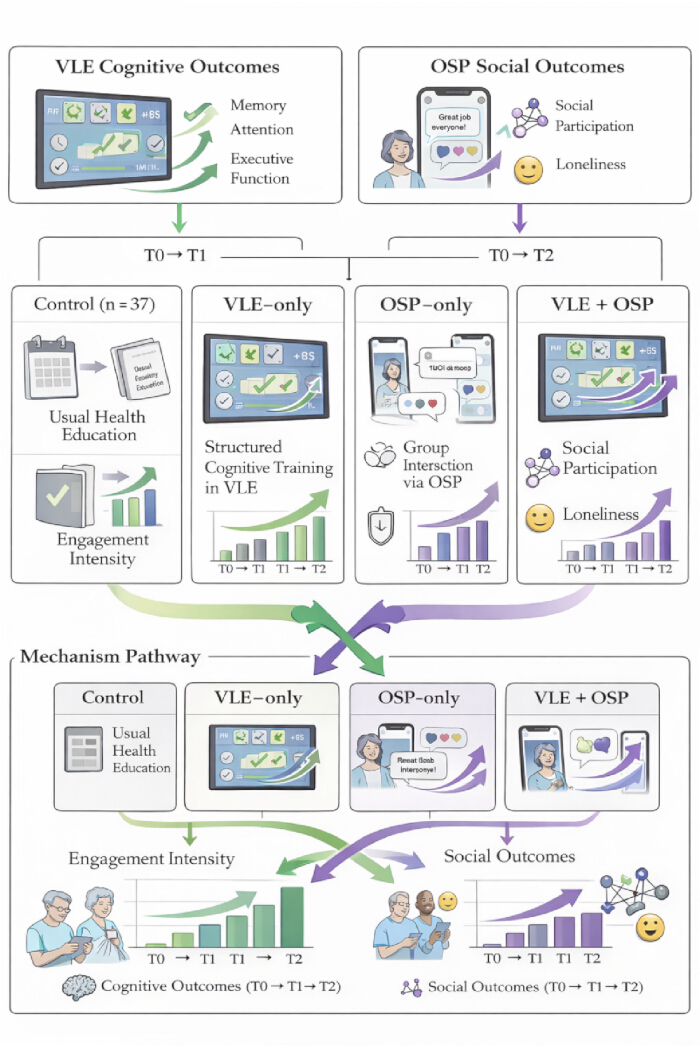
Figure 3: Onboarding workflow and representative VLE interface pathway. This figure presents the standardized onboarding sequence and the main interface steps used during participant training. It also includes representative examples of VLE task navigation or task presentation. Please click here to view a larger version of this figure.
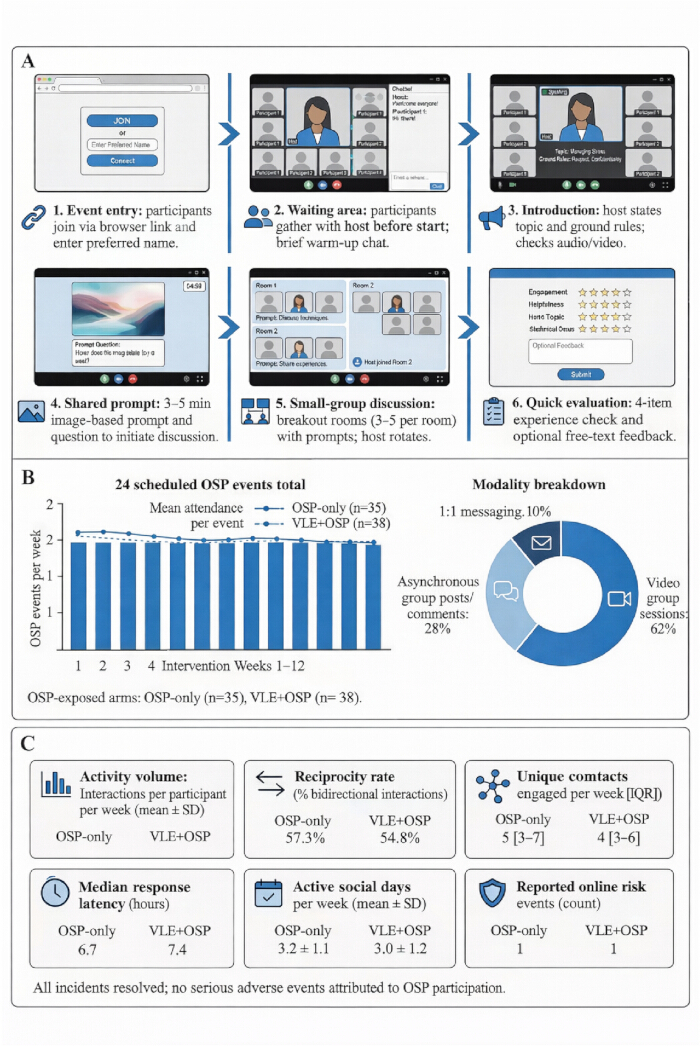
Figure 4: Representative OSP activity patterns during the intervention period. This figure presents the distribution of video attendance, asynchronous posting, commenting, and reciprocal interaction in the OSP-exposed groups. It is intended to illustrate how the social platform was used during protocol implementation. Please click here to view a larger version of this figure.
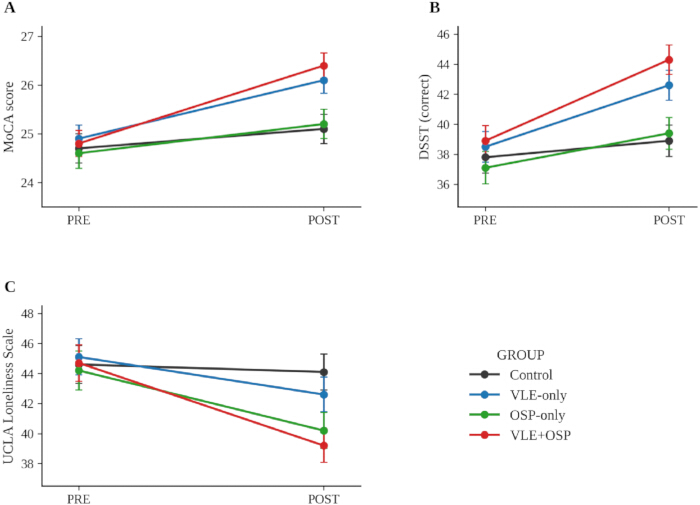
Figure 5: Representative cognitive and psychosocial outcome trajectories across study arms (n = 141). (A) MoCA scores, (B) DSST scores, and (C) UCLA Loneliness Scale scores across the protocol-defined assessment timepoints. PRE indicates the baseline assessment (T0), and POST indicates the immediate post-intervention assessment at 12 weeks (T1). Values are displayed as group means, with error bars representing the standard error of the mean (SEM). Abbreviations: MoCA = Montreal Cognitive Assessment; DSST = Digit Symbol Substitution Test; VLE = Virtual Learning Environment; OSP = Online Social Platform. Please click here to view a larger version of this figure.
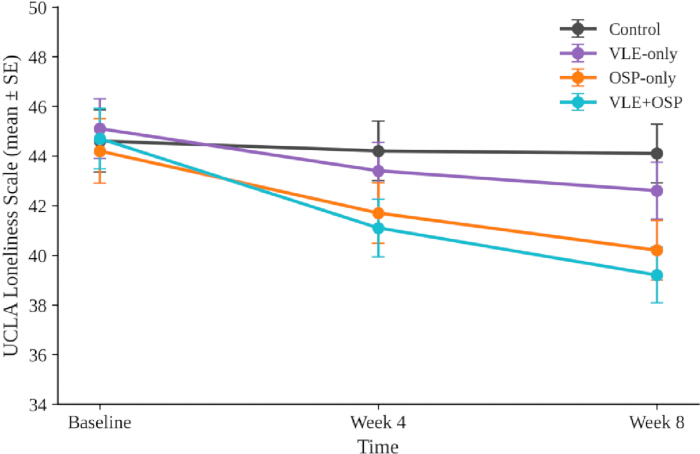
Figure 6: Representative loneliness trajectories across study arms (n = 141). This figure shows UCLA Loneliness Scale scores at the protocol-defined assessment timepoints for the four study groups. Values are displayed as group means with error bars representing the standard error (SE). Abbreviations: VLE = Virtual Learning Environment; OSP = Online Social Platform. Please click here to view a larger version of this figure.
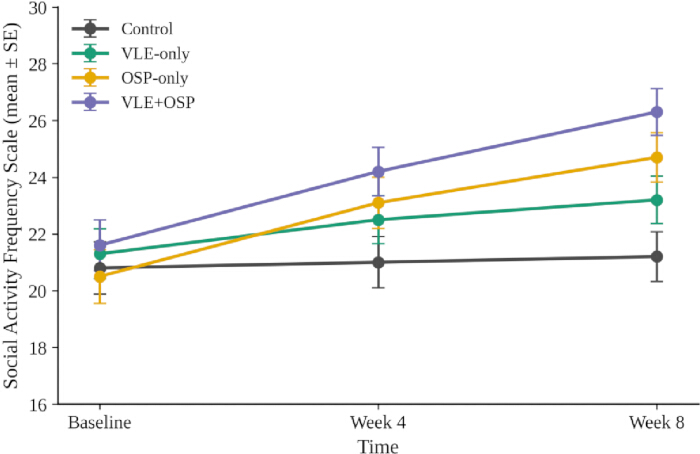
Figure 7: Representative social participation trajectories across study arms (n = 141). This figure shows Social Activity Frequency Scale scores across the protocol-defined assessment timepoints for all four groups. Values are displayed as group means with error bars representing the standard error (SE). Abbreviations: VLE = Virtual Learning Environment; OSP = Online Social Platform. Please click here to view a larger version of this figure.
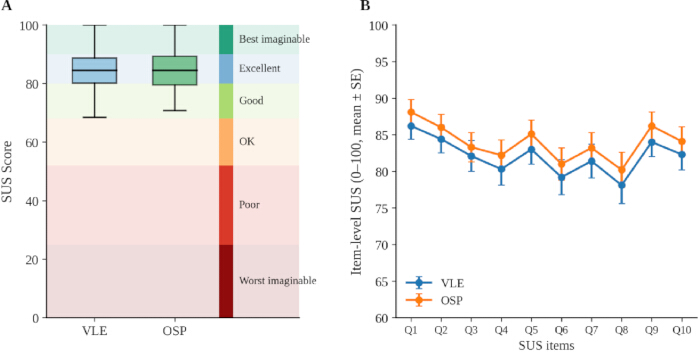
Figure 8: Usability and acceptability of the digital platforms (n = 141). (A) Overall System Usability Scale (SUS) scores for the VLE and OSP components. For the box plots, the central line indicates the median, the box spans the interquartile range (IQR), and the whiskers represent the [minimum and maximum values / 1.5 x IQR]. Background colors correspond to standard usability adjective ratings. (B) Item-level usability patterns showing mean scores across the ten SUS questions (Q1–Q10). Error bars represent the standard error (SE). Abbreviations: SUS = System Usability Scale; VLE = Virtual Learning Environment; OSP = Online Social Platform; SE = Standard Error. Please click here to view a larger version of this figure.
| Characteristic | Control | VLE-only | OSP-only | VLE+OSP |
| (n=37) | (n=32) | (n=35) | (n=38) | |
| Demographics | ||||
| Age, years (mean ± SD) | 72.6 ± 5.8 | 71.9 ± 6.1 | 72.3 ± 5.5 | 71.7 ± 6.4 |
| Female, n (%) | 21 (56.8) | 18 (56.3) | 20 (57.1) | 22 (57.9) |
| Married/partnered, n (%) | 24 (64.9) | 20 (62.5) | 22 (62.9) | 25 (65.8) |
| Living alone, n (%) | 12 (32.4) | 9 (28.1) | 11 (31.4) | 12 (31.6) |
| Education ≥ college, n (%) | 14 (37.8) | 13 (40.6) | 13 (37.1) | 16 (42.1) |
| Health profile | ||||
| BMI, kg/m² (mean ± SD) | 24.9 ± 3.2 | 24.6 ± 3.1 | 24.8 ± 3.4 | 24.7 ± 3.3 |
| Hypertension, n (%) | 18 (48.6) | 15 (46.9) | 17 (48.6) | 19 (50.0) |
| Type 2 diabetes, n (%) | 9 (24.3) | 7 (21.9) | 8 (22.9) | 10 (26.3) |
| Cardiovascular disease history, n (%) | 7 (18.9) | 6 (18.8) | 7 (20.0) | 8 (21.1) |
| Mild depressive symptoms (PHQ-9 ≥ 5), n (%) | 10 (27.0) | 9 (28.1) | 10 (28.6) | 11 (28.9) |
| Baseline outcomes | ||||
| MoCA score, 0–30 (mean ± SD) | 24.7 ± 2.6 | 24.9 ± 2.4 | 24.6 ± 2.7 | 24.8 ± 2.5 |
| Digit Symbol Substitution Test, correct (mean ± SD) | 37.8 ± 9.6 | 38.5 ± 9.2 | 37.1 ± 9.8 | 38.9 ± 9.4 |
| UCLA Loneliness Scale, 20–80 (mean ± SD) | 44.6 ± 8.7 | 45.1 ± 8.4 | 44.2 ± 8.9 | 44.7 ± 8.6 |
| Social Activity Frequency Scale, 9–45 (mean ± SD) | 20.8 ± 5.6 | 21.3 ± 5.4 | 20.5 ± 5.7 | 21.6 ± 5.5 |
| Digital readiness | ||||
| Smartphone ownership, n (%) | 32 (86.5) | 29 (90.6) | 30 (85.7) | 35 (92.1) |
| Home internet access, n (%) | 34 (91.9) | 30 (93.8) | 32 (91.4) | 36 (94.7) |
| Daily internet use, n (%) | 26 (70.3) | 23 (71.9) | 24 (68.6) | 29 (76.3) |
| Weekly use of online social networking, n (%) | 19 (51.4) | 16 (50.0) | 20 (57.1) | 22 (57.9) |
| Prior online learning experience, n (%) | 15 (40.5) | 14 (43.8) | 14 (40.0) | 18 (47.4) |
| eHEALS digital health literacy, 8–40 (mean ± SD) | 27.6 ± 5.1 | 28.1 ± 5.0 | 27.3 ± 5.3 | 28.7 ± 5.2 |
| Digital self-efficacy, 0–10 (mean ± SD) | 6.4 ± 1.7 | 6.6 ± 1.6 | 6.3 ± 1.8 | 6.8 ± 1.6 |
Table 1: Baseline characteristics and digital-readiness indicators by study arm. This table summarizes demographic characteristics, health-related variables, baseline cognitive and psychosocial measures, and digital access indicators at enrollment. It is intended to describe the enrolled sample at T0.
| Domain | Construct / Outcome | Measure | Data type / scale | Timepoints | Role | Source |
| (Instrument) | (T0/T1/T2) | |||||
| Cognition | Global cognition | Montreal Cognitive Assessment (MoCA) | 0–30; higher = better | ✔ / ✔ / ✔ | Primary | In-person/remote assessment |
| Cognition | Processing speed & attention | Digit Symbol Substitution Test (DSST) | Correct symbols; higher = better | ✔ / ✔ / ✔ | Primary | In-person/remote assessment |
| Cognition | Executive function | Trail Making Test Part B (TMT-B) | Seconds; lower = better | ✔ / ✔ / ✔ | Secondary | In-person/remote assessment |
| Cognition | Working memory | Digit Span (Forward/Backward) | Span length; higher = better | ✔ / ✔ / ✔ | Secondary | In-person/remote assessment |
| Social participation | Social participation frequency | Social Activity Frequency Scale | 9–45; higher = more participation | ✔ / ✔ / ✔ | Primary | Self-report questionnaire |
| Social participation | Loneliness | UCLA Loneliness Scale | 20–80; higher = more loneliness | ✔ / ✔ / ✔ | Primary | Self-report questionnaire |
| Social participation | Perceived social support | Multidimensional Scale of Perceived Social Support (MSPSS) | 12–84; higher = more support | ✔ / ✔ / ✔ | Secondary | Self-report questionnaire |
| Psychological | Depressive symptoms | PHQ-9 | 0–27; higher = worse | ✔ / ✔ / ✔ | Covariate / Secondary | Self-report questionnaire |
| Digital readiness | Digital health literacy | eHEALS | 8–40; higher = better | ✔ / — / ✔ | Moderator | Self-report questionnaire |
| Digital readiness | Digital self-efficacy | Digital Self-Efficacy Scale | 0–10; higher = better | ✔ / ✔ / ✔ | Mediator / Moderator | Self-report questionnaire |
| Usability & burden | System usability | System Usability Scale (SUS) | 0–100; higher = better | — / ✔ / ✔ | Secondary | Post-use questionnaire |
| Usability & burden | Intervention burden | Fatigue / eyestrain / dizziness checklist | 0–10 per item; higher = worse | — / ✔ / ✔ | Safety / Secondary | Post-use questionnaire |
| VLE platform metrics | Training dose | Active training days | Count | — / Continuous / Continuous | Mechanism | VLE logs |
| VLE platform metrics | Training adherence | Session completion rate | % of assigned sessions completed | — / Continuous / Continuous | Mechanism | VLE logs |
| VLE platform metrics | Training intensity | Mean session duration | Minutes/session | — / Continuous / Continuous | Mechanism | VLE logs |
| VLE platform metrics | Learning performance | Accuracy / level achieved | % correct; level index | — / Continuous / Continuous | Mechanism | VLE logs |
| OSP platform metrics | Social exposure | Active social days | Count | — / Continuous / Continuous | Mechanism | OSP logs |
| OSP platform metrics | Interaction intensity | Posts + comments + reactions | Count | — / Continuous / Continuous | Mechanism | OSP logs |
| OSP platform metrics | Interaction quality | Reciprocity rate | % of interactions bidirectional | — / Continuous / Continuous | Mechanism | OSP logs |
| OSP platform metrics | Network structure | Unique contacts engaged | Count | — / Continuous / Continuous | Mechanism | OSP logs |
| OSP platform metrics | Responsiveness | Median response latency | Hours | — / Continuous / Continuous | Mechanism | OSP logs |
| Cross-platform | Total engagement | Composite engagement index | Standardized z-score composite | — / Continuous / Continuous | Mechanism | VLE + OSP logs |
| Safety & governance | Online risk events | Reported incidents (scam, harassment, privacy) | Count + category | — / Continuous / Continuous | Safety | Research monitoring |
Table 2: Outcome framework and measurement schedule. This table lists the cognitive, psychosocial, digital-readiness, usability, burden, and platform-derived variables included in the study. It also indicates the corresponding scale, time point, role, and data source.
| Metric (unit) | VLE-only | OSP-only | VLE+OSP |
| (n=32) | (n=35) | (n=38) | |
| VLE cognitive training analytics | |||
| Active training days per week (days) | 3.6 ± 1.2 | 3.3 ± 1.1 | |
| Completed training sessions (total, 12 weeks) | 29.4 ± 8.1 | 27.8 ± 8.7 | |
| Session completion rate (% assigned) | 78.6 ± 15.4 | 74.2 ± 16.1 | |
| Mean session duration (min/session) | 18.7 ± 4.6 | 17.9 ± 4.9 | |
| Task accuracy (% correct) | 82.1 ± 7.8 | 81.4 ± 8.3 | |
| Highest difficulty level achieved (1–10) | 6.3 ± 1.4 | 6.1 ± 1.5 | |
| Learning slope (difficulty level gain per week) | 0.18 ± 0.09 | 0.16 ± 0.10 | |
| Performance variability (SD of accuracy across sessions, %) | 6.9 ± 2.8 | 7.4 ± 3.1 | |
| OSP engagement analytics and social network indicators | |||
| Active social days per week (days) | 3.2 ± 1.1 | 3.0 ± 1.2 | |
| Total OSP interactions per participant per week (count) | 14.6 ± 6.9 | 12.8 ± 6.4 | |
| Posts per participant per week (count) | 2.3 ± 1.5 | 2.0 ± 1.4 | |
| Comments per participant per week (count) | 5.7 ± 3.6 | 5.1 ± 3.2 | |
| Reactions per participant per week (count) | 6.6 ± 3.8 | 5.7 ± 3.5 | |
| Reciprocity rate (% bidirectional interactions) | 57.30% | 54.80% | |
| Unique contacts engaged per week (count, median [IQR]) | 5 [3–7] | 4 [3–6] | |
| Median response latency (hours) | 6.7 | 7.4 | |
| Event attendance per participant (events attended, 12 weeks) | 9.6 ± 3.4 | 9.1 ± 3.6 | |
| Mean attendance per event (participants/event) | 8.4 ± 1.3 | 8.1 ± 1.4 | |
| Cross-platform (combined analytics) | |||
| Composite engagement index (z-score) | 0.21 ± 0.74 | 0.17 ± 0.78 | 0.34 ± 0.71 |
| Engagement stability (active weeks with ≥2 activity days, %, 12 weeks) | 71.8 ± 18.6 | 68.9 ± 19.7 | 73.4 ± 17.9 |
| Reported online risk events (count) | 0 | 1 | 1 |
Table 3: Platform engagement and implementation indicators in the intervention groups. This table summarizes VLE training analytics, OSP interaction metrics, and cross-platform engagement indicators. Continuous variables are presented as mean ± standard deviation (SD) unless otherwise specified. It describes how consistently intervention components were used during the 12-week period. Abbreviations: VLE = Virtual Learning Environment; OSP = Online Social Platform; SD = Standard Deviation.
| Outcome (primary) | Group (n) | T0 | T1 | Change | ΔΔ vs Control | P value |
| (Δ) | (95% CI) | |||||
| Global cognition (MoCA, 0–30; higher = better) | Control (37) | 24.7 ± 2.6 | 25.1 ± 2.5 | +0.4 ± 1.1 | Reference | — |
| VLE-only (32) | 24.9 ± 2.4 | 26.1 ± 2.3 | +1.2 ± 1.2 | +0.9 (0.3 to 1.5) | 0.003 | |
| OSP-only (35) | 24.6 ± 2.7 | 25.2 ± 2.6 | +0.6 ± 1.2 | +0.2 (−0.4 to 0.8) | 0.52 | |
| VLE+OSP (38) | 24.8 ± 2.5 | 26.4 ± 2.2 | +1.6 ± 1.1 | +1.1 (0.6 to 1.7) | <0.001 | |
| Processing speed/attention (DSST correct; higher = better) | Control (37) | 37.8 ± 9.6 | 38.9 ± 9.4 | +1.1 ± 4.8 | Reference | — |
| VLE-only (32) | 38.5 ± 9.2 | 42.6 ± 9.0 | +4.1 ± 5.1 | +3.0 (1.2 to 4.8) | 0.001 | |
| OSP-only (35) | 37.1 ± 9.8 | 39.4 ± 9.6 | +2.3 ± 5.0 | +1.1 (−0.7 to 2.9) | 0.23 | |
| VLE+OSP (38) | 38.9 ± 9.4 | 44.3 ± 9.1 | +5.4 ± 5.2 | +4.3 (2.5 to 6.1) | <0.001 | |
| Loneliness (UCLA, 20–80; higher = worse) | Control (37) | 44.6 ± 8.7 | 44.1 ± 8.5 | −0.5 ± 4.1 | Reference | — |
| VLE-only (32) | 45.1 ± 8.4 | 42.6 ± 8.2 | −2.5 ± 4.3 | −2.0 (−3.6 to −0.4) | 0.014 | |
| OSP-only (35) | 44.2 ± 8.9 | 40.2 ± 8.6 | −4.0 ± 4.5 | −3.5 (−5.2 to −1.8) | <0.001 | |
| VLE+OSP (38) | 44.7 ± 8.6 | 39.2 ± 8.3 | −5.5 ± 4.6 | −5.0 (−6.6 to −3.4) | <0.001 | |
| Social participation frequency (SAFS, 9–45; higher = better) | Control (37) | 20.8 ± 5.6 | 21.2 ± 5.5 | +0.4 ± 2.7 | Reference | — |
| VLE-only (32) | 21.3 ± 5.4 | 23.2 ± 5.3 | +1.9 ± 2.9 | +1.5 (0.3 to 2.7) | 0.015 | |
| OSP-only (35) | 20.5 ± 5.7 | 24.7 ± 5.4 | +4.2 ± 3.1 | +3.8 (2.4 to 5.2) | <0.001 | |
| VLE+OSP (38) | 21.6 ± 5.5 | 26.3 ± 5.2 | +4.7 ± 3.0 | +4.3 (2.9 to 5.7) | <0.001 |
Table 4: Representative outcome changes from T0 to T1 by study arm. This table presents mean pre-post changes for the primary cognitive and psychosocial outcomes (presented as mean ± standard deviation [SD]), together with between-group differences versus control and 95% confidence intervals (CIs). Between-group estimates and p-values were derived from linear mixed-effects models (LMMs). The values are reported to illustrate representative outcome patterns under the protocol. Abbreviations: MoCA = Montreal Cognitive Assessment; DSST = Digit Symbol Substitution Test; VLE = Virtual Learning Environment; OSP = Online Social Platform; SD = Standard Deviation; CI = Confidence Interval.
| Platform arm | Stratum (n) | MoCA Δ | DSST Δ (correct) | UCLA Loneliness Δ | SAFS Δ | ΔΔ vs Control (MoCA) (95% CI) | P value |
| Control | Reference (37) | +0.4 ± 1.1 | +1.1 ± 4.8 | −0.5 ± 4.1 | +0.4 ± 2.7 | Reference | — |
| VLE-only (n=32) | High-adherence (19) | +1.6 ± 1.0 | +5.6 ± 4.6 | −3.0 ± 4.1 | +2.3 ± 2.6 | +1.1 (0.5 to 1.8) | <0.001 |
| Low-adherence (13) | +0.7 ± 1.1 | +2.1 ± 4.7 | −1.8 ± 4.4 | +1.2 ± 2.8 | +0.3 (−0.4 to 1.0) | 0.38 | |
| OSP-only (n=35) | High-engagement (20) | +0.8 ± 1.1 | +3.1 ± 4.8 | −5.2 ± 4.2 | +5.1 ± 3.0 | +0.4 (−0.2 to 1.1) | 0.2 |
| Low-engagement (15) | +0.4 ± 1.2 | +1.4 ± 4.9 | −2.4 ± 4.5 | +3.0 ± 3.1 | +0.1 (−0.6 to 0.8) | 0.76 | |
| VLE+OSP (n=38) | High-adherence/engagement (22) | +2.0 ± 0.9 | +7.1 ± 5.0 | −6.8 ± 4.3 | +5.6 ± 2.9 | +1.6 (0.9 to 2.2) | <0.001 |
| Low-adherence/engagement (16) | +0.9 ± 1.1 | +3.2 ± 5.2 | −3.6 ± 4.6 | +3.4 ± 3.0 | +0.5 (−0.2 to 1.2) | 0.15 |
Table 5: Exploratory adherence-stratified outcome summaries. This table presents descriptive outcome changes (presented as mean ± standard deviation [SD]) according to higher and lower observed adherence or engagement within the intervention arms. Statistical comparisons between higher and lower adherence strata were conducted using independent samples t-tests. These comparisons are exploratory and are not randomized contrasts. Abbreviations: MoCA = Montreal Cognitive Assessment; DSST = Digit Symbol Substitution Test; SAFS = Social Activity Frequency Scale; VLE = Virtual Learning Environment; OSP = Online Social Platform; SD = Standard Deviation.
| Domain | Indicator | Control | VLE-only | OSP-only | VLE+OSP |
| (unit / scale) | (n=37) | (n=32) | (n=35) | (n=38) | |
| Fatigue & workload | Session-related fatigue (0–10, higher=worse) | 2.1 ± 1.3 | 3.4 ± 1.7 | 2.8 ± 1.5 | 3.7 ± 1.8 |
| Perceived workload (NASA-TLX, 0–100) | 33.8 ± 12.6 | 41.9 ± 14.8 | 36.5 ± 13.7 | 44.6 ± 15.2 | |
| Breaks taken during sessions (per week) | 0.6 ± 0.7 | 1.4 ± 1.1 | 0.9 ± 0.9 | 1.6 ± 1.2 | |
| Cybersickness (VR-related) | Cybersickness total score (0–20) | 2.6 ± 2.1 | 3.1 ± 2.4 | ||
| Nausea episodes during/after sessions (n, %) | 3 (9.4) | 5 (13.2) | |||
| Dizziness episodes during/after sessions (n, %) | 4 (12.5) | 6 (15.8) | |||
| Visual strain | Eye strain severity (0–10) | 2.0 ± 1.2 | 3.1 ± 1.6 | 2.5 ± 1.4 | 3.3 ± 1.7 |
| Headache after sessions (n, %) | 2 (5.4) | 4 (12.5) | 3 (8.6) | 6 (15.8) | |
| Usability & technical burden | Technical disruptions ≥1 per week (n, %) | 1 (2.7) | 5 (15.6) | 4 (11.4) | 8 (21.1) |
| Average disruptions per participant (count) | 0.2 ± 0.4 | 0.8 ± 1.0 | 0.6 ± 0.9 | 1.1 ± 1.2 | |
| Assistance requests to staff (per participant) | 0.3 ± 0.6 | 1.2 ± 1.3 | 0.9 ± 1.1 | 1.5 ± 1.5 | |
| Adverse usability incidents | Falls/near-falls while using device (n, %) | 0 (0.0) | 0 (0.0) | 0 (0.0) | 1 (2.6) |
| Privacy or unwanted contact reports (n, %) | 0 (0.0) | 0 (0.0) | 2 (5.7) | 1 (2.6) | |
| Withdrawal due to burden (n, %) | 1 (2.7) | 2 (6.3) | 1 (2.9) | 2 (5.3) |
Table 6: Burden, workload, and mild platform-related adverse symptoms. This table summarizes perceived fatigue, workload, technical disruption, assistance requests, and other mild tolerability indicators recorded during the intervention period. Continuous data are presented as mean ± standard deviation (SD), and categorical data are presented as frequency (percentage). Statistical comparisons across groups were performed using one-way analysis of variance (ANOVA) for continuous variables and Pearson’s chi-square tests for categorical variables. It is intended to characterize implementation burden and tolerability. Abbreviations: NASA-TLX = NASA Task Load Index; VLE = Virtual Learning Environment; OSP = Online Social Platform; SD = Standard Deviation.
| Event category | Specific event | Control | VLE-only | OSP-only | VLE+OSP | Typical severity | Action taken |
| (n=37) | (n=32) | (n=35) | (n=38) | (most common) | |||
| VR/VLE-related physical discomfort | Cybersickness symptoms (nausea/dizziness) | 1 (2.7) | 6 (18.8) | 1 (2.9) | 9 (23.7) | Mild–Moderate | Breaks, shorter sessions, headset refit |
| Eye strain or headache after sessions | 2 (5.4) | 5 (15.6) | 3 (8.6) | 7 (18.4) | Mild | Screen/brightness adjustment, rest | |
| Neck/shoulder discomfort (device posture) | 1 (2.7) | 4 (12.5) | 1 (2.9) | 5 (13.2) | Mild | Ergonomic coaching, seated use | |
| Technical incidents | Session interruption due to connectivity/app crash | 1 (2.7) | 5 (15.6) | 4 (11.4) | 8 (21.1) | Mild | Troubleshooting, rescheduled session |
| Login/credential lockout | 0 (0.0) | 2 (6.3) | 3 (8.6) | 3 (7.9) | Mild | Password reset, guided re-login | |
| Online social interaction risks (OSP) | Unwanted contact request/message | 0 (0.0) | 0 (0.0) | 3 (8.6) | 2 (5.3) | Mild–Moderate | Block/report, safety coaching |
| Exposure to upsetting content (news/politics/health rumors) | 1 (2.7) | 0 (0.0) | 4 (11.4) | 3 (7.9) | Mild | Content filtering, moderator guidance | |
| Misunderstanding/conflict in group chat | 0 (0.0) | 0 (0.0) | 2 (5.7) | 2 (5.3) | Mild | Moderator de-escalation, ground rules | |
| Privacy and data-security events | Accidental sharing of personal info in group space | 0 (0.0) | 0 (0.0) | 2 (5.7) | 1 (2.6) | Mild–Moderate | Post removal, privacy re-training |
| Suspected phishing/scam attempt (reported) | 0 (0.0) | 0 (0.0) | 1 (2.9) | 1 (2.6) | Moderate | Account review, safety checklist | |
| Withdrawals due to platform burden | Stopped platform use due to discomfort/burden | 1 (2.7) | 2 (6.3) | 1 (2.9) | 2 (5.3) | Protocol adaptation or discontinuation | |
| Serious adverse events | Severe event requiring ED/hospitalization | 0 (0.0) | 0 (0.0) | 0 (0.0) | 0 (0.0) | Severe |
Table 7: Adverse events and online risk events related to platform use. This table lists the frequency and type of platform-related adverse events, online social risk events, and the most common action taken in response. It is intended to document safety monitoring during intervention delivery.
| Outcome | Domain | Clinically/practically meaningful threshold | VLE-only vs Control: ΔΔ (95% CI) | g | NNT* | OSP-only vs Control: ΔΔ (95% CI) | g | NNT* | VLE+OSP vs Control: ΔΔ (95% CI) | g | NNT* |
| MoCA (0–30) | Global cognition (Primary) | ≥ +1 point | +0.9 (0.3 to 1.5) | 0.55 | 5.6 | +0.2 (−0.4 to 0.8) | 0.12 | 11.9 | +1.1 (0.6 to 1.7) | 0.71 | 4.6 |
| DSST correct | Processing speed/attention (Primary) | ≥ +4 correct | +3.0 (1.2 to 4.8) | 0.6 | 6 | +1.1 (−0.7 to 2.9) | 0.22 | 10.4 | +4.3 (2.5 to 6.1) | 0.86 | 4.2 |
| UCLA Loneliness (20–80) | Loneliness (Primary) | ≤ −4 points | −2.0 (−3.6 to −0.4) | −0.46 | 7.3 | −3.5 (−5.2 to −1.8) | −0.78 | 4.9 | −5.0 (−6.6 to −3.4) | −1.05 | 3.6 |
| SAFS (9–45) | Social participation (Primary) | ≥ +3 points | +1.5 (0.3 to 2.7) | 0.45 | 7.8 | +3.8 (2.4 to 5.2) | 0.92 | 4.1 | +4.3 (2.9 to 5.7) | 1.09 | 3.5 |
| Trail Making Test–A (sec) | Executive/attention (Secondary) | ≥ −6 sec | −4.2 (−7.8 to −0.6) | −0.40 | 8.9 | −2.1 (−5.8 to 1.6) | −0.18 | 12.6 | −6.8 (−10.3 to −3.3) | −0.64 | 6.2 |
| Category Fluency (animals/min) | Language/semantic access (Secondary) | ≥ +2 words | +1.6 (0.3 to 2.9) | 0.42 | 8.1 | +0.8 (−0.5 to 2.1) | 0.21 | 11.8 | +2.4 (1.1 to 3.7) | 0.62 | 6 |
| GDS-15 (0–15) | Depressive symptoms (Secondary) | ≤ −2 points | −1.2 (−2.1 to −0.3) | −0.38 | 9.5 | −1.6 (−2.5 to −0.7) | −0.52 | 7.1 | −2.1 (−3.0 to −1.2) | −0.69 | 5.6 |
| EQ-5D-5L index | Health-related QoL (Secondary) | ≥ +0.05 | +0.03 (0.00 to 0.06) | 0.28 | 11.3 | +0.04 (0.01 to 0.07) | 0.36 | 9.4 | +0.06 (0.03 to 0.09) | 0.52 | 7.4 |
| SUS score (0–100) | Usability (Secondary) | ≥ 68 “acceptable” | +6.4 (2.1 to 10.7) | 0.56 | +7.8 (3.6 to 12.0) | 0.69 | +8.6 (4.4 to 12.8) | 0.78 | |||
| Adherence (completion %) | Implementation (Secondary) | ≥ 75% completion | +10.8 (3.2 to 18.4) | 0.62 | +6.1 (−1.4 to 13.6) | 0.34 | +8.9 (1.6 to 16.2) | 0.51 |
Table 8: Extended summary of effect-size and practical-significance indicators. This table presents an expanded outcome summary that includes effect size and practical significance framing.
Discussion
This article describes a dual-platform protocol for delivering cognitive training and structured online social participation in older adults. The representative results are presented to show how the intervention can be implemented, monitored, and tolerated across four study conditions, rather than to establish definitive efficacy. The primary novelty of this study lies in its rigorously structured four-arm architecture, which successfully operationalizes and isolates the delivery of cognitive training (VLE) and structured social participation (OSP) within a single randomized cohort (Figure 8). By integrating these previously disparate pathways into a cohesive, dual-platform framework, this protocol advances the field beyond single-domain interventions. Furthermore, it introduces a highly reproducible standard for usability-oriented onboarding and continuous digital process tracking, which are critical yet persistently underreported elements in gerontechnology trials30.
One practical implication of the present protocol is that successful implementation depends heavily on early usability support. The onboarding phase was not included as a peripheral convenience step, but as a core protocol element intended to reduce avoidable dropout related to login failure, navigation difficulty, and uncertainty about platform use32. The representative implementation data suggest that older adults were generally able to engage with both platforms after standardized setup, printed guidance, and supervised return demonstration. For researchers seeking to replicate this approach, insufficient onboarding would likely increase early attrition and introduce variation that reflects technical barriers rather than intervention exposure.
The structured moderation procedures in the OSP arm should also be regarded as essential rather than optional. In this protocol, moderation served several functions at once: maintaining interaction continuity, reducing the risk of inactivity, supporting reciprocity, and managing privacy or distress-related events. This is particularly important in older adult populations, where unstructured online group spaces may become inactive, unevenly participatory, or difficult to manage without clear facilitation rules. For the same reason, the moderator guidance, weekly prompt structure, and safety escalation workflow should remain standardized across groups in future replications31.
The representative outcome patterns shown in the present manuscript should be interpreted with appropriate restraint. Descriptively, the VLE-containing arms showed larger gains in MoCA and DSST, whereas the OSP-exposed arms showed larger reductions in loneliness and larger increases in social activity frequency. The combined arm showed broader improvement across domains, but this pattern should not be taken as direct proof of a synergistic mechanism. Participants in the combined condition received greater overall intervention exposure, more platform contact, and potentially more staff attention than participants in either single-component arm. These differences represent an important interpretive constraint and should be considered when evaluating the broader pattern of representative results33.
Several methodological limitations also require explicit emphasis. First, the eligibility criteria favored participants with existing device access, home internet connectivity, and sufficient functional ability to operate digital tools independently after onboarding. As reflected in the baseline sample profile, this produced a relatively digitally ready cohort and may reduce generalizability to lower-resource, lower-literacy, or more functionally impaired older adults. Second, psychosocial outcomes relied in part on self-report measures for which participant blinding was not feasible, raising the possibility of expectancy effects or demand characteristics. Third, the adherence-stratified summaries were exploratory and post hoc, and therefore should not be interpreted as randomized evidence of dose-response or cross-platform reinforcement34.
The safety and burden findings nevertheless provide useful implementation guidance. Most reported events were mild and involved transient fatigue, visual discomfort, or technical interruption rather than severe platform-related harm. These data suggest that future users of the protocol should plan in advance for shorter sessions, additional visual adjustments, or repeated support contacts when participants show signs of strain or frustration. In this sense, troubleshooting should be treated as part of the intervention delivery framework itself rather than as a secondary operational issue. Protocol fidelity in digital studies depends not only on what tasks are assigned, but also on how barriers to continued participation are anticipated and managed35.
Taken together, the present protocol offers a reproducible structure for studying how cognitive-training and socially oriented digital components can be delivered within the same intervention framework in older adults. Its main value lies in the standardization of onboarding, implementation, monitoring, and safety procedures, together with the inclusion of representative process and outcome patterns that may inform future confirmatory trials. Subsequent studies should test the protocol in more diverse populations, examine longer-term follow-up, and evaluate whether observed cross-domain patterns remain after tighter control of exposure intensity and staff contact across study arms36.
Disclosures
The authors have nothing to disclose.
Acknowledgements
The authors thank all older adult participants for their time and continued participation in the study. Appreciation is also extended to the staff of the participating community health management institutions and senior activity centers for their assistance with recruitment and coordination. The authors further thank the technical support personnel and research assistants who contributed to onboarding, platform support, and moderation procedures. This work was supported in part by the 2024 Guangdong Provincial Education Science Planning Project (Higher Education Special Project), “Collaborative Construction of the Quality Assurance System for Higher Vocational Education in the Guangdong-Hong Kong-Macao Greater Bay Area from the Perspective of the Qualifications Framework” (Project No. 2024GXJK143). The funder had no role in study design, intervention delivery, data collection, data analysis, data interpretation, or manuscript preparation.
Funding Information:
This work was supported by two research projects as follows:
2024 Guangdong Provincial Educational Science Planning Project (Higher Education Special Program): Research on the Collaborative Construction of Higher Vocational Education Quality Assurance System in the Guangdong-Hong Kong-Macao Greater Bay Area (Grant No.: 2024GXJK143).
2024 Guangdong Provincial Project for Quality Improvement of Learning Society Construction (Continuing Education): Research and Practice on the System Design and Construction of Credit Bank for Elderly Learners in Guangdong Province (Grant No.: JXJYGC2024F306).
Materials
| Name | Company | Catalog Number | Comments |
|---|---|---|---|
| BrainHQ | Posit Science, San Francisco, CA, USA | N/A | Web-based and app-based cognitive training platform used as the Virtual Learning Environment. Select the same training modules for all participants and retain the same administrative dashboard/export format across the study. |
| Digit Span | Pearson, San Antonio, TX, USA | 100000392 | Administer using the WAIS-IV Digit Span materials. Use the same language version and administration rules at T0, T1, and T2. |
| Digit Symbol Substitution Test | Pearson, San Antonio, TX, USA | 100000392 | Administer using the WAIS-IV Coding materials. This is the cleanest way to document the DSST source in a reproducible manner. |
| eHealth Literacy Scale (eHEALS) | Norman and Skinner / JMIR Publications | N/A | 8-item self-report eHealth literacy measure. Use a single validated language version throughout the study. |
| EQ-5D-5L | EuroQol Research Foundation, Rotterdam, the Netherlands | N/A | Use the officially licensed adult EQ-5D-5L language version for the study site. Record the exact language version used in the methods section. |
| IBM SPSS Statistics | IBM Corp., Armonk, NY, USA | N/A | Version 29.0.x. Use for descriptive statistics, linear mixed models, and primary tabulation. Report the exact installed subversion in the final manuscript if available. |
| Montreal Cognitive Assessment (MoCA) | MoCA Cognition, Montréal, QC, Canada | N/A | Use the official paper version, Version 8.1, in the same language across all assessments. Follow official administration and scoring instructions. |
| NASA Task Load Index (NASA-TLX) | NASA Ames Research Center, Moffett Field, CA, USA | N/A | Use the official NASA-TLX instrument as the pre-specified workload and burden measure. Do not substitute a simplified checklist. |
| Patient Health Questionnaire-9 (PHQ-9) | Pfizer Inc., New York, NY, USA | N/A | 9-item depression screening questionnaire. Use one licensed/authorized language version consistently across the study. |
| R | R Foundation for Statistical Computing, Vienna, Austria | N/A | Version 4.5.3. Use for sensitivity analyses, reproducible scripts, and figure generation if needed. |
| REDCap | Vanderbilt University / REDCap Consortium, Nashville, TN, USA | N/A | Secure web application for study database management, eCRF construction, and survey/data capture. Use the institutional deployment available to the study team. |
| Social Activity Frequency Scale | Study investigators | N/A | Study questionnaire used to quantify social participation frequency. The complete item set and scoring instructions should be uploaded as a supplemental file for reproducibility. |
| System Usability Scale (SUS) | John Brooke | N/A | 10-item usability questionnaire. Use one language version consistently at the post-intervention assessment. |
| Trail Making Test Part B | Various standardized paper forms | N/A | Use a standardized paper TMT Part B form and keep the same administration instructions, timing rules, and discontinuation rules across all timepoints. |
| UCLA Loneliness Scale, Version 3 | Daniel W. Russell | N/A | 20-item loneliness measure. Use Version 3 consistently and preserve the same score direction throughout the manuscript. |
| Tencent Mobile International Limited / Tencent Inc., Shenzhen, China | com.tencent.mm | Messaging and group-interaction platform used as the Online Social Platform. Supports group chat, asynchronous posting, and group video interaction. |
References
- Livingston, G., et al. Dementia prevention, intervention, and care: 2020 report of the lancet commission. Lancet. 396 (10248), 413-446 (2020).
- Who. Global report on ageism. , World Health Organization. Geneva. (2021).
- Leigh-Hunt, N., et al. An overview of systematic reviews on the public health consequences of social isolation and loneliness. Public Health. 152, 157-171 (2017).
- Holt-Lunstad, J. The major health implications of social connection. Curr Dir Psychol Sci. 30 (3), 251-259 (2021).
- Santini, Z. I., et al. Social disconnectedness, perceived isolation, and symptoms of depression and anxiety among older americans (nshap): A longitudinal mediation analysis. Lancet Public Health. 5 (1), e62-e70 (2020).
- de Maio Nascimento, M., da Silva Neto, H. R., de Fátima Carreira Moreira Padovez, R., Neves, V. R. Impacts of social isolation on the physical and mental health of older adults during quarantine: A systematic review. Clin Gerontol. 46 (5), 648-668 (2023).
- Sutin, A. R., Stephan, Y., Luchetti, M., Terracciano, A. Loneliness and risk of dementia. J Gerontol B Psychol Sci Soc Sci. 75 (7), 1414-1422 (2020).
- Penninkilampi, R., Casey, A. N., Singh, M. F., Brodaty, H. The association between social engagement, loneliness, and risk of dementia: A systematic review and meta-analysis. J. Alzheimers Dis. 66 (4), 1619-1633 (2018).
- Lara, E., et al. Does loneliness contribute to mild cognitive impairment and dementia? A systematic review and meta-analysis of longitudinal studies. Ageing Res Rev. 52, 7-16 (2019).
- Spreng, R. N., et al. The default network of the human brain is associated with perceived social isolation. Nat Commun. 11 (1), 6393(2020).
- Bzdok, D., Dunbar, R. I. The neurobiology of social distance. Trends Cogn Sci. 24 (9), 717-733 (2020).
- Xiong, Y., Hong, H., Liu, C., Zhang, Y. Q. Social isolation and the brain: Effects and mechanisms. Mol Psychiatry. 28 (1), 191-201 (2023).
- Reijnders, J., van Heugten, C., van Boxtel, M. Cognitive interventions in healthy older adults and people with mild cognitive impairment: A systematic review. Ageing Res Rev. 12 (1), 263-275 (2013).
- Barbosa Neves, B., Franz, R., Judges, R., Beermann, C., Baecker, R. Can digital technology enhance social connectedness among older adults? A feasibility study. J Appl Gerontol. 38 (1), 49-72 (2019).
- Hassan, Z. A., Schattner, P., Mazza, D. Doing a pilot study: Why is it essential? Malays Fam Physician. 1 (2-3), 70-73 (2006).
- Martin, A., O’Connor, S., Jackson, C. A scoping review of gaps and priorities in dementia care in europe. Dementia (London). 19 (7), 2135-2151 (2020).
- Ienca, M., Vayena, E. On the responsible use of digital data to tackle the covid-19 pandemic. Nat Med. 26 (4), 463-464 (2020).
- Sharma, I., Srivastava, J., Kumar, A., Sharma, R. Cognitive remediation therapy for older adults. J Geriatr Ment Health. 3 (1), 57-65 (2016).
- Gavelin, H. M., et al. Combined physical and cognitive training for older adults with and without cognitive impairment: A systematic review and network meta-analysis of randomized controlled trials. Ageing Res Rev. 66, 101232(2021).
- Bahar-Fuchs, A., Martyr, A., Goh, A. M., Sabates, J., Clare, L. Cognitive training for people with mild to moderate dementia. Cochrane Database Syst. Rev. 3 (3), CD013069(2019).
- Shapira, N., Barak, A., Gal, I. Promoting older adults' well-being through internet training and use. Aging Ment Health. 11 (5), 477-484 (2007).
- Cotten, S. R., Ford, G., Ford, S., Hale, T. M. Internet use and depression among retired older adults in the united states: A longitudinal analysis. J Gerontol B Psychol Sci Soc Sci. 69 (5), 763-771 (2014).
- Ramírez-Correa, P. E., Arenas-Gaitán, J., Rondán-Cataluña, F. J., Grandón, E. E., Ramírez-Santana, M. Adoption of social networking sites among older adults: The role of the technology readiness and the generation to identifying segments. PLoS One. 18 (4), e0284585(2023).
- Seifert, A., Reinwand, D. A., Schlomann, A. Designing and using digital mental health interventions for older adults: Being aware of digital inequality. Front Psychiatry. 10, 568(2019).
- Lepkowsky, C. M., Arndt, S. The internet: Barrier to health care for older adults. Pract Innov. 4 (2), 124(2019).
- Hawley-Hague, H., Boulton, E., Hall, A., Pfeiffer, K., Todd, C. Older adults' perceptions of technologies aimed at falls prevention, detection or monitoring: A systematic review. Int J Med. Inform. 83 (6), 416-426 (2014).
- Fang, M. L., et al. Exploring privilege in the digital divide: Implications for theory, policy, and practice. Gerontologist. 59 (1), e1-e15 (2019).
- Kelly, M. E., et al. The impact of social activities, social networks, social support and social relationships on the cognitive functioning of healthy older adults: A systematic review. Syst Rev. 6 (1), 259(2017).
- Kuiper, J. S., et al. Social relationships and risk of dementia: A systematic review and meta-analysis of longitudinal cohort studies. Ageing Res Rev. 22, 39-57 (2015).
- Yi, Q., Liu, Z., Zhong, F., Selvanayagam, V. S., Cheong, J. P. G. Cognitive and physical impact of combined exercise and cognitive intervention in older adults with mild cognitive impairment: A systematic review and meta-analysis. PLoS One. 19 (10), e0308466(2024).
- Han, K., Tang, Z., Bai, Z., Su, W., Zhang, H. Effects of combined cognitive and physical intervention on enhancing cognition in older adults with and without mild cognitive impairment: A systematic review and meta-analysis. Front Aging Neurosci. 14, 878025(2022).
- Czaja, S. J. Long-term care services and support systems for older adults: The role of technology. Am Psychol. 71 (4), 294(2016).
- Evans, I. E., Martyr, A., Collins, R., Brayne, C., Clare, L. Social isolation and cognitive function in later life: A systematic review and meta-analysis. J Alzheimers Dis. 70 (s1), S119-S144 (2019).
- Wildenbos, G. A., Peute, L., Jaspers, M. Aging barriers influencing mobile health usability for older adults: A literature based framework (mold-us). Int J Med Inform. 114, 66-75 (2018).
- Hunsaker, A., Hargittai, E. A review of internet use among older adults. New Media Soc. 20 (10), 3937-3954 (2018).
- Ramsetty, A., Adams, C. Impact of the digital divide in the age of covid-19. J Am Med Inform Assoc. 27 (7), 1147-1148 (2020).