This study presents a continuous centrifugal microfluidic workflow for efficient isolation and identification of circulating rare cells. The system enables precise liquid control and minimizes cell loss, allowing simultaneous analysis of multiple CRC subtypes, including CTCs and cCAFs, for improved diagnostic accuracy.
Method Article
Robust Isolation and Multiplexed Identification of Circulating Rare Cells via Continuous Centrifugal Microfluidics and Hydrogel Immunocytochemistry
In This Article
Summary
Abstract
Circulating rare cells (CRCs), including circulating tumor cells (CTCs) and circulating cancer-associated fibroblasts (cCAFs), are promising biomarkers for cancer diagnosis and prognosis. However, their extremely low abundance and phenotypic heterogeneity make efficient isolation and multiparametric analysis technically challenging. Here, we present a continuous centrifugal microfluidic workflow for the sequential isolation and identification of CRCs from whole blood. The cartridge comprises five interconnected chambers with controllable valves that enable precise handling of density gradient medium and blood layers during centrifugation. Based on a previously validated enrichment platform, the present workflow integrates hydrogel-based cell immobilization with multiplexed immunocytochemistry to support the downstream identification and characterization of multiple CRC subtypes, including CTCs and cCAFs. Following isolation, cells are immobilized within a hydrogel matrix to support cell retention during repeated immunostaining and imaging-based analysis. Using this workflow, both CTCs and cCAFs were identified from the same sample, demonstrating the feasibility of integrated analysis of multiple circulating rare-cell populations within a single liquid-biopsy workflow. This platform provides a practical and reproducible approach for downstream rare-cell characterization in liquid biopsy applications.
Introduction
Circulating rare cells (CRCs) are defined as cells that exist in the bloodstream at extremely low frequencies compared to normal blood components such as red blood cells, white blood cells, and platelets. CRCs originate from diverse sources, such as byproducts of biological processes, tissue remodeling, wound healing, or vascular injury. Representative examples include circulating endothelial cells, circulating fetal cells, megakaryocytes, erythroblasts, and various progenitor or stem cells1,2. While the existence of CRCs alone does not necessarily reflect a pathological state, elevated levels frequently indicate abnormal physiological or pathological conditions3,4. Accordingly, sensitive detection and characterization of CRCs provide valuable insights into dynamic physiological and pathological processes occurring within the body.
Among CRC subtypes, circulating tumor cells (CTCs) and circulating cancer-associated fibroblasts (cCAFs) are major biomarkers of cancer. CTCs provide direct evidence of tumor cell dissemination and are widely studied5. Changes in CTC enumeration are often associated with early detection, prognosis, and monitoring of therapeutic response6. In parallel, cCAFs represent stromal components shed into the bloodstream, reflecting tumor microenvironment interactions and the formation of the pre-metastatic niche7. However, compared to CTCs, research on cCAFs remains limited, and their clinical utility is only beginning to be explored8.
CTCs and cCAFs may provide complementary biological information in liquid biopsy, as CTCs reflect tumor cell dissemination and metastatic traits, whereas cCAFs may represent stromal remodeling and tumor microenvironment-associated progression signals. Simultaneous analysis of these two circulating rare-cell populations may therefore support a more integrated understanding of cancer progression than analysis of either population alone. However, their clinical and translational utility is substantially limited by their extreme rarity in peripheral blood, the absence of universally accepted markers of cCAFs, and the significant heterogeneity of marker expression across cell subpopulations, which together hinder reliable identification. Thus, minimizing cell loss during enrichment and identification is critical to ensure robust and reliable analysis. Moreover, comprehensive characterization of the functional and marker diversity of CTCs and cCAFs is essential for elucidating their roles in metastasis and for developing clinically meaningful biomarkers8,9.
Here, we present a method for the simultaneous isolation of cCAFs and CTCs10,11, combined with multi-marker identification using hydrogel encapsulation of rare cells immunocytochemistry (ICC)12. Current CRC isolation methods often face technical limitations, including cell loss during multistep processing, restricted capture of phenotypically heterogeneous cells, and selection bias associated with marker-dependent enrichment strategies. In contrast, the continuous centrifugal microfluidic platform used in this study is based on a comprehensive enrichment framework, thereby reducing reliance on conventional positive-selection markers. The analytical and workflow performance of the underlying enrichment platform has been described in our previous studies9.
Building on that validated platform, the present study focuses on the integration of hydrogel-based cell immobilization and multiplexed immunocytochemistry to enable the comprehensive isolation and identification of multiple circulating rare-cell populations, including CTCs and cCAFs, within a unified workflow. By combining enrichment, stable cell retention, and repeated staining-compatible analysis, this protocol provides a practical framework for integrated rare-cell analysis from liquid biopsy samples.
Protocol
All procedures involving human blood samples from patients and healthy donors were conducted in accordance with the guidelines of the Institutional Review Board (IRB) of Severance Hospital. The study protocol was approved by the Institutional Review Board of Severance Hospital (IRB No. 4-2013-0059). The reagents and the equipment used are listed in the Table of Materials.
1. Device preparation
- Press the power switch to turn on the instrument.
- Engage the laser interlock switch, then turn on the laser power switch.
- Launch the operating software and confirm that the system initializes normally.
- From the main software interface, select Device Operation and choose the preset protocol for standard EDTA whole blood samples.
2. Device operation - 1st step
NOTE: Details of the inlet positions and cartridge structure are shown in Figure 1A.
- From inlet 6, add 2 mL of Reagent A (density gradient media) to the initial chamber.
- From inlet 8, add 875 µL of Reagent A to the depletion chamber.
- Mount the cartridge onto the disc rack, ensuring proper balance for centrifugation.
- Press the Door button on the CTCeptor to open the mount, then mount the disc rack onto the CTCeptor and secure it using the fixing screws.
- Press the Door button to close the mount, and run the Spin Down step using the CTCeptor software (approximately 30 s).
- After confirming that Reagent A has been transferred to the lower part of the initial chamber, release the fixing screws and remove the disc rack from the instrument while keeping the cartridge mounted.
3. Device operation - 2nd step
- Before handling blood samples, perform all procedures in a certified biological safety cabinet and wear appropriate personal protective equipment, including gloves, a lab coat, and eye protection, in accordance with institutional biosafety guidelines.
- With the cartridge removed from the instrument, inject 3 mL of blood into the initial chamber through inlet 6.
- Mount the disc rack onto the CTCeptor and secure it using the fixing screws.
- Run the RBCs Removal step using the CTCeptor software (approximately 40 min). During this step, centrifugation separates plasma, RBCs, and peripheral blood mononuclear cells (PBMCs) within the cartridge, and the PBMC-containing fraction is transferred to the next chamber for subsequent leukocyte depletion.
- After completion of the RBCs Removal step, remove the disc rack from the instrument.
4. Device operation - 3rd step
- Carefully disinfect the working area to maintain sterility.
- Vortex the Reagent B (leukocyte isolation beads) to ensure homogeneous suspension.
- Prepare the washing buffer by mixing Ca2⁺/Mg2⁺-free DPBS with 0.1% BSA and 2 mM EDTA (pH 7.4).
- Transfer the desired volume of Reagent B into a 1.5 mL tube (for example, 50 µL per cartridge).
- Add the washing buffer at five times the Reagent B volume, and mix gently by pipetting.
- Place the tube on a magnetic stand for 1 min to allow the beads in Reagent B to collect, then carefully discard the supernatant.
- Resuspend the beads in the washing buffer at a volume equal to the initial bead volume.
- Store the beads at 4 °C until use.
- Immediately before use, mix 50 µL of the prepared beads with 50 µL of DPBS, and load 100 µL of the mixture into inlet 7.
- Mount the disc rack onto the CTCeptor and secure it using the fixing screws.
- Run the WBCs Removal step using the CTCeptor software (approximately 50 min). In this programmed step, the loaded leukocyte isolation beads are mixed with the PBMC-containing fraction by shaking to promote bead–WBC binding, followed by centrifugation-based removal of the bead-bound WBC fraction.
- After completion of the WBCs Removal step, remove the disc rack from the instrument.
5. Sample recovery
- Insert a pipette tip into outlet 9 of the final chamber and resuspend the contents, then transfer the collected sample to a 15 mL tube.
- Inject 2 mL of DPBS into outlet 9, rinse the chamber thoroughly by pipetting, and transfer the wash to the same 15 mL tube.
- Repeat the washing step twice.
- Adjust the volume of the collected fluid in the 15 mL tube to 14 mL with DPBS, cap the tube, and mix gently by inversion.
- Centrifuge the tube at 380 × g for 4 min at room temperature.
- Carefully remove the supernatant, leaving approximately 1 mL, and use the remaining suspension for downstream analysis.
6. Identification of CRCs
- For preparing the pre-hydrogel polymer, mix Ca2⁺/Mg2⁺-free DPBS, hydrogel pellicle immunocytochemistry (HypICC) solution A (prepolymer), and Photoinitiator at a ratio of 80:20:1.
- Mix 870 µL of CRC suspension with 270 µL pre-hydrogel polymer.
- Transfer the mixture to the HypICC chamber and centrifuge at 500 × g for 5 min to allow the cells to settle in the platform.
- Insert the thickness controller into the HypICC chamber to set the hydrogel thickness.
- Irradiate the sample with UV light (365 nm) for 20–30 s from the bottom to cross-link the hydrogel layer.
- Remove the thickness controller and wash the hydrogel-encapsulated cells three times with DPBS.
- Fix the cells with 4% paraformaldehyde (PFA) for 10 min at room temperature, then wash the samples three times with DPBS, 10 min each.
- Permeabilize the cells with 0.05% Triton X-100 for 10 min at room temperature. Then wash the samples three times with DPBS, 10 min each.
- Block the samples with 2% BSA for 1 h at room temperature.
- Incubate the samples with primary antibodies overnight at 4 °C.
- Wash the samples five times with DPBS, 20 min per wash.
- Stain the nuclei with Hoechst for 10 min at room temperature, then wash the samples three times with DPBS, 10 min each.
- If required, secondary antibody incubation can be performed under the same overnight conditions as the primary antibody incubation.
- Perform fluorescence microscopy imaging and identify CRCs.
7. Multiplex immunostaining of CRCs
- After immunostaining and imaging, CRCs can undergo an additional round of antibody staining following quenching.
- Prepare a quenching solution consisting of 4.5% H2O2 and 24 mM NaOH in PBS.
- Remove the DPBS from the HypICC chamber and add the quenching solution.
- Incubate for 1 h at room temperature under white light with shaking.
- Replace the quenching solution and incubate for an additional 1 h under the same conditions.
- Wash the samples four times with DPBS for 10 min per wash.
- Restart the immunostaining procedure from the blocking step using 2% BSA.
Results
Figure 1A shows an image of a single cartridge used for rare cell isolation. The cartridge consists of five individual chambers connected by microchannels and controllable valves that regulate liquid flow. The structure of the cartridge is as follows: (1) a plasma chamber that collects plasma separated from whole blood; (2) an initial chamber in which whole blood is separated into plasma, red blood cell, and PBMC layers; (3) a mixing chamber where isolated PBMCs are combined with leukocyte isolation beads; (4) a depletion chamber that removes leukocytes; (5) a final chamber for collecting the enriched rare cell fraction; (6) an inlet for loading whole blood; (7) an inlet for introducing leukocyte isolation beads; (8) an inlet for introducing density gradient media; and (9) a collection hole that serves as the outlet for retrieving enriched cells.
The initial chamber has a sloped structure designed to prevent red blood cell (RBC) contamination after density-based separation (Figure 1B). During processing, density gradient media were first loaded into the initial chamber, and the Spin Down step was performed (Figure 1C-i), followed by injection of whole blood (Figure 1C-ii). The disc was then centrifuged until distinct layers of RBCs, PBMCs, and plasma were formed (Figure 1C-iii). After centrifugation, the plasma layer was removed (Figure 1C-iv), and the PBMC fraction was automatically transferred to the next chamber (Figure 1C-v). Subsequently, leukocyte isolation beads were introduced to label leukocytes (Figure 1C-vi), which were then directed to the depletion chamber for leukocyte removal (Figure 1C-vii). Finally, the CRCs were collected in the final chamber (Figure 1C-viii).
To evaluate the performance of the rare cell isolation cartridge, recovery rates were measured (Figure 2). To mimic CTCs and cCAFs, cancer cell line (PC-9) and fibroblast cell line (IMR-90) were spiked into healthy donor blood samples. Prior to spiking, cells were pre-labeled with green CMFDA (5-Chloromethylfluorescein Diacetate) to enable independent fluorescence-based tracking. After spiking, the rare cell isolation disc was operated according to the standard protocol, and captured cells were evaluated by fluorescence microscopy. The recovery rate was 90.03% (CV: 5.79%) for PC-9 cells and 86.1% (CV: 3.77%) for IMR-90 cells, demonstrating that the platform supports efficient isolation of both tumor-like and fibroblast-like rare cell models under the same workflow conditions (Figure 2A). Regarding purity, the WBC depletion rate was calculated using the following equation:
(1-(Final WBC counts)/(Initial WBC counts))×100%
Using this calculation, the depletion rate was 97.22% (CV: 1.29%) (Figure 2B). Although this result indicates effective leukocyte depletion, further improvement in purity may be required for certain downstream applications. To address this limitation, a double-step process was evaluated, in which the sample collected after the first platform run was reloaded into the system and processed a second time (Figure 2C). Under this double-step condition, the recovery rate decreased to 79.88% (CV: 3.59%), whereas the WBC depletion rate increased to 99.02% (CV: 0.31%). This result indicates a trade-off between recovery and depletion performance. Therefore, when higher purity is required, WBC depletion efficiency can be further improved by introducing an additional processing step, although this improvement is accompanied by a partial loss in recovery rate. Interestingly, fluorescence images of the isolated cells stained with green CMFDA and DAPI showed that the fibroblast cell line exhibited greater size heterogeneity than the cancer cell line (Figure 2D,E). This observation further supports that the platform can isolate cells with diverse size distributions.
After cell isolation, the collected cells were stained using specific immunofluorescence markers. The overall staining protocol is illustrated in Figure 3A. Each chamber consists of an upper funnel and a lower glass plate. First, the cell–prepolymer mixture was transferred into the funnel and centrifuged to position the cells onto the glass surface. A thickness controller was then inserted to define the gel height. Subsequently, the sample was exposed to UV light, which induced hydrogel polymerization and immobilized the cells. After polymerization, the thickness controller was removed, and the washing steps were performed to eliminate unreacted residues. Finally, conventional immunofluorescence staining was conducted to visualize the target markers.
To evaluate the effect of hydrogel-based cell immobilization on staining quality and cell morphology, the results were compared with those obtained using a conventional smear-based preparation method (Figure 3B). Cells prepared by the smear method showed altered morphology, likely due to drying-associated deformation stress in the immobilization process. In contrast, cells embedded in the hydrogel matrix maintained a more intact cellular morphology while allowing clear visualization of DAPI, keratin, and β-actin signals. Quantitative fluorescence analysis was performed using images acquired under identical microscope settings (Figure 3C). The DAPI signal, which is generated by a small fluorescent DNA-binding molecule, was higher in hydrogel-based ICC than in smear-based ICC. In contrast, keratin and β-actin signals were higher in smear-based ICC than in hydrogel-based ICC. Nevertheless, both preparation methods produced clearly detectable fluorescence signals for all evaluated markers, indicating that hydrogel-based ICC enables reliable immunofluorescence staining while better preserving cellular morphology.
To assess the feasibility of this workflow in a clinical setting, circulating rare-cell isolation was performed using blood samples obtained from 18 lung cancer patients, followed by immunostaining analysis. The patients had undergone surgical resection after neoadjuvant immunotherapy. cCAFs were detected in 55.6% of the patients, with counts ranging from 0 to 8 cells per sample across all patients. In contrast, CTCs were detected in two patients, with counts ranging from 0 to 1 cell per sample across all patients. Notably, in one patient sample, both CTCs and cCAFs were identified from the same blood specimen, demonstrating the capability of this workflow to simultaneously analyze multiple circulating rare-cell populations. The relatively low CTC detection rate is likely associated with the clinical context of these samples, as the patients had already received neoadjuvant treatment and undergone surgery, which may have reduced the number of circulating tumor cells in peripheral blood. These results suggest that the proposed workflow can detect circulating rare-cell populations in clinically relevant samples, while further validation using larger cohorts and pre-treatment samples will be required to more comprehensively evaluate clinical performance. Based on marker expression, CTCs were identified as keratin-positive and CD45-negative cells (Figure 4A), while keratin/CD45 double-positive cells were separately classified (Figure 4B). cCAF candidates were identified as DAPI-positive cells expressing SMA and/or FAP, selected here as commonly used stromal-associated markers in the CAF literature, and multicellular cCAF clusters were also detected (Figure 4C).
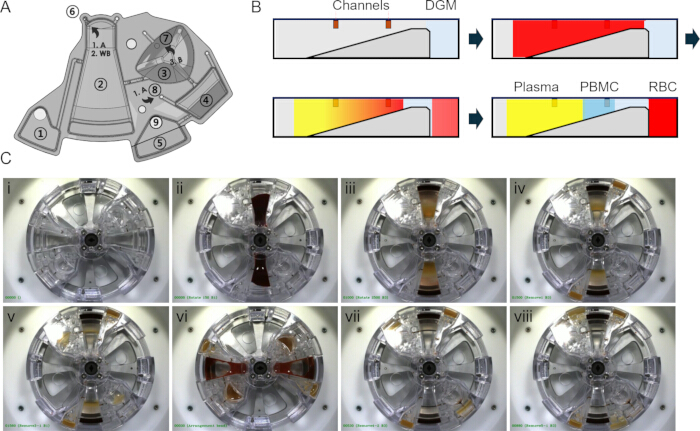
Figure 1: Workflow of CRC isolation. (A) Image of a single isolation cartridge. (B) Sequential separation of blood components within the initial chamber during centrifugation. (C) Representative images of the disc during each isolation step. Please click here to view a larger version of this figure.
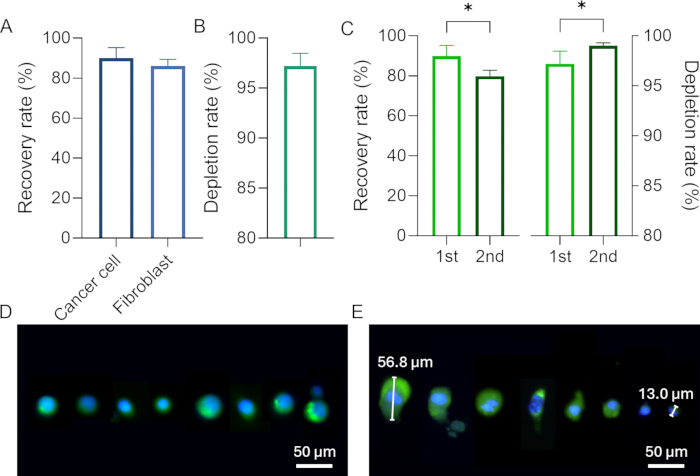
Figure 2: Recovery and WBC depletion performance of spiked cancer and fibroblast cell lines using the rare cell isolation disc. (A) Recovery rates of spiked cancer and fibroblast cell lines processed under the same workflow conditions. (B) WBC depletion rate calculated from the initial and final WBC counts. (C) Recovery and WBC depletion rates after single-step and double-step processing. For double-step processing, the sample collected after the first run was reloaded into the platform and processed a second time. (D) Cancer cells and (E) fibroblast cells were stained with green CMFDA and DAPI to visualize recovered cells and compare cell morphology and size distribution. Scale bars: 50 µm. Please click here to view a larger version of this figure.
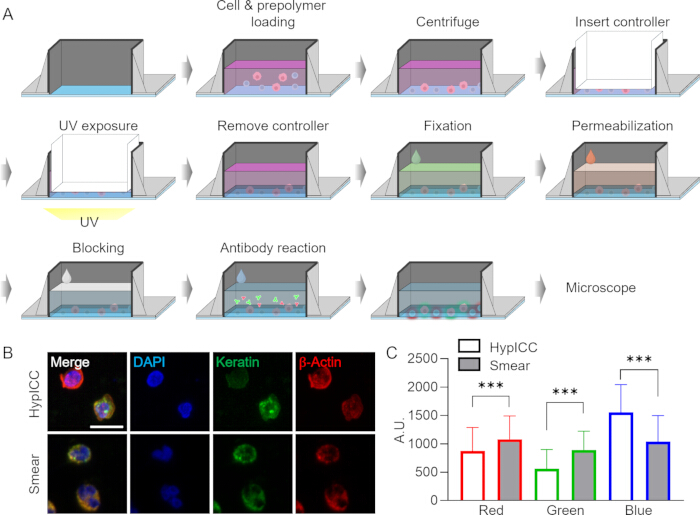
Figure 3: ICC workflow for circulating rare cells. (A) Schematic illustration of the ICC process, including hydrogel formation, UV polymerization, and immunostaining. (B) Representative fluorescence images of isolated cells stained with DAPI, keratin, and β-actin after conventional smear-based ICC and hydrogel-based ICC. Scale bar = 10 µm. (C) Quantitative comparison of fluorescence intensity for DAPI, keratin, and β-actin between smear-based ICC and hydrogel-based ICC. Please click here to view a larger version of this figure.
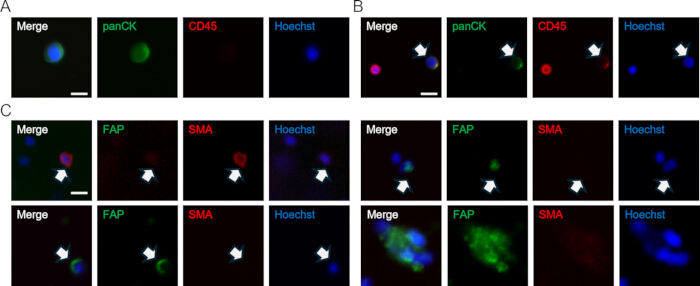
Figure 4: Representative ICC images of circulating rare cells. (A) CTC, (B) keratin/CD45 double-positive cell, and (C) cCAFs identified in clinical blood samples from lung cancer patients. Scale bar = 10 µm. Please click here to view a larger version of this figure.
Discussion
CRCs are important biomarkers with potential value for both cancer diagnosis and prognosis. To improve the clinical utility of CRC analysis, however, it is important to capture a broader range of phenotypically diverse CRC populations and to support parallel multiparametric characterization13. In addition, growing evidence in onco-immunology indicates that immune components and the tumor microenvironment play critical roles in shaping therapeutic response, highlighting the need to move beyond tumor-cell-centered information alone14. Together, these considerations support the development of integrated CRC analysis workflows that better reflect the complex cellular interactions associated with cancer progression and treatment response.
CRC isolation approaches are often optimized for a single target population or are not readily configured for integrated downstream analysis of multiple circulating rare-cell subtypes within a single workflow. The continuous centrifugal microfluidic enrichment platform used in this study has been previously validated for automated rare-cell enrichment performance. Building on that established platform, the present study focuses on the practical integration of hydrogel-based cell immobilization and multiplexed immunocytochemistry to support the simultaneous identification and characterization of CTCs and cCAFs. The main contribution of the present work is therefore not to re-establish platform-level benchmarking, but to demonstrate a unified downstream workflow that enables stable cell retention, repeated staining, and imaging-based analysis of heterogeneous circulating rare-cell populations.
To address these limitations, we developed a comprehensive CRC isolation and identification workflow based on continuous centrifugal microfluidics. This platform enables precise valve control and accurate liquid-layer extraction, thereby supporting rare-cell recovery while reducing operator variability and hands-on time. Its closed and automated design further enhances reproducibility and lowers contamination risk, making it suitable for translational and clinical research applications. CRCs isolated using this workflow retained morphological integrity and marker specificity, enabling discrimination between CTCs and cCAFs. In the present workflow, hydrogel-based immobilization was incorporated to support cell retention during repeated immunostaining, consistent with our previous study describing reduced cell loss during rare-cell handling10.
A limitation of the current system is the restricted processing volume (up to 12 mL per disc), which may limit sensitivity for samples with very low CRC counts. The workflow currently supports fluorescent immunostaining; however, additional adaptation will be required for downstream genomic or transcriptomic assays. Nonetheless, the modular chamber design allows integration of RNA stabilization reagents or coupling with automated imaging systems, thereby enabling further extension to downstream genomic analyses.
Overall, this workflow provides a simple and reproducible approach for isolating and characterizing multiple CRC subtypes within a single run. It offers a robust platform for downstream molecular and morphological analyses and holds promise for future clinical applications in precision oncology. Although the simultaneous analysis of CTCs and cCAFs may provide complementary insight into tumor-intrinsic and stromal-associated aspects of circulating disease biology, the specific clinical utility of this approach, including its relevance to treatment monitoring, metastatic risk assessment, or therapy-response evaluation, remains to be established in larger patient cohorts.
Disclosures
The authors declare the following competing financial interest(s): J.L. and M.S.K. have financial interests in CTCELLS Inc.
Acknowledgements
This manuscript was supported by the Korea Ministry of Science and ICT (2022R1A2C2091870).
Materials
| Name | Company | Catalog Number | Comments |
|---|---|---|---|
| 15 mL Conical Tube | SPL | 50015 | |
| 16% Formaldehyde (w/v), Methanol-free | Thermo Scientific | 28908 | |
| Alexa Fluor 488 AffiniPure Donkey Anti-Rabbit IgG (H+L) | Jackson immunoresearch | 711-545-152 | |
| Alexa Fluor 594 AffiniPure Donkey Anti-Goat IgG (H+L) | Jackson immunoresearch | 705-585-003 | |
| Bovine Serum Albumin | GenDepot | A0100-010 | |
| CD45 antibody | Biolegend | 304060 | |
| CellTracker Green CMFDA | Invitrogen | C7025 | |
| CTCD | CTCELLS | CTD-C103 | Disc cartridge |
| CTCD rack | CTCELLS | CTDR-CM3 | Disc rack |
| CTCeptor | CTCELLS | CTM-C2203 | CTCeptor |
| CTR-S Reagent A | CTCELLS | CTR-S1001 | density gradient media |
| CTR-S Reagent B | CTCELLS | CTR-S1002 | leukocyte isolation beads |
| FAP antibody | Invitrogen | PA5-99313 | |
| Hoechst 33342 | Thermo Scientific | 62249 | |
| HypICC Photoinitiator | CTCELLS | CTR-G1002 | |
| HypICC Solution A | CTCELLS | CTR-G1001 | |
| HypICC Unit | CTCELLS | CTH-V01 | HypICC chamber |
| Latex glove | Ansell | 93743080 | |
| Magnetic stand | Fabricated in-house using a 3D printer | ||
| Manual Pipetting (0.5-10 µL) | Eppendorf | 3120000020 | |
| Manual Pipetting (100-1000 µL) | Eppendorf | 3120000062 | |
| Manual Pipetting (10-100 µL) | Eppendorf | 3120000046 | |
| Manual Pipetting (20-200 µL) | Eppendorf | 3120000054 | |
| Manual Pipetting (2-20 µL) | Eppendorf | 3120000038 | |
| pancytokeratin antibody | Invitrogen | 53-9003-82 | |
| PBS (Phosphate Buffered Saline Solution) | Welegene | LB001-02 | |
| SMA antibody | Invitrogen | PA5-18292 | |
| Tip, 10 µL | TipOne | 9104020333 | |
| Tip, 1250 µL | TipOne | 9104020740 | |
| Tip, 200 µL | TipOne | 9104020422 | |
| Triton X-100 | Signma | X100-100ML | |
| Whole Blood | Stored at 4-8 °C by collecting in EDTA | ||
| β actin antibody | abcam | ab8226 |
Reprints and Permissions
This article has been published
Video Coming Soon