This protocol presents an optimized method for isolating the epithelial lining of the adult female mouse urethra for downstream analyses, including flow cytometry, immunostaining, and organoid culture. Methods yielded enriched, viable urethral epithelial cells, as evidenced by flow cytometry analysis, whole-mount imaging, and efficient organoid formation.
Method Article
An Optimized Method To Isolate Female Mouse Urethral Epithelium For Single-Cell And Immunofluorescence Analysis
In This Article
Summary
Abstract
The urethra, lined by epithelial cells, serves as the conduit for urine outflow from the body. The epithelial lining of the urethra comprises distinct cell types with gene signatures indicative of roles in antimicrobial and immune defense. Resident macrophages embedded in the urethral epithelial layer represent a transcriptionally distinct subtype with purported roles in immune surveillance and antigen presentation. Urinary pathogens ascend up the urethra to reach the bladder. A study of the urethral epithelial lining and associated immune cells will shed light on host defense mechanisms in the lower urinary tract. A central goal of this protocol is to provide optimized methods for dissecting the female mouse urethra and isolating the epithelial lining for downstream analyses. The protocol describes an optimized method for isolating epithelial tissue from the female mouse urethra by gentle enzymatic and mechanical separation. Subsequent to epithelial isolation, methods for gentle enzymatic digestion of isolated urethral epithelium and associated immune cells to obtain high-viability single-cell suspensions are described. The protocol also details methods for flow cytometry analysis of the isolated mouse urethral epithelial cells and epithelial-associated immune cells. Additionally, methods to generate stratified 3D urethral epithelial organoids from isolated epithelial cells are presented here. The protocol also details an optimized method for whole-mount immunostaining of urethral epithelial sheets, which can be used to observe the morphology and molecular structures of mouse urethral epithelium and associated immune cells. Overall, the methods described here for isolation and single-cell digestion of mouse urethral epithelial cells enable downstream analyses, including immunostaining, flow cytometry, organoid generation, and single-cell RNA-sequencing.
Introduction
The mouse lower urinary tract (LUT) consists of two parts: the bladder and the urethra. During embryonic stages, the structures of the LUT develop from the cloaca, a transient endoderm-derived structure located at the caudal hindgut. The ventral portion of the cloaca, the urogenital sinus, forms the bladder anteriorly and the urethra posteriorly1. The lining of the bladder is well studied. It forms a tight barrier against urine components through apical crystalline plaques comprised of uroplakin proteins2,3,4. While the bladder lining is a transitional epithelium, the urethra shows differences in epithelial architecture from the bladder neck to the distal urethral opening. Additionally, the urethra shows sexual dimorphism in epithelial structures and cellular architecture. The male mouse urethra is comprised of transitional epithelium at the bladder neck, followed by columnar and stratified epithelium. The female mouse urethra is lined by transitional epithelium at the bladder neck and multi-layered stratified non-squamous epithelium dotted by small ducts ending in secretory glands towards the distal end5.
Females are more susceptible to urinary tract infections (UTIs), predominantly caused by uropathogenic bacteria that ascend from the gut through the urethra to infect the bladder6. The urethra is the first surface in the LUT that comes in contact with ascending urinary pathogens. The function of urethral epithelial cells, especially their role as an active immunological barrier, has been understudied. Recent work from the same group provided a single-cell resolution spatial map of the adult female mouse urethra5. It identified a triple-layered urethral lining with basal, intermediate, and apical cells. Interspersed in the epithelial lining are rare neuroendocrine cells5,7. Towards the middle of the urethra, small ducts branch from the main trunk of the urethra, ending in clusters of secretory glands, embedded in the stromal compartment of the urethra. Transcriptomic data revealed that the epithelial cells in the urethra express immunomodulatory and antimicrobial genes that may shape host defense5. Studying the properties and attributes of urethral epithelial cells related to their defense potential and immunomodulatory functions may provide novel strategies to combat UTIs.
Using the mouse to study the urethral epithelium allows temporal studies and investigation of sexual dimorphism. Given the similarities of the mouse to the human in terms of cellular architecture of the bladder and urethra1, the mouse has been extensively used to study embryonic development of the lower urinary tract1,8,9. Mice have also been used in transurethral instillation models to study UTI caused by urinary pathogens10,11,12. Lower urinary tract tissue is difficult to access in patients unless undergoing resection for cancer or other disorders. A source of consistent, healthy human tissue is difficult to access and the mouse provides a useful model to investigate tissues in the lower urinary tract for studies on tissue homeostasis, repair and response to inflammatory insults. The female mouse and human urethral lining are both comprised of transitional epithelium at the bladder neck and stratified non-squamous, non-keratinized epithelium towards the distal end. Squamous epithelium is observed at the distal end of the human female urethra, although variability is observed in human female urethral lining with age5,13. Although comparisons of the urethral lining at the transcriptome level have not been carried out between the human and mouse urethra, the mouse represents a useful model to capture epithelial patterning, epithelial-immune interactions, and response to infections in the urethra.
In this study, the authors describe methods for dissection of the full-length adult female mouse urethra, isolation of urethral epithelium, and gentle enzymatic digestion to prepare single-cell suspensions. This is the first detailed protocol for the isolation and digestion of female mouse urethral epithelial tissue. The optimized protocol yields an enriched single-cell population of epithelial cells that can be utilized for various downstream analyses. As presented in the study, the authors have performed flow cytometry on a single-cell suspension of urethral epithelial cell isolates, which demonstrates the presence of viable single cells, predominantly of epithelial nature. Further, these epithelial cells are able to generate organoids in 3D culture, which resemble the stratified mouse urethral lining. The authors also demonstrate whole-mount staining of urethral epithelial sheets to study the association of epithelial-associated immune cells, specifically macrophages, with urethral epithelial cells. The methods described in this paper will aid in research on the urethral lining and its role in immune defense.
Protocol
All studies on mice were performed with the approval of the Institutional Animal Ethics Committee (INS-IAE 2022/01(R 1 M2)) and the Institutional Biosafety Committee (inStem/G-141(3)-22/DBJ) at BRIC-Institute for Stem Cell Science and Regenerative Medicine, Bengaluru. Female CD-1 or C57BL6/J mice of 6-12 weeks of age housed at the Animal Care and Resource Centre (ACRC) at the National Centre for Biological Sciences (NCBS), Bangalore Life Sciences Cluster (BLiSC) were used for this study. Mice were housed in specific pathogen-free conditions under a 12-h light-dark cycle with ad libitum food and water.
All materials used are listed in the Table of Materials.
1. Dissection and collection of the adult female mouse urethra
- Euthanize the mouse using CO2. Perform cervical dislocation as a mode of secondary euthanasia.
- Place the mouse in a supine position and spray 70% ethanol to wet the hair on the abdomen (Figure 1A).
- Lift the skin on the abdomen with a pair of forceps and make a vertical incision towards the lower body, ending at the external urethral opening (Figure 1B and 1C).
- Identify the bladder and lift it gently with forceps. In some cases, it may be filled with urine. Gently compress the bladder between the forceps to empty it.
NOTE: The bladder will appear as a bulbous structure. - Trim fat and connective tissue around the bladder using small spring scissors to expose the butterfly-shaped structure where the two pubic bones join at the pubic symphysis (Figure 1D). The urethra runs under the pubic symphysis.
- Cut at the pubic symphysis by lifting it with forceps and cutting open using small spring scissors (Figure 1E). Remove the pubic bone fragments so that the urethra can be seen running downward from the bladder (Figure 1F).
NOTE: The urethra will appear as a thin red tube that lies on the ventral surface of the vaginal wall (Figure 1G). - Pull the bladder gently upwards from the body cavity using fine forceps and run small spring scissors between the urethra and the vaginal wall to separate the urinary and reproductive tracts.
- Maintain slight tension on the bladder while cutting along the back of the urethra to separate it from the vaginal wall (Figure 1H–J). Cut all the way to the distal urethral opening to obtain the full-length mouse urethra (1.2–1.5 cm in length) (Figure 1K and 1L).
- Separate the urethra from the bladder by making a single cut at the bladder neck.
2. Isolation of urethral epithelial tissue
NOTE: The protocol to isolate epithelial sheets from the urethra was modified and optimized from a protocol to isolate endometrial epithelium14. Figure 2 shows steps for the isolation of urethral epithelial sheets from the surrounding stromal compartment (Figure 2A).
- Transfer the dissected urethras into a sterile petri dish containing fresh 1x Hanks' Balanced Salt Solution (HBSS, Ca and Mg free, details given in Supplementary Table 1).
NOTE: It is recommended to pool 4–5 urethras at this stage for epithelial separation and single-cell digestion. - Under a dissecting microscope, trim fat and connective tissue surrounding the urethra using fine-point forceps and small spring scissors (Figure 2B).
- Cut each urethra into two equal-sized pieces cross-wise and place on the top of a 100-micron nylon mesh strainer (Figure 2C–G).
- Wash the tissues by passing 1 mL of 1x HBSS (Ca and Mg-free) over the tissues.
- Transfer tissue pieces into a 1.5 mL microcentrifuge tube (MCT) (Figure 2H) containing 1 mL of 1% Trypsin (1% Trypsin, w/v to 1x sHBSSa, details given in Supplementary Table 2).
- Digest the tissue by incubating for 15–30 min on a sample rotator (30 rpm) at 4 °C.
- After incubation, remove tubes from 4 °C. Add MgCl2 (1 M MgCl2, stock prepared in 1x HBSS) to a final concentration of 10 mM and DNase I (10 mg/mL DNase I, stock prepared in 1x PBS) to a final concentration of 10 µg/mL in the same tube with the tissue pieces.
- Transfer the tube to a 37 °C hybridization oven on a sample rotator to incubate for 15–30 min.
NOTE: The incubation times for trypsin at 4 °C and 37 °C can be adjusted based on the downstream application. It is preferable to use 15-minute incubation times for whole-mount staining and 30-minute incubation for single-cell digestion. - Transfer the tissues to a 1.5 mL MCT containing 10% sheep serum in 1x HBSS (Ca and Mg free) to quench trypsin activity.
- Transfer urethral tissues into a new tube containing ice-cold 1x HBSS (Ca and Mg free). Then transfer to a sterile petri dish containing ice-cold 1x HBSS.
- Using two fine-point forceps, squeeze out the epithelium from the urethra. Hold one end of the urethral piece using one pair of forceps.
- With the other hand, squeeze the urethral piece between the prongs of the forceps, passing along the entire length of the piece to squeeze out the epithelium. Repeat this for the remaining urethral fragments in the dish to isolate the epithelium (Figure 2I–J).
NOTE: Upon mechanical separation, a thin layer of transparent epithelial tissue will be extruded from the lumen of the urethra. The urethral epithelium can be identified as thin, sheet-like tissue fragments that appear lighter in color (transparent) than the stromal tissue. Epithelial isolates should be wispy, transparent tissue pieces that can be transferred to a petri dish for mincing. Tissue isolates should not be completely broken down. If tissue pieces are completely broken down, the trypsin incubation time can be reduced.
3. Digestion to single-cell suspension
- Transfer isolated pieces of epithelium into a sterile petri dish using a small plastic transfer pipette or a 200 µL pipette tip. Mince epithelium into small fragments using small spring scissors in a drop of 1x HBSS added directly to the fragments (Figure 2K).
NOTE: Stromal tissue pieces remaining after epithelial separation can be digested using the same method as the isolated epithelium. - Transfer minced pieces using a pipette to a 2 mL MCT containing 1.5 mL of pre-warmed (37 °C) Accutase digestion solution. The Accutase digestion solution contains the following: Accutase, 10 µM Rocki Y-27632, and 100 µg/mL DNase I.
- Transfer the tube containing the tissue and digestion solution to a sample rotator in a 37 °C hybridization oven. Incubate for 1 h.
NOTE: Contents of the tube may be checked for successful digestion before proceeding. Successful digestion: The minced tissue is well dispersed in the Accutase solution with only few visible pieces after incubation. Failed digestion: Large tissue pieces are still present after incubation in Accutase solution. Tissues must be minced as finely as possible for successful digestion. - After 1 h, transfer the entire contents of the 2 mL MCT into a 5 mL centrifuge tube and add 2 mL of wash buffer (1x PBS without Ca and Mg, with 1% Bovine serum albumin).
- Spin down the suspension at 600 x g for 5 min in a 4 °C centrifuge with a swinging bucket rotor.
- Aspirate the supernatant using gentle vacuum and resuspend the pellet in 1 mL of wash buffer using a 1 mL pipette with a filter tip.
- Using the pipette tip, break up the pellet by pipetting up and down until clumps become smaller. Pass the suspension with 4 strokes through a 23 1/2-gauge needle attached to a 1 mL syringe, followed by 4–6 strokes through a 26 1/2-gauge needle attached to a 1 mL syringe.
NOTE: Passage through a small-gauge needle is required to obtain a uniform single-cell suspension and prevent cell clumping. While this step can cause shear stress and cell death, the authors have optimized the number of strokes with the needle and syringe to provide a single suspension without excessive cell death. Skipping this step results in a large proportion of clumped cells, which will confound downstream analysis like single-cell RNA-sequencing and flow cytometry. - Add 1 mL of wash buffer to wet the surface of a 30-micron pre-separation filter placed over a 5 mL tube. Use the syringe connected to the 26 1/2 -gauge needle to transfer 1 mL of the cell solution through the strainer.
- Add 1 mL of additional wash buffer to the tube containing cells, and then take up this solution with the syringe and pass it through the filter. Pellet cells by centrifugation at 600 x g for 5 min at 4 °C using a swinging bucket rotor.
- Aspirate the supernatant and resuspend the pellet in 100 µL of wash buffer, and add 100 µL of 1x red blood cell (RBC) lysis buffer. Incubate the suspension at room temperature for exactly 3 min, then add 4 mL of wash buffer and resuspend the pellet.
NOTE: RBC lysis is recommended to remove blood cells from the urethral epithelial cell suspension. Although this step may have a minor effect on epithelial cell viability, the protocol used 0.5x diluted RBC lysis buffer and a 3-minute incubation to minimize cell loss and preserve cell viability. - Harvest cells by centrifugation at 600 x g for 5 min at 4 °C using a swinging bucket rotor.
- Aspirate the supernatant and resuspend the pellet in 50–200 µL of wash buffer according to pellet size.
NOTE: The pellet size from tissues obtained from 4–5 pooled mouse urethral epithelial samples will be small but still visible by eye. It is essential to centrifuge cells using a swinging bucket rotor so that the pellet collects at the bottom of the tube rather than being smeared along the side. The researchers have recorded a cell yield of 28,000–34,000 live cells per mouse urethral epithelium. - Transfer 5 µL aliquot of cells to a 0.5 mL MCT and add 5 µL of trypan blue. Mix and load on hemocytometer to check yield and cell viability.
4. Flow cytometry analysis of urethral epithelial single cell isolates
- Aliquot 100,000 total cells in a 5 mL centrifuge tube to perform fluorescent immunostaining of single cells from the urethral epithelial or stromal compartment for flow cytometry. Make up volume in the tube to 4 mL with 1x PBS.
NOTE: To attain reliable results with flow cytometry, a minimum of 50,000 cells per sample is recommended. - Spin down the cell suspension at 500 x g for 5 mins at 4 °C using a swinging bucket rotor.
- Discard the supernatant and resuspend the pellet in 50 µL of 1x PBS.
- Add 50 µL of 2x Ghost dye Violet 450 (1 µL Ghost dye in 500 µL of 1x PBS) to the cell suspension to obtain 100 µL of 1x Ghost dye solution.
NOTE: Ghost Dye V450 is an amine-reactive viability dye that can be used to discriminate between viable and non-viable cells in flow cytometry applications. - Add 5 µL of Fc receptor blocking solution (anti-mouse CD16/32) per 100 µL of cell suspension and incubate for 5 min at room temperature.
NOTE: This step is required for blocking the binding of immunoglobulin to Fc receptors. - Incubate the cell suspension on ice for an additional 25 min.
- Dilute the cell suspension to 5 mL using cell staining buffer (1x PBS, 0.02% (w/v) Sodium azide, and 1% (w/v) BSA, see Supplementary Table 3). Spin down at 500 x g for 5 min at 4 °C using a swinging bucket rotor. Discard the supernatant and resuspend the cell pellet in 100 µL of cell staining buffer.
NOTE: Sodium azide is highly toxic. Avoid contact with skin, eyes, and clothes. Use appropriate personal protective equipment (PPE) when handling. - In 100 µL of cell suspension, add 5 µL of conjugated primary antibodies: anti-CD326/EPCAM (labels epithelial cells), anti-F4/80 (labels murine macrophages), and anti-CD45 (pan-immune marker) at a dilution of 1:20. Incubate the cell suspension on ice for 30 min.
- Dilute the cell suspension to 5 mL using cell staining buffer, and then spin down at 500 x g for 5 min at 4 °C using a swinging bucket rotor. Aspirate the supernatant and resuspend the cell pellet in 500 µL of cell staining buffer.
- Transfer the cell suspension through a 35-micron nylon mesh strainer on filter cap sorting tubes. Place tubes on ice till further analysis.
- Perform initial set-up and performance check on cytometer.
- Adjust voltages using unstained and fully stained samples. Perform compensation with bead controls and proceed to acquisition.
NOTE: Experiments with more than one fluorophore require compensation to be performed. Prepare the necessary compensation controls. You will need single-stained controls (i.e., compensation beads) for each fluorophore used in the experiment. Compensation may be performed automatically according to the flow cytometer software settings. FMO (fluorescence minus one) controls are recommended for distinguishing between positive and negative cell populations for a given fluorophore. Prepare FMOs by including all fluorophores in the sample except the one being controlled for. - Adjust gates using FMO (fluorescence minus one) controls and acquire 50,000 events per sample.
5. Culture of urethral epithelial organoids
NOTE: For mouse urethral epithelial organoids, follow Protocols, Section 3, Digestion to single-cell suspension, steps 3.1 to 3.11. to obtain single-cell suspensions.
- Resuspend the urethral epithelial cell pellet in 50–100 µL organoid expansion media (details given in Supplementary Table 4). Obtain cell viability and cell number by counting on a hemocytometer.
- Prepare a 1:4 mixture of cell suspension (1 part) and Cultrex (4 parts), with a final concentration of 5000 cells in 25 µL. Add 3 droplets of 25 µL cell suspension (5000 cells/droplet) to each well of a 12-well plate.
NOTE: Always pipette Cultrex gently with a cut-off tip to avoid bubbles. - Transfer the plate to a 37 °C incubator (5% CO2) for 15 min to solidify the droplets.
- Overlay the droplets with 800 µL of organoid expansion media, gently from the sides of the well, and transfer the plate back to the incubator.
NOTE: Media change is required every 2 days. Replace the spent media with 800 µL fresh organoid expansion media. - Take images of the organoids on each day from Day 0 to 6 days using an inverted microscope at 4x–20x magnification.
6. Urethral Organoids histology and immunostaining
CAUTION: Xylene is a highly flammable solvent. Use appropriate PPE to handle the chemical. Collect used xylene as organic solvent waste. Dispose through approved hazardous chemical waste programs. Formalin is toxic and causes skin, eye, and respiratory irritation. Avoid skin contact and inhalation. Use appropriate PPE to handle the chemical. Dispose through institutional hazardous chemical waste disposal systems. The protocol to embed urethral organoids in paraffin blocks was modified and optimized from a protocol to embed endometrial organoids14.
- On Day 6 of organoid culture, discard the spent media and wash the organoids with 1x HBSS at room temperature. Add 1.5 mL of neutral buffered formalin (10%) to the wells for 15 min.
- Discard the fixative and add 1.5 mL hematoxylin to the wells for 10 min. Discard the stain and wash twice with 1x HBSS.
- Add 1 mL of 2% UltraPure low-melting point agarose made in 1x HBSS in each well containing 3 droplets, leave the agarose to solidify for 15 min at room temperature.
- Gently remove the agarose from the well using the flat end of a thin spatula, ensuring Cultrex droplets come off along with it.
- Transfer the agarose disc into a tissue cassette and dehydrate in 70% ethanol for 30 min at room temperature with constant agitation.
- Further dehydrate in different concentrations of ethanol and duration: 90% ethanol for 30 min, 100% ethanol for 30 min, 100% ethanol for 60 min, 100% ethanol for 90 min.
- Blot off excess ethanol and clear with xylene for 45 min at room temperature with constant agitation. Repeat the xylene clearing step for 60 min.
- Blot off the excess xylene and transfer to infiltrating paraffin wax (65 °C) overnight.
- Add a thin layer of embedding wax to the base of a metal embedding mould and place the agarose disc over it. Remove the mould from the slide warmer and quickly overlay it with embedding wax through the slats of the cassette bottom. Allow to solidify at room temperature.
- Cut organoid paraffin blocks on a microtome to obtain 5-µm sections. Place sections on positively charged slides.
- Hematoxylin-Eosin staining
- Bake slides at 60 °C and deparaffinize with xylene and rehydrate through a series of ethanol washes (xylene 1 min, 100% ethanol 1 min, 95% ethanol 1 min, 75% ethanol 1 min)
- Wash slides in tap water and incubate with Gill’s Hematoxylin No. 2 for 3 min. Place slides under a stream of tap water to develop a blue color.
- Incubate slides in 95% ethanol for 1 min, followed by 0.25% eosin solution for 1 min. Wash slides in tap water until the water runs clear.
- Dehydrate slides (95% ethanol 1 min, 100% ethanol 1 min) and clear with xylene (1 min) before mounting with fast-hardening mounting media.
- Immunostaining of paraffin sections
- Bake 5 µm paraffin sections in a hybridization oven at 60 °C for 1–2 h.
- Dewax slides by immersing in xylene for 6 min in a slide staining jar.
- Rehydrate slides in 100%, 95%, 75% ethanol in distilled water for 6 min each. Then wash slides in distilled water for 5 min.
- Add slides in a square Pyrex dish containing 0.01 M citric acid (in distilled water) antigen retrieval solution, and cover the dish with cling wrap. Perform antigen retrieval by microwaving at high power for 20 min.
- Cool to lukewarm for 20 min and rinse slides in PBS for 5 min. Draw a hydrophobic barrier around tissue sections and add 100 µL/section of horse blocking buffer for 1 h at room temperature with gentle rocking (See Supplementary Table 5 for preparation of horse blocking buffer).
- Prepare primary antibody solution in horse blocking buffer by adding primary antibodies at a suitable dilution (1:100–1:200). Add 100 µL of primary antibody solution to each section. Incubate slides overnight at 4 °C with gentle rocking.
NOTE: Organoids were immunostained with antibodies to Keratin 5/KRT5 (basal epithelial marker), P63 (basal epithelial marker), KRT4 (intermediate/suprabasal epithelial marker), and KRT13 (intermediate/suprabasal epithelial marker). - Following overnight incubation, wash slides in PBS 4 x 5 min at room temperature with gentle rocking.
NOTE: All subsequent steps should be carried out in a light-protected box at room temperature. - Prepare secondary antibody solution in horse blocking buffer, adding fluorescently tagged secondary antibodies at a 1:500 dilution. Incubate slides for 1 h at room temperature with gentle rocking.
- Wash slides in PBS 4 x 5 min at room temperature with gentle rocking.
NOTE: Optional step: use Autofluorescence Quenching kits to quench the auto fluorescence signal. - Incubate with 300 nM DAPI solution for 5 min with gentle rocking. Wash in PBS for 2 x 5 min at room temperature with gentle rocking.
- Mount with anti-fade mounting solution (90% Glycerol, 0.2% n-propyl gallate in 1x PBS). Image sections on a widefield fluorescent microscope.
NOTE: Camera exposure settings for each fluorophore must be adjusted to maximize signal-to-noise ratio while avoiding pixel saturation. Use the same exposure settings while imaging organoids stained in a given session.
7. Wholemount immunostaining of isolated urethral epithelial sheets
NOTE: For whole-mount immunostaining, follow Protocol, Section 2, Isolation of urethral epithelial tissue, steps 2.1 to 2.12. to obtain urethral epithelial sheets.
- Carefully transfer the epithelial tissue using a transfer pipette or 200 µL pipette tip into a well of a 24-well tissue culture dish containing 500 µL of 10% neutral buffered formalin. Seal the plate lid with paraffin and incubate it on a rocker for 20 min at 4 °C.
NOTE: Perform all the steps in the same well to avoid loss of epithelial tissue. - Carefully aspirate the formalin from the well. Perform a wash with 500 µL of 1x PBS and incubate on a rocker for 5 min at room temperature. Repeat the same wash step once again.
- Add 500 µL of permeabilization solution containing 1x PBS + 1% Triton X-100 to the well. Seal the lid of the plate using parafilm, and incubate for 2 h at 4 °C with gentle rocking.
- Carefully aspirate the permeabilization solution from the well.
- Perform blocking by incubating tissues in 500 µL horse blocking buffer containing an additional 1% Triton X-100 (Recipe for horse blocking buffer is provided in Supplementary Table 5). Seal the lid of the dish with parafilm and incubate overnight at 4 °C with gentle rocking.
- Prepare primary antibody solution in horse blocking buffer containing an additional 1 % Triton X-100 by adding primary antibodies at a suitable dilution (1:100–1:200). Aspirate blocking solution and add 500 µL of primary antibody solution: anti-CDH1 (epithelial cell marker) and anti-F4/80 (murine macrophage marker). Seal the lid with parafilm and incubate for 48–72 h at 4 °C with gentle rocking.
- Carefully aspirate the primary antibody solution and wash 3 times with 1x PBS for 30 min each at room temperature with gentle rocking.
- Prepare secondary antibody solutions in horse blocking buffer with an additional 1% Triton X-100 by adding secondary antibodies at a suitable dilution (1:500).
- Add 500 µL of secondary antibody solution to the well and cover the plate with aluminum foil, and incubate for 4–6 h at room temperature on a rocker.
- Carefully aspirate the secondary antibody solution and wash 3 times with 1x PBS for 30 min each at room temperature.
NOTE: DAPI staining can be performed by incubating tissues with diluted DAPI stock solution (300 nM final concentration) for 10 min at room temperature. Wash tissues with 1x PBS (2x 5 min) at room temperature on a rocker. - Carefully transfer the epithelial tissues to a glass slide or imaging dish and add anti-fade mounting solution (90% Glycerol, 0.2% n-propyl gallate in 1x PBS).
- Image tissues on a fluorescent microscope.
NOTE: Given the thickness of the sample, the authors recommend imaging on a fluorescent microscope capable of optical sectioning. In this study, the authors used a widefield fluorescent microscope with Apotome optical section to remove out-of-focus light and obtain z-stacks. Image z-stacks were obtained to visualize dendritic projections of epithelial-associated macrophages.
Results
Dissection and collection of the adult female mouse urethra
In the first part of this study, the authors provide a detailed protocol for the dissection of the female mouse urethra. Given its attachment to the ventral vaginal wall and location underneath the pubic symphysis, the method provided here allows for the clean dissection of the full-length female urethra (Figure 1).
Isolation of urethral epithelial tissue and flow cytometry analysis for single-cell isolates
Trypsin digestion results in easy separation of the epithelial lining of the urethra from the surrounding stroma. Epithelial sheets with higher transparency than the stromal tissue can be observed after separation (Figure 2). The separated epithelial sheets yielded single-cell suspensions upon enzymatic digestion. Single cells isolated from the urethral epithelium show consistently high viability (>80%) by trypan blue exclusion on a hemocytometer (Figure 2L) and flow cytometry using viability dyes to gate live cells (Figure 3, Supplementary File 1).
The authors performed flow cytometry to assess epithelial cell enrichment from single-cell suspensions of urethral epithelium. To check cell viability, the cell suspension was stained with a live/dead marker, the amine-reactive ghost dye V450. Authors consistently observed a cell viability of >80% by the live/dead marker. The live/dead marker enabled the gating out of debris and dead cells during flow analysis. They stained samples with an epithelial cell marker (CD326/EPCAM), a macrophage marker (F4/80), and an immune cell marker (CD45) to record the composition of cells isolated through this method. The results of flow cytometry showed that the authors isolated an enriched epithelial cell population from the female mouse urethral epithelium. For both independent experiments performed, the group achieved 80–90 % of EPCAM-positive epithelial cells after gating on live cells. The authors also observed ~1.30 % of CD45+ immune cells in the epithelial preparation. Macrophages associated with the epithelial lining accounted for ~1.18 % of the live cells from the epithelial compartment. Flow cytometry analysis of single-cell suspensions from epithelial sheets shows minimal stromal contamination (5–6%), which is mostly attributed to vascular endothelium according to their previous study5. Supplementary File 1 shows flow cytometry results for single-cell preparations from the epithelial and stromal compartments. Compared to the 80–90% enrichment of epithelial cells isolated from the epithelial compartment, the stromal compartment also showed 40–50% of epithelial cells, which are from the short ducts and glandular epithelium extending from the urethral lumen into the surrounding stroma (Figure 3, Supplementary File 1).
Urethral epithelial organoids culture, histology, and immunostaining
The authors also demonstrate how single epithelial cells isolated from the urethra are viable and can form organoids in a 3D matrix, and observed organoid growth from single urethral epithelial cells up to Day 6 in culture (Figure 4B–G). They performed hematoxylin-eosin staining (H&E) to observe the histology of organoids (Figure 4H–J). The authors observed two distinct morphologies of urethral epithelial organoids, one being large and hollow, while the other type was smaller and solid. In both cases, the organoids were stratified and recapitulated markers expressed in the epithelial lining of the female urethra, including KRT5 and P63 marking the basal layer and KRT4 and KRT13 labeling suprabasal/intermediate cell layers (Figure 4K–N), Supplementary Figure 1). The differences in organoid formation capacity between the proximal and distal urethra were examined. Organoids generated from the proximal urethra had a higher proportion of hollow organoids, while organoids from the distal urethra formed solid spheres (Figure 4O–P). Additionally, they observed differences in organoid-forming efficiency in epithelial cells isolated from the proximal and distal parts of the urethra. Distal urethral epithelium formed organoids with higher efficiency than proximal urethral epithelium with the same initial seeding density (5000 cells/droplet) (Figure 4Q–S).
Whole-mount immunostaining of isolated urethral epithelial sheets
The researchers also present an optimized method for whole-mount staining of the female mouse urethral epithelial sheets. Here, they stained epithelial sheets with two markers: F4/80 for macrophages and E-cadherin/CDH1 to mark epithelial cell-cell junctions (Figure 5). Tissues were imaged using a Zeiss Axio Observer 7 microscope with Apotome 3 optical sectioning. Epithelial sheets show strong labeling with the CDH1 antibody. Whole-mount preparations of urethral epithelium labeled with antibodies to F4/80 showed macrophages forming an arbor of dendrites in the epithelial lining. Macrophages could be observed sending dendritic processes between epithelial cells of the urethra. Overall, the results demonstrate the utility of the protocols described here for the study of the epithelial lining of the female mouse urethra.
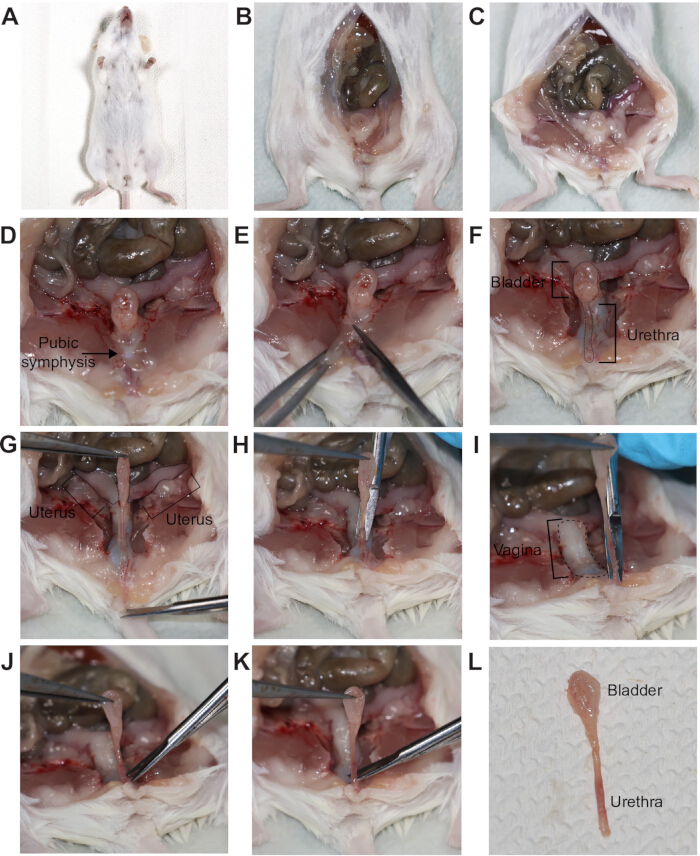
Figure 1: Mouse dissection for female urethra collection. (A) Place the mouse in a supine position and spray the abdomen with 70% EtOH. (B–C) Open the abdomen by lifting up the skin and making a vertical incision. (D) Trim fat and connective tissue to expose the butterfly-shaped pubic bones connected at the (Arrow in black) pubic symphysis. (E) Cut the pubic symphysis. (F) Once the pubic bones are removed, the urethra can be seen running downward (Outlined with a dotted line in black) from the bladder. (G) Gently pull up the bladder with forceps. The urethra is clearly visible as a thin red tube. (H–I) Pull the bladder upwards from the body cavity. Use tension on the bladder to separate the urethra from the ventral vaginal wall. Run the scissors between the urethra and the vaginal wall to separate the urinary and reproductive tracts. (J–K) Detach the distal end of the urethra attached to the skin. (L) Image of a dissected female mouse lower urinary tract (FLUT), showing bladder and urethra. Please click here to view a larger version of this figure.
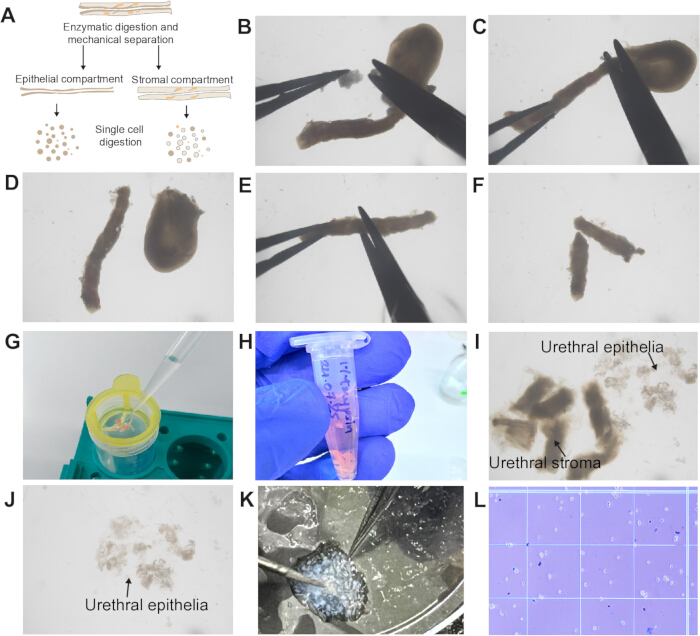
Figure 2: Isolation of urethral epithelium and preparation of a single-cell suspension. (A) Schematic depicting enzymatic digestion and mechanical separation of the epithelial and stromal compartments of the urethra followed by single-cell digestion. (B) Clear the extra fat from the female lower urinary tract. (C–F) Cut the urethra from the bladder neck region to separate urethra from bladder. Then cut urethra in two halves using fine scissors. (G) Wash urethral pieces with 1x HBSS solution by passing over a 100-micron filter. (H) Transfer urethral tissue fragments into 1% trypsin solution. Incubate on a sample rotator in the cold room. Add MgCl₂ and DNase I to the same tube. Incubate at 37 °C in a hybridization oven on a sample rotator. (I–J) Isolate the epithelium by gently squeezing with fine forceps along the length of the urethral fragment. (K) Tissues are minced into small fragments using fine scissors. Transfer the minced epithelial tissue into Accutase digestion solution and incubate at 37 °C in a hybridization oven on a sample rotator. (L) Count epithelial cells and assess viability using trypan blue with a hemocytometer. Please click here to view a larger version of this figure.
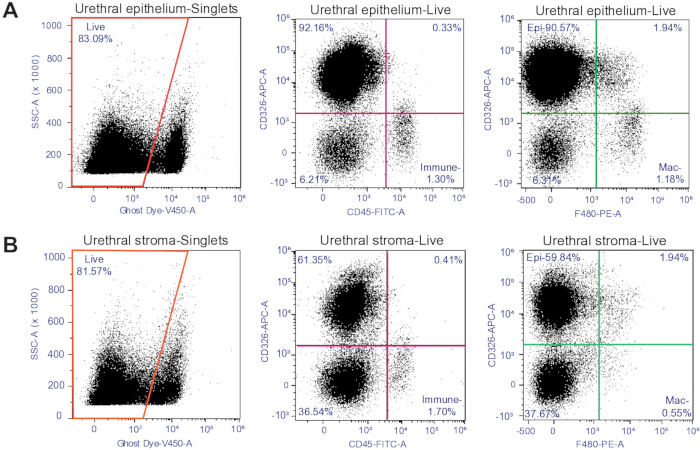
Figure 3: Flow cytometry to assess single-cell suspensions from urethral epithelium and stroma compartments. Flow cytometry was performed on single-cell preparations of pooled mouse urethra (A) epithelial and (B) stromal compartments. Live cells were gated to exclude dead cells stained with Ghost Dye V450. Live cells were assessed for CD45 (pan-immune marker), CD326/EPCAM (pan-epithelial marker) and F4/80 (murine macrophage marker) expression. Data is representative of 2 independent experiments conducted on a pool of 5–6 mice per experiment to generate epithelial and stromal samples. Abbreviations; SSC-A = side scatter-peak area; FITC = fluorescein isothiocyanate; APC = allophycocyanin; PE = phycoerythrin. Please click here to view a larger version of this figure.
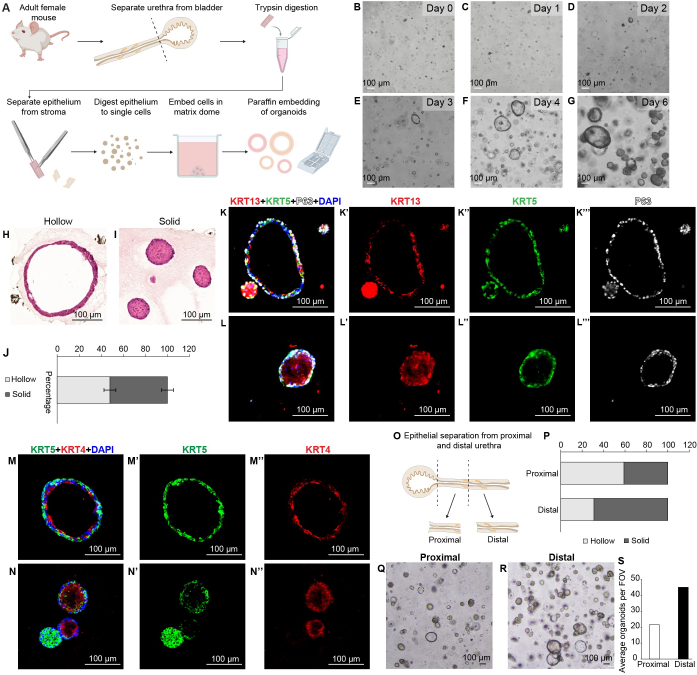
Figure 4: Histology and immunostaining of urethral epithelial organoids. (A) Schematic showing workflow for the generation of urethral epithelial organoids. (B–G) Representative bright-field micrographs of urethral epithelial organoids (UEOs) generated from single cells at different days of in vitro expansion. Representative bright-field images of (H) hollow and (I) solid urethral epithelial organoids (UEOs) stained with hematoxylin and eosin (H&E). (J) Quantification of organoid types generated across three independent experiments. The error bar represents the standard error of the mean. Representative images of (K) hollow and (L) solid urethral epithelial organoids (UEOs) immunostained with epithelial markers KRT13 (suprabasal epithelial marker), KRT5 (basal epithelial marker) and P63 (basal epithelial marker). Images depicting single fluorescent channels are depicted in K’,K’’,K’’’,L’,L’’ and L’’’. Representative images of (M) hollow and (N) solid urethral epithelial organoids (UEOs) immunostained with epithelial markers KRT4 (suprabasal epithelial marker) and KRT5 (basal epithelial marker). Images depicting single fluorescent channels are depicted in M’,M’’,N’ and N”. (O) Schematic of dissection of proximal and distal urethra. (P) Quantification of organoid types generated from the proximal and distal urethra across two independent experiments. Representative bright-field micrographs of Day 6 urethral epithelial organoids (UEOs) generated from epithelium isolated from the (Q) proximal and (R) distal urethra. Data of organoids generated from the complete urethra is representative of 3 independent experiments conducted with a pool of 3–5 mice per experiment. (S) Data of organoids generated from the proximal and distal urethra are representative of 2 independent experiments conducted with a pool of 3–4 mice per experiment. Nuclei labeled with DAPI (blue). (Scale bars, 100 µM). Schematics prepared with BioRender and Adobe Illustrator. Created in BioRender. Binoy joseph, D. (2026) https://BioRender.com/jvf17v7 Please click here to view a larger version of this figure.
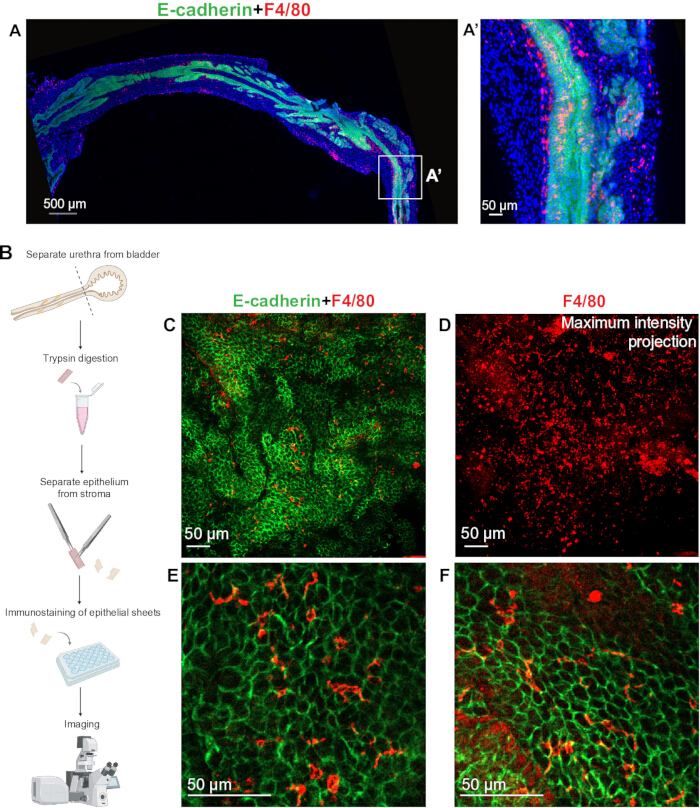
Figure 5: Whole-mount immunostaining of urethral epithelial sheets. (A) 10-micron frozen section of the adult female mouse urethra in optimal cutting media, showing immunostaining for the murine macrophage marker F4/80 (in red) and the epithelial protein E-cadherin/CDH1 (in green). (A’) represents zoomed in view of inset in (A). (B) Schematic diagram showing steps for whole-mount staining of isolated urethral epithelial sheets. Wholemount immunostaining of isolated female mouse urethral epithelial lining was performed with antibodies against the murine macrophage marker F4/80 (in red) and the epithelial protein E-cadherin/CDH1 (in green). (C) Representative image of merged view. (D) Orthogonal maximal intensity projection of the red channel showing macrophage organization. (E–F) Zoomed in view of epithelium and associated macrophages. White scale bar, 50 µM. Grey scale bar, 500 µM. Data is representative of 2 independent experiments conducted on a pool of 4–5 mice. Schematics prepared in BioRender and Adobe Illustrator. Created in BioRender. Binoy joseph, D. (2026) https://BioRender.com/tjh9opk Please click here to view a larger version of this figure.
Supplementary Table 1: Preparation of 1x HBSS (no Ca, Mg).Please click here to download this file.
Supplementary Table 2: Preparation of 1x sHBSSa and 1 % Trypsin solution.Please click here to download this file.
Supplementary Table 3: Preparation of cell/flow staining buffer.Please click here to download this file.
Supplementary Table 4: Preparation of organoid expansion media for urethral epithelial organoids.Please click here to download this file.
Supplementary Table 5: Preparation of Horse Blocking Buffer.Please click here to download this file.
Supplementary File 1: Cell counts for flow cytometry experiment performed on single cells from the urethral epithelial and stromal compartments from two independent experiments.Please click here to download this file.
Supplementary Figure 1: Comparison of adult female mouse urethral epithelium to urethral epithelial organoids. Representative images of (A) adult female mouse urethral epithelium, (B) hollow urethral epithelial organoids, and (C) solid urethral epithelial organoids (UEOs) immunostained with epithelial markers KRT13 (suprabasal epithelial marker), KRT5 (basal epithelial marker), and P63 (basal epithelial marker). Images depicting single fluorescent channels are depicted in A’,A’’,A’’’,B’,B’’,B’’’,C’,C’’ and C’’’. Representative images of (D) adult female mouse urethral epithelium, (E) hollow urethral epithelial organoids and (F) solid urethral epithelial organoids (UEOs) immunostained with epithelial markers KRT4 (suprabasal epithelial marker) and KRT5 (basal epithelial marker). Images depicting single fluorescent channels are depicted in D’,D’’,E’,E’’,F’ and F”. Data representative of 3 independent experiments conducted with a pool of 3–4 mice per experiment. Nuclei labeled with DAPI (blue). (Scale bars, 100 µM).Please click here to download this file.
Discussion
Epithelial barriers in the body are critically important for host defense. These are specialized compartments with multiple epithelial cell types and associated resident immune cells. Epithelial barriers change over developmental time, acquiring host defense gene expression often in response to microbiota or environmental exposures. Defects to epithelial integrity or gene expression may influence host defense15. It is essential to study epithelial tissue in isolation to understand transcriptomic signatures as well as to investigate cell-cell contacts and epithelial integrity. Currently no methods have been described in detail that are optimized for the isolation of urethral epithelial tissue from the female mouse. While the bladder epithelium can be isolated by only mechanical separation16, the urethral epithelium is present inside the stromal tube of the urethra and requires a combination of enzymatic and mechanical separation to isolate epithelial tissue.
Here, the authors present an optimized method for isolation of epithelial sheets from the urethral lumen of female mice. The method can be used for generating high viability single-cell suspensions of urethral epithelial cells for downstream applications like flow cytometry, organoid culture and immunostaining. The compatibility of this method with single-cell RNA-sequencing workflows was previously demonstrated by the same group5. With modifications and further optimization, the protocol presented here can be adapted to extract epithelial tissues from other tubular organs for downstream applications.
The key steps in the protocol involve careful dissection of the full length adult female mouse urethra, enabling the study of regional differences along the proximal-distal axis. Following this, the protocol uses gentle enzymatic digestion to loosen the epithelial lining of the urethra from the surrounding stroma. The enzymatic digestion loosens the epithelial to allow mechanical separation by gently squeezing the urethral tube between forceps to the release the epithelial tissue. The researchers have carefully optimized the timing for trypsin digestion to enable isolation of urethral epithelium with high viability (> 80%) as sheets for immunostaining or for downstream single-cell isolation (Figure 3, Supplementary File 1). Single-cell digestion of urethral epithelium revealed 80–90% of epithelial cells in urethral epithelial isolates. From a previous study, authors identified that non-epithelial cells in this preparation are mostly comprised of epithelial-associated immune cells and vascular endothelium5. The current method for single-cell isolation yields high quality single-cell suspensions for downstream applications like flow cytometry and single-cell RNA-sequencing by eliminating cell clumps through mechanical disruption via small gauge needle aspiration and removal of RBCs by gentle lysis.
The results demonstrate that this is method can be used to enrich compartment specific immune cells (Figure 3). Epithelium isolated from the proximal and distal urethra can also be studied separately. Additionally, the authors demonstrated that isolated epithelial cells can be used for the generation of urethral organoids which have not been described previously (Figure 4). These results also demonstrate regional variability in organoid generation capacity in the female urethra. While the author’s recent studies have shown proximal-distal differences in epithelial gene expression and immune cell organization in the female mouse urethra5, the current study shows that proximal urethral epithelial cells form fewer organoids than epithelium isolated from the distal urethra (Figure 4). One limitation of this spatial demarcation into proximal and distal urethra is that there is no anatomical landmark that can be used at the time of dissection to distinguish between these two areas. In this study, the authors have divided the length of the urethra by half to obtain proximal and distal compartments. The epithelial isolation method described here can be used to further characterize the differences in gene expression and cellular composition between the proximal and distal urethral epithelium.
While the optimized protocol presented here is accessible and reproducible, some steps require practice and careful calibration. In particular, the dissection method shown here requires careful extraction of the urethral tube from below the pubic symphysis while preserving the entire length of the urethra. Additionally, care must be taken to remove any vaginal tissue attached to the dorsal urethral wall after dissection. Fat present around the bladder neck should be carefully removed to reduce adipocyte contamination during downstream applications like single-cell RNA-sequencing. Further, trypsin digestion should be carefully optimized with each batch of enzyme to ensure consistent digestion. Over-digestion of tissue may lead to loss of cell viability. The authors have carefully optimized the time for trypsin digestion, indicating a 15–30 min time window for the incubation steps at 4 °C and 37 °C. This can be further optimized based on the batch of enzyme used. It is also critical to mince tissues into small pieces for efficient single-cell digestion. The authors have used Accutase for further single-cell digestion as it results in a gentle dissociation. In case of a reduction in cell viability, the time for Accutase incubation can be reduced. Additionally, the authors have included Rock inhibitor in the Accutase digestion mix to enhance cell survival. DNase digestion is recommended to reduce cell clumping by digesting extracellular DNA released from dead and dying cells. The authors also recommend the use of RBC lysis buffer to reduce red blood cell contamination that would confound downstream results like flow cytometry and single-cell RNA-sequencing.
One limitation of the epithelial isolation method presented here is that it is has been optimized for the female mouse urethra. The male mouse urethra is more anatomically complex, with changing epithelial architecture from the proximal to the distal urethra. Additionally, the method can only isolate the epithelial cells lining the urethral lumen. Urethral secretory glands connected to the urethral lumen via short epithelial ducts cannot be isolated as these are embedded in stromal tissue. Instead, these epithelial structures are enriched in the stromal compartment remaining after isolating the urethral epithelial lining (Figure 3).
Despite these limitations, this method has enabled important insights into urethral epithelial architecture and will allow further investigation into epithelial-associated immune cells via visualization of epithelial-associated macrophages in situ. The method has already been demonstrated to be compatible with single-cell RNA-sequencing workflows to identify cellular heterogeneity in the urethral epithelium and associated immune cells5. Additionally, the capability to isolate epithelium from the proximal and distal urethra will enable studies to understand spatial differences in the urethra. Significantly, the epithelial cell digestion method yields viable single cells that can generate urethral epithelial organoids that will be useful to study host-pathogen interactions and epithelial biology of the urethra. Overall, these methods add to the tool kit to enable deeper investigations into urethral epithelial biology.
Disclosures
The authors have no competing interests. No AI tools were used in this article.
Acknowledgements
We acknowledge the Animal Care and Resource Centre at the National Centre for Biological Sciences (NCBS), Bangalore Life Sciences Cluster (BLiSC) for their services. We acknowledge Yousuf Khan and the Communications Office at BRIC-inStem for photography. We thank Dr. Sudarshan Gadadhar for access to AxioObserver microscope and Apotome. This work was supported by DBT/Wellcome Trust India Alliance Early Career Fellowship (Ref: IA/E/21/1/506274) to D.B.J. and Department of Biotechnology (DBT), Government of India Institutional core funds to inStem.
Materials
| Name | Company | Catalog Number | Comments |
|---|---|---|---|
| #5 fine forceps | |||
| 10% neutral buffered formalin | Sigma Aldrich | HT501128 | |
| 10X HBSS | Sigma Aldrich | H4641 | |
| 12-well plate | Corning | 3513 | |
| 30-micron pre-separation filter | Miltenyi Biotec | 130-041-407 | |
| A83-01 | Sigma Aldrich | SML0788 | |
| Accutase | Sigma Aldrich | SCR005 | |
| Adobe Illustrator | Adobe | To make figure panels | |
| Adobe Photoshop | Adobe | To make figure panels | |
| Advanced DMEM/F12 | Gibco | 12634010 | |
| Antibiotic/antimycotic | Sigma Aldrich | A5955 | |
| Anti-CD326 (EpCAM) | Invitrogen | 17-5791-82 | 1:20 dilution, for Flow cytometry |
| Anti-CD45 | Tonbo | 35-0451-U100 | 1:20 dilution, for Flow cytometry |
| Anti-CDH1 (Rabbit) | Cell Signalling Technology | 3195S | 1:200 dilution |
| Anti-F4/80 | Tonbo | 50-4801-U100 | 1:20 dilution, for Flow cytometry |
| Anti-F4/80 (Rat) | Invitrogen | 14-4801-82 | 1:200 dilution |
| Anti-Keratin 13 (Rabbit) | Abcam | ab92551 | 1:200 dilution |
| Anti-Keratin 4 (Mouse) | Abcam | ab9004 | 1:200 dilution |
| Anti-Keratin 5 (Chicken) | Biolegend | 905904 | 1:800 dilution |
| Anti-Keratin 5 (Rabbit) | Cell Signaling Technology | 71536 | 1:200 dilution |
| Anti-p63 (Mouse) | Biocare medical | CM163A | 1:200 dilution |
| Axioobserver 7 | Zeiss | 431007-9904-000 | |
| B27 supplement | Invitrogen | 12587010 | |
| Bovine serum albumin (BSA), fraction V | Genetix | PG-2330 | |
| CD-1 Mice | Charles River, USA | Crl:CD1(ICR) | |
| Cultrex BME | R&D systems | 3445-005-01 | |
| DAPI solution | Sigma Aldrich | D5942 | |
| D-Glucose | Qualigens | Q15405 | |
| Dimethyl sulfoxide (DMSO) | Himedia | MB058 | |
| di-Sodium Hydrogen Ortophosphate (Na2HPO4) | Qualigens | Q15825 | |
| DNase I | Sigma Aldrich | 10104159001 | |
| Donkey anti-Chicken IgG (H+L) (AF488) | Jackson Immunoresearch | 703-545-155 | 1:500 dilution |
| Donkey anti-Mouse IgG (H+L) (AF488) | Jackson Immunoresearch | 715-545-151 | 1:500 dilution |
| Donkey anti-Mouse IgG (H+L) (AF594) | Jackson Immunoresearch | 715-585-151 | 1:500 dilution |
| Donkey anti-Rabbit IgG (H+L) (AF594) | Jackson Immunoresearch | 711-585-152 | 1:500 dilution |
| Donkey anti-Rabbit IgG (H+L) (AF647) | Jackson Immunoresearch | 711-605-152 | 1:500 dilution |
| Donkey anti-Rat IgG (H+L) (AF647) | Jackson Immunoresearch | 712-605-153 | 1:500 dilution |
| Donkey anti-Rat IgG (H+L) (AF594) | Jackson Immunoresearch | 712-585-153 | 1:500 dilution |
| EGF | PeproTech | AF-315-09 | |
| Eosin | Himedia | GRM938 | |
| Ethanol | Supelco | 1.00983 | |
| Eukitt mounting media | Sigma Aldrich | 3989 | |
| FGF10 | PeproTech | 450-61 | |
| Filter cap sorting tubes | Falcon/Corning | 352235 | |
| Ghost Dye™ Violet 450 | Tonbo biosciences | 13-0863-T100 | |
| Glutamax | Invitrogen | 35050061 | |
| Glycerol anhydrous | Merck | DA1P692899 | |
| Hematoxylin | Polysciences | 24243 | |
| HEPES | Gibco | 15630080 | |
| Horse serum | Gibco | 26050088 | |
| Kaluza Analysis | Beckman Coulter | Kaluza Analysis 2.4 | Analysis of flow cytometry data |
| Magnesium chloride (MgCl2) | Qualigens | Q15535 | |
| Mouse TruStain FcX (anti-mouse CD16/32 ) | Biolegend | 101320 | |
| N-acetyl cysteine | Sigma Aldrich | A9165 | |
| Nicotinamide | Sigma Aldrich | N0636 | |
| Noggin | PeproTech | AF-250-38 | |
| n-Propyl gallate | Sigma Aldrich | P3130 | |
| Paraffin wax | Qualigens | Q19215 | |
| Potassium chloride (KCl) | Qualigens | Q13305 | |
| Potassium dihydrogen orthophosphate (KH2PO4) | Qualigens | 19465 | |
| Primocin | Invivogen | ant-pm-05 | |
| RBC Lysis Buffer (10X) | Tonbo biosciences | TNB-4300-L100 | |
| Retinoic acid | Sigma Aldrich | R2625 | |
| Rocki (Y-27632) | Cell Signalling Technology | 13624S | |
| R-spondin 1 | PeproTech | 315-32 | |
| Sodium azide | Sigma Aldrich | S2002 | |
| Sodium bicarbonate (7.5% w/v solution) | Sigma Aldrich | S8761 | |
| Sodium chloride (NaCl) | Himedia | GRM853 | |
| Stero Zoom Microscope | Nikon | SMZ18 | For epithelial separation |
| SuperFrostTM PLUS Adhesion slides | Electron Microscopy Sciences | 71896-10 | |
| Tris-base | Hi-Media | MB029 | |
| Triton™ X-100 | Sigma Aldrich | X100 | |
| TrueVIEW Autofluoresence Quenching kit | Vector Laboratories | SP-8400-15 | |
| Trypan blue | Gibco | 15250061 | |
| Trypsin from porcine pancreas | Sigma Aldrich | T4799 | |
| Tween 20 | Sigma Aldrich | P1379 | |
| UltraPure LMP agarose | Invitrogen | 16520-050 | |
| Xylene | Qualigens | Q32295 |
Reprints and Permissions
