This protocol describes the recombinant production and purification of hydrophobin SC16 from Escherichia coli and provides fluorescence-based assays to monitor its self-assembly.
Method Article
Recombinant Production And Purification of Hydrophobin SC16 From Escherichia coli And Monitoring of Its Self-Assembly Using Fluorescence Assays
In This Article
Summary
Abstract
Hydrophobins are small amphipathic proteins that self-assemble at hydrophobic–hydrophilic interfaces to form stable waterproof coatings over fungal spores. Class I hydrophobins form particularly stable “rodlets” containing ordered amyloid-like structures that coat surfaces. This unusual surface chemistry gives them potential applications in drug delivery, foam stabilization, emulsification, and surface modification. To produce hydrophobins, there is a need for comprehensive, high-yield protocols from simple expression systems. Furthermore, it is necessary to provide facile methods to characterize hydrophobin function following recombinant production and purification. Herein, we describe protocols for the production and characterization of SC16, a class IB hydrophobin produced by the fungus Schizophyllum commune, which can be recombinantly expressed in Escherichia coli and subsequently purified under non-reducing, native conditions. This involves transformation of an expression plasmid encoding SC16 fused to an N-terminal fusion protein into E. coli, induction of protein expression, cell lysis under native conditions, affinity chromatography, and protease cleavage to isolate the hydrophobin at yields of ≥5 mg. The self-assembly of SC16 can then be monitored by end-point or kinetic fluorescence-based assays using thioflavin T. Both assays involve incubation of SC16 with prolonged mixing to promote self-assembly at air–water interfaces and are monitored by fluorescence measurements. Together, these approaches provide simplified protocols for purifying SC16 and monitoring its self-assembly and may be extended to other systems involving similar protein self-assembly.
Introduction
Hydrophobins are surface-active amphipathic proteins secreted by fungi that self-assemble at hydrophobic–hydrophilic interfaces (e.g., air–water interfaces on fungal structures). In nature, their roles are to coat spores and fruiting bodies1,2, making them water-resistant, preventing waterlogging of air channels, and facilitating dispersion1. Because of their unusual surface chemistry, hydrophobins have diverse industrial applications, including coatings to increase the biocompatibility of implants and prosthetics3,4,5, biocompatible surfactants for drug delivery and medical treatments6,7,8,9,10, and candidates for nanoplastic capture11.
Hydrophobins can be subdivided into class I and class II, both of which self-assemble at hydrophobic–hydrophilic interfaces, including air–water, oil–water12,13,14, and plastic–water15,16,17 interfaces. A defining feature of class I hydrophobins is that they form highly stable “rodlet” structures at interfaces, containing ordered amyloid-like (β-sheet-rich) features18, making them particularly suitable for applications involving surface modification or protection. In contrast, class II hydrophobins do not form amyloid-like structures but instead form films that can be readily dissociated1,18. Interestingly, a third class of hydrophobins also exists, with structural features retained from class I and class II18,19. Because of these differences, monitoring hydrophobin self-assembly is important for classification and for assessing the proper folding and function of recombinantly produced hydrophobins.
Self-assembly of hydrophobins can be readily monitored by fluorometric methods using amyloid-binding dyes such as thioflavin T (ThT), which binds to cross-β structures present in amyloids20. ThT contains a single covalent bond separating two aromatic rings that normally rotate freely. Upon binding to cross-β structures, this rotation becomes restricted, resulting in fluorescence20. Because of its selective fluorescence, ThT is widely used to monitor hydrophobin self-assembly at air–water interfaces21,22,23,24,25,26,27,28. ThT assays provide time-dependent kinetic information on hydrophobin self-assembly23,27,28, offering advantages over techniques such as atomic force microscopy (AFM) and contact angle measurements, which are lower throughput and less suited for time-dependent analysis. In addition, ThT exhibits strong fluorescence enhancement upon binding cross-β structures, with minimal fluorescence in its free form20. These properties make ThT assays simple and sensitive methods for monitoring hydrophobin self-assembly, which can be complemented by more intensive structural techniques.
Given the diverse applications of hydrophobins, there is a need for accessible protocols to monitor their self-assembly. Specifically, the present protocol provides a framework for optimizing the purification and functional characterization of recombinant hydrophobins. Previously, Morris and Sunde (2013) outlined protocols for recombinant expression in Escherichia coli, purification, and ThT-based monitoring of hydrophobin self-assembly21. This work extends those methods by describing a modified procedure for purifying the hydrophobin SC16. SC16 is a class I hydrophobin (from Schizophyllum commune) that can be easily purified from E. coli without requiring denaturation, reduction, or reoxidation of disulfide bonds. The resulting SC16 protein is functional, as demonstrated by end-point and kinetic ThT-based self-assembly assays that monitor rodlet formation. The goal of this article is to detail a comprehensive and streamlined protocol for the recombinant production, purification, and functional ThT-based assays of the class IB hydrophobin SC16.
Protocol
This study does not involve human participants, vertebrate animals, or tissue sampling. Therefore, no ethical approval was required.
1. Expression of Hydrophobin SC16 in E. coli
- Transform SHuffle T7 Express E. coli cells by heat shock at 42°C for 45 s using a pET-21 expression plasmid encoding a hexahistidine-tagged B1 domain of protein G fused to SC16 (H-GB1-SC16).
NOTE: SHuffle T7 Express cells were selected for their ability to promote correct disulfide bond formation29. The H-GB1-SC16 plasmid can be generated by restriction enzyme cloning as previously described30. - Inoculate 2 mL of lysogeny broth (LB) containing 100 µg mL−1 ampicillin with a single colony. Incubate overnight at 37°C with shaking.
- Inoculate 1 L of LB (in a 2.8 L baffled round-bottom flask) with 1 mL of the overnight culture. Grow the culture at 37°C with shaking (~120–135 rpm, circular orbit of 19 mm) until the optical density at 600 nm reaches 0.6 ± 0.1.
- Add isopropyl-β-D-1-thiogalactopyranoside to a final concentration of 0.5 mM to induce expression of H-GB1-SC16. Incubate overnight at 20°C with shaking.
NOTE: This temperature was chosen to reduce the risk of inclusion body formation and improper folding31. - Harvest the cells by centrifugation at 4000 × g for 20 min. Pour off the supernatant.
PAUSE POINT: Store the cell pellet at −20°C for up to 3 weeks before proceeding to purification. Avoid repeated freeze–thaw cycles.
2. Purification of Hydrophobin SC16
- Resuspend the cell pellet in 30 mL of lysis buffer (20 mM tris(hydroxymethyl)aminomethane [Tris], pH 8, 250 mM NaCl).
- Lyse the cells by incubating the suspension in an 80°C water bath for 15 min. Mix gently every 5 min during incubation.
NOTE: This step relies on SC16 heat stability and may not be suitable for other proteins.
CAUTION: Use heat-resistant gloves when handling tubes and water baths at 80°C. Avoid splashing hot liquid during mixing and tube removal. - Centrifuge the cell lysate at 25,000 × g for 20 min at 4°C. Load the supernatant onto a gravity column containing 2–3 mL Ni2+-charged immobilized metal affinity chromatography (IMAC) resin.
- Wash the column with lysis buffer containing 30 mM imidazole. Elute protein using 10 mL of lysis buffer containing 300 mM imidazole.
- Dialyze the eluted fraction against 1 L of buffer containing Tris (pH 8; 20 mM) and NaCl (50 mM) for 3 h using 3500 kDa molecular weight cutoff dialysis tubing, stirring at 100 rpm.
NOTE: Stirring speed during dialysis may vary depending on the setup (for example, tubing volume and beaker geometry). Stir at the minimum rpm necessary to induce gentle rotation of the dialysis bag. - Add thrombin protease (20 U mg−1 fusion protein) directly to the dialysis bag (10 mL total reaction volume) to cleave the fusion protein. Replace the buffer.
PAUSE POINT: After protease addition and buffer replacement, continue dialysis overnight at 4°C. Resume purification the next day. Verify cleavage completion by SDS-PAGE (expect disappearance of the ~18 kDa band and appearance of bands at ~10 and ~8 kDa). - Reload the dialyzed sample onto the Ni2⁺-charged IMAC column. Wash and elute with approximately 12 mL each of buffer containing 30 mM and 300 mM imidazole, respectively.
- Analyze collected fractions by sodium dodecyl sulfate–polyacrylamide gel electrophoresis (SDS-PAGE) under reducing conditions (using β-mercaptoethanol in the loading buffer). Identify SC16 by the presence of a band in the wash fraction at the expected molecular weight (~10 kDa). Dialyze the wash fraction containing SC16 in its entirety against 1 L of buffer containing Tris (pH 8; 20 mM) and NaCl (50 mM) for 3 h to remove residual imidazole.
NOTE: SC16 is typically detected in the wash fraction, whereas H-GB1 is typically enriched in the eluate. A small amount of residual SC16 may also be present in the eluate. - Quantify SC16 by a method of choice (e.g., amino acid analysis by high-performance liquid chromatography, Bradford assay, or absorbance at 280 nm). Using this method, yields of ≥5 mg SC16 per liter of culture are expected.
NOTE: Our group routinely quantifies SC16 by absorbance at 280 nm using a predicted extinction coefficient of 3480 M−1 cm−1 32 This is the preferred method of SC16 quantification due to its simplicity. - Collect samples throughout purification for SDS-PAGE analysis.
3. End-Point Fluorescence Assay of SC16 Self-Assembly
- Prepare triplicate reaction mixtures containing 50 µg mL−1 SC16, 50 mM NaCl, and 20 mM each of 2-(N-morpholino)ethanesulfonic acid (MES), Tris, and sodium phosphate. Prepare a stock buffer ahead of time containing MES, Tris, and sodium phosphate adjusted to a final pH of 6.5 by dropwise addition of concentrated HCl or 1 M NaOH. Add protein and NaCl immediately prior to beginning the assay.
NOTE: Controls can be prepared at this step. For example, include positive controls containing SC16 that do not undergo end-over-end rotation and negative controls containing buffer only. SC16 concentrations from 25–100 µg mL−1 have been tested, with results most consistent at 50 µg mL−1. Optimize this parameter as needed. - Transfer the mixtures into 2–5 mL tubes.
NOTE: Ensure the sample tube is filled to 50% capacity to allow proper mixing upon inversion. - Rotate the tubes end-over-end at 20 rpm for 2 h. Transfer 100 µL of each sample into an opaque-bottomed black 96-well plate with round, chimney-style wells.
- Add filtered ThT to a final concentration of 20 µM to all samples.
- Set the microplate reader to excitation and emission wavelengths within the appropriate range for ThT fluorescence33,34,35,36. Set the gain to 55 and integration time to 20 µs. Measure fluorescence intensity for each sample immediately after the 2 h rotation period.
NOTE: The reported excitation and emission maxima of ThT are 450 nm and 490 nm37, respectively. This experiment used excitation and emission values of 438 and 494 nm, respectively, based on optical filter availability. End-over-end rotation was conducted using a fabricated rotation device.
4. Kinetic Fluorescence Assay of SC16 Self-Assembly
- Adjust the pH of the buffer stock (containing Tris, MES, and sodium phosphate) to 5.5, 6.5, 7.5, or 8.5 using concentrated HCl or 1 M NaOH prior to addition of SC16 and ThT. The mixed buffer system allows pH adjustment without changing buffer identity.
- Prepare triplicate 100 µL reaction mixtures in a black 96-well plate.
- For each well, include 50 µg mL−1 SC16, 50 mM NaCl, 20 µM filtered ThT, and 20 mM each of MES, Tris, and sodium phosphate. Prepare negative controls containing ThT and buffer only (without SC16).
- Place the plate in the microplate reader.
- Set excitation and emission wavelengths within the appropriate range for ThT fluorescence33,34,35,36.
- Program the reader for cyclic measurements every 70 s.
- Include 60 s of orbital shaking at 432 rpm, followed by a 10 s rest period per cycle.
- Set the integration time to 20 µs and gain to 55.
- Run the assay for 120 cycles to monitor fluorescence changes over 2 h of shaking.
NOTE: Ensure orbital shaking is selected; linear shaking may yield inconsistent or suboptimal self-assembly results.
Results
Figure 1 presents a Coomassie-stained SDS-PAGE gel monitoring the purification of SC16. Codes represent marker (M), before induction (B), after induction (A), soluble fraction (S), flow-through (F), wash (W), eluate (E), and dialyzed (D). In the first IMAC eluate, a band with an estimated molecular weight of ~18 kDa corresponds to the H-GB1-SC16 protein before thrombin cleavage. After cleaving with thrombin, there is no protein in the second IMAC flow-through fraction, and a ~10 kDa band corresponding to SC16 in the wash. In the second IMAC eluate, there is some residual SC16 and a smaller ~8 kDa protein corresponding to H-GB1. Purified SC16 was then used for end-point and kinetic self-assembly assays. These results confirm successful purification of SC16, as indicated by the presence of the expected molecular weight band and the separation of the H-GB1 fusion partner following thrombin cleavage.
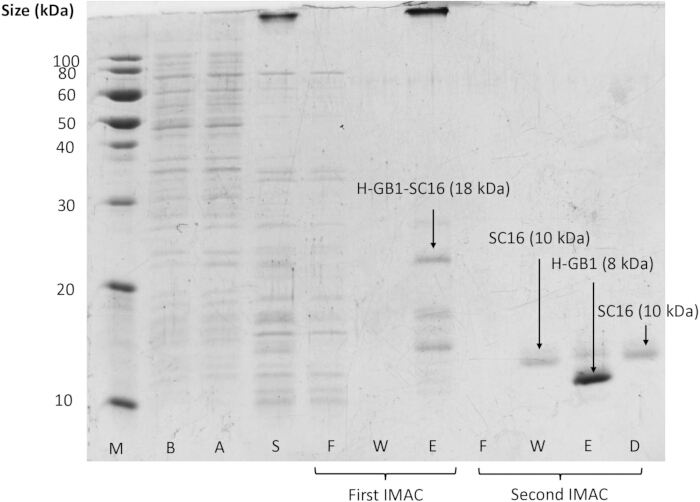
Figure 1. SDS-PAGE analysis of the purification of SC16 for the first (before thrombin cleavage) and second (after thrombin cleavage) IMAC separations. A molecular weight marker (M) is shown, along with samples collected before induction (B), after induction (A), the cell lysis supernatant (S), flow-through (F), wash (W), and eluate (E) fractions, as well as the dialyzed sample (D). Please click here to view a larger version of this figure.
The end-point ThT assay of SC16 self-assembly presented in Table 1 reveals an 11-fold increase in ThT fluorescence intensity after 2 h of benchtop rotation compared to protein-containing controls that were not rotated. Likewise, we observe no significant change in fluorescence intensity upon rotation of buffer samples. This increase in ThT fluorescence upon agitation of SC16 represents the formation of amyloid-like β-sheets that are indicative of SC16 self-assembly24,25. These results demonstrate that the described fluorescence-based assay effectively monitors SC16 self-assembly under the conditions tested.
| Sample | ThT Fluorescence (Counts ± SD) |
| SC16 without rotation | 2679 ± 177 |
| SC16 after rotation | 30315 ± 2141 |
| Buffer after rotation | 665 ± 888 |
Table 1. ThT fluorescence measurements collected after end-over-end rotation of SC16 samples. SC16 (50 µg mL−1) samples were either incubated without agitation or subjected to rotation for 2 h. ThT (20 µM) was added prior to fluorescence measurements. Fluorescence was measured at excitation and emission wavelengths of 438 and 494 nm, respectively, and is reported as raw counts. Values are presented as mean ± standard deviation (SD).
The kinetic self-assembly assay of SC16 when agitated in varying buffers for several hours is presented in Figure 2. Typical S-shaped kinetic self-assembly curves for amyloid fibrillation include characteristic lag, growth, and plateau periods38. For SC16, no substantial lag period is observed during initial readings, although this behavior has been documented for other hydrophobins, such as EAS21,23. Self-assembly curves for each pH are comparable, with strong, positive slopes corresponding to rodlet formation. After approximately 20 min of agitation, the fluorescence intensity plateaus and then slowly tapers. In control samples lacking SC16, there are no substantial changes in fluorescence throughout the experiment.
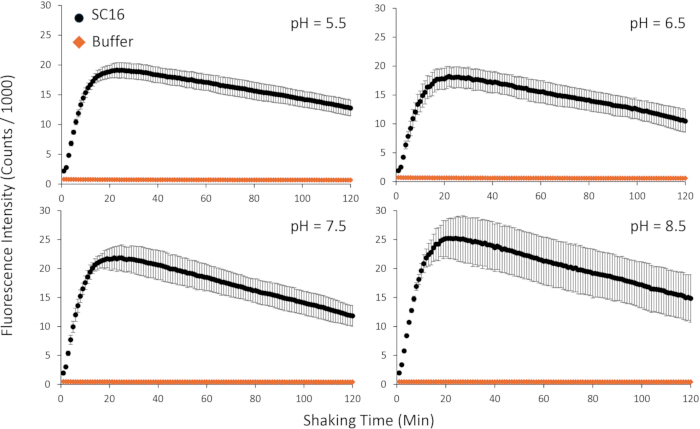
Figure 2. Self-assembly curves of SC16 measured using a kinetic ThT fluorescence assay. SC16 was prepared at 50 µg mL−1 in a multicomponent buffer containing 20 µM of ThT, 50 mM NaCl, 20 mM sodium phosphate, 20 mM MES, and 20 mM Tris. Measurements were taken following 60 s of orbital shaking and a 10 s rest period. The x-axis represents shaking time (total 2 h). Fluorescence was measured using excitation and emission wavelengths of 438 nm and 494 nm, respectively, and is reported as counts × 10−3. Error bars represent standard deviation (n = 3). Panels correspond to pH 5.5 (top left), 6.5 (top right), 7.5 (bottom left), and 8.5 (bottom right). Please click here to view a larger version of this figure.
Figure 3 shows an example of suboptimal results for the kinetic self-assembly assay. In this case, the assay was completed as described in the protocol section, except using a “linear” shaking setting rather than the “orbital” shaking setting.
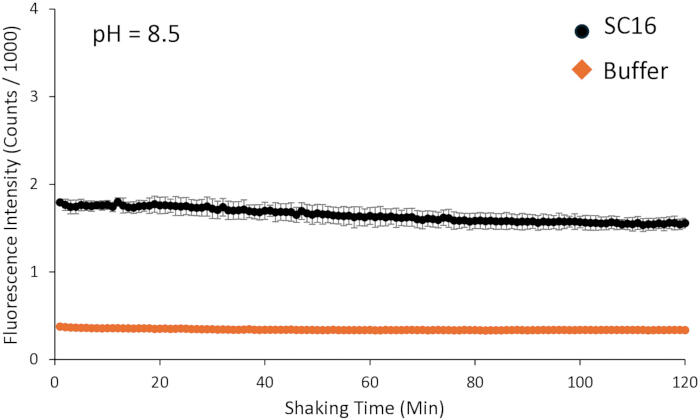
Figure 3. Example of suboptimal kinetic self-assembly data of SC16 obtained using the kinetic ThT fluorescence assay. In this case, shaking was performed using a linear setting instead of orbital shaking. Samples were prepared as described for Figure 2. Measurements were taken following 60 s of linear shaking and a 10 s rest period. The x-axis represents shaking time (total 2 h). Fluorescence was measured using excitation and emission wavelengths of 438 nm and 494 nm, respectively, and is reported as counts × 10−3. Error bars represent standard deviation (n = 3). Please click here to view a larger version of this figure.
Discussion
Here, we summarize protocols for the expression and purification of the hydrophobin SC16, as well as for low- and high-throughput fluorescence assays of SC16 self-assembly, each with distinct advantages and disadvantages. These workflows can be applied to related systems to monitor protein self-assembly. In this protocol, heat is used to lyse cells prior to SC16 purification, unlike most protocols that use more traditional methods to lyse E. coli. We have found that H-GB1-SC16 is soluble and heat-stable up to 80°C, and that heat lysis serves as an initial sample cleanup step by precipitating non-heat-stable proteases and other contaminant proteins within the cell lysate39. However, SC16 represents a special case, as hydrophobins are often expressed insolubly in inclusion bodies12,21,40. When expressed as inclusion bodies, denaturing conditions are typically required, followed by refolding using established protocols21,40,41.
In this protocol, SDS-PAGE is used to evaluate SC16 purification at each step, including the cell pellet before and after induction, the soluble fraction after cell lysis, and all subsequent column fractions. This is illustrated in Figure 1; however, compared to H-GB1, the band corresponding to SC16 is relatively faint. We have found that, for many hydrophobins, including SC16, achieving consistent and intense Coomassie staining is challenging. SC16 typically appears as a medium-intensity band when β-mercaptoethanol is used as a reducing agent (Figure 1). In some cases, silver staining may be required to visualize hydrophobins more clearly.
End-point and kinetic fluorescence assays can be used to monitor SC16 self-assembly. The end-point ThT assay is advantageous because it provides a rapid, simple assessment of self-assembly. In addition to increased fluorescence after 2 h of benchtop rotation, self-assembly is often accompanied by visible white cloudiness in the reaction tube. This assay uses a simple benchtop rotator for mixing, which minimizes wear on microplate reader components. In our experience, this assay is relatively insensitive to instrumental parameters, such as shaking settings in a microplate reader.
The kinetic ThT assay provides more detailed information on self-assembly. For example, SC16 self-assembly does not depend appreciably on buffer conditions24, although greater variation between replicates is observed at higher pH values. However, this behavior is not universal among hydrophobins, and factors such as salt concentration, pH24,27,42, and additives (e.g., detergents or alcohols) are known to influence hydrophobin self-assembly27,28. For example, the hydrophobin SLH4 shows more efficient self-assembly at low ionic strength and low pH24, whereas HFBII self-assembly has been reported to be independent of pH and electrolyte concentration42, similar to SC16. Other studies have correlated the effects of additives on rodlet formation with changes in surface tension27,28. Given these differences, it is important to consider buffer composition and pH for each system and to monitor their influence on the self-assembly curve, including lag phase, growth, and plateau regions.
An important limitation is that the kinetic ThT assay is highly sensitive to the microplate reader's instrumental parameters and may vary across instruments. For example, a substantial difference in SC16 self-assembly is observed between orbital (circular motion) and linear (back-and-forth) shaking settings (Figure 2 and Figure 3, respectively). While ThT-based assays provide an effective method to model hydrophobin self-assembly, they have inherent limitations due to variable selectivity, which can lead to false-positive or false-negative signals43. Additionally, light scattering from hydrophobin aggregates may influence measured fluorescence intensity44, reducing measurement accuracy. Sample dilution and reduced path length may help mitigate these effects.
The protocols summarized here provide effective methods for purifying and monitoring the self-assembly of SC16. The end-point assay is straightforward and less dependent on instrumentation, while the kinetic assay provides detailed time-resolved information, albeit with greater sensitivity to instrumental parameters. This protocol outlines a simple approach to purifying SC16 and may be applicable to other properly folded hydrophobins expressed in E. coli. Although the ThT assays described have inherent limitations, they provide accessible time-dependent self-assembly information compared to techniques such as AFM or contact angle measurements alone. These workflows can be adapted for related proteins and are particularly relevant for applications in biomaterials development, drug delivery, and other areas where understanding protein self-assembly is important.
Disclosures
The authors declare no competing financial or non-financial interests.
Acknowledgements
The authors acknowledge funding from the New Frontiers in Research Fund (Exploration Stream; NFRFE-2023-00322) and the Natural Sciences and Engineering Research Council of Canada (NSERC; Discovery Grant; RGPIN-2024-06440). IED is supported by a Canada Graduate Scholarship – Master’s Program (NSERC). RH is supported by the Molly Appeal Donors through the Dalhousie Faculty of Medicine 2024 Graduate Studentship Program and the Nova Scotia Graduate Scholarship (doctoral level).
Materials
| Name | Company | Catalog Number | Comments |
|---|---|---|---|
| 2-(N-morpholino)ethanesulfonic acid (MES) | Sigma-Aldrich | 145224-94-8 | Buffer component for self-assembly assays |
| 5 mL round bottom polystyrene tube | Falcon | 352054 | Used for low-throughput self-assembly assays |
| 96-well black polystyrene microplate | Grenier | 655076 | Used for fluorescence measurements in microplate reader |
| Acrylamide/Bis-acrylamide (29:1) solution (40%) | BioShop | ACR004.500 | Used to prepare SDS-PAGE gels |
| Agar | BioShop | AGR002.1 | Agar used to make ampicillin-resistant LB plates |
| Ampicillin | IBI Scientific | IB02040 | Antibiotic used in LB-agar plates |
| Baffled 2.8 L Fernbach flasks | Fisher Scientific | 955239 | Used for large-volume bacterial culture growth |
| β-mercaptoethanol | TCI Chemicals | 60-24-2 | Reducing agent used in SDS-PAGE sample preparation |
| Column (1.5 cm diameter gravity column) | Bio-Rad | 7371522 | Used for nickel affinity purification |
| Dialysis tubing (3500 kDa MWCO) | BioDesign | D302 | Used for buffer exchange during purification |
| Emission filter | Edmund Optics | 84080 | Used for ThT assays (494 nm, bandpass 20 nm) |
| Excitation filter | Edmund Optics | 67012 | Used for ThT assays (438 nm, bandpass 24 nm) |
| Fluorescence microplate reader | Tecan | Infinite F200 Pro | Used to measure ThT fluorescence intensity |
| Hotplate | Lab Fish | HS5C | Used for water bath setup with temperature monitoring |
| Hydrochloric acid (HCl) | Fisher Chemical | A144-212 | Used for pH adjustment of buffers |
| Imidazole | TCI Chemicals | 288-32-4 | Used in IMAC purification (wash and elution buffers) |
| Isopropyl β-D-1-thiogalactopyranoside (IPTG) | Sigma-Aldrich | 367-93-1 | Induces protein expression in E. coli |
| LB broth (Lennox) | BioShop | LBL405.5 | Growth medium for bacterial culture |
| Low-speed refrigerated centrifuge | Beckman Coulter | 360291 | Used to pellet cells before storage |
| Nickel NTA agarose beads | GoldBio | H-350-50 | Resin used for affinity purification of His-tagged proteins |
| SC16 plasmid | BioBasic | N/A | Custom DNA construct encoding H-GB1-SC16 fusion protein |
| SHuffle T7 Express competent E. coli | New England Biolabs | C3029J | Host strain used for recombinant protein expression |
| Sodium chloride (NaCl) | BioShop | SOD001.5 | Buffer component and ionic strength regulator |
| Sodium hydroxide (NaOH) | Fisher Chemical | SS255-1 | Used for pH adjustment of buffers |
| Sodium phosphate | BioShop | SPD579.1 | Buffer component for maintaining pH |
| Spectrophotometer | Pharmacia Biotech | 5096 | Used for quantification of SC16 |
| Thioflavin T (ThT) | Acros Organics | 2390-54-7 | Fluorescent dye used to monitor protein self-assembly |
| Thrombin protease | Sigma-Aldrich | 04-04-9002 | Used for cleavage of H-GB1-SC16 fusion protein |
| Tris(hydroxymethyl)aminomethane (Tris) | BioShop | TRS001.5 | Buffer used in purification and assay solutions |
| High-speed refrigerated centrifuge | Sorvall | 46915 | Used to clarify lysate after cell lysis |
| SDS-PAGE setup | Bio-Rad | 1658000EDU | Used to prepare and run SDS-PAGE gels |
Reprints and Permissions
