Antibiotic resistance amongst adherent-invasive Escherichia coli strains poses challenges for assessing bacterial invasion using the traditional gentamicin protection assay. An improved method to evaluate bacterial invasion quantitatively by enumerating colony-forming units and qualitatively through visualization of infected cells by immunofluorescence confocal microscopy is described.
Method Article
Amikacin Protection Assay for Quantification and Visualization of Escherichia coli Cell Invasion
In This Article
Summary
Abstract
Epithelial cell invasion is a key phenotype for many enteric pathogens, including Salmonella, Shigella, and Vibrio. An emerging invasive pathogen is adherent-invasive Escherichia coli (AIEC), which is implicated in the pathogenesis of inflammatory bowel disease (IBD). AIEC strains lack virulence factors commonly associated with other invasive pathogens, making genetic identification challenging. As a result, AIEC strains are classified phenotypically based on their ability to invade epithelial cells using a field-standard gentamicin protection assay. However, since AIEC strains are often isolated from IBD patients who receive various antibiotics as part of their treatment regimen, the rise of gentamicin-resistant isolates has made this assay less reliable for AIEC classification. To circumvent this issue, an alternative amikacin-based protection assay was developed to quantify and visualize AIEC cell invasion. This assay utilizes amikacin, a broad-spectrum semisynthetic aminoglycoside that effectively targets strains resistant to other aminoglycosides while remaining extracellular to eukaryotic host cells. Thus, extracellular bacteria are killed during infection while intracellular bacteria are "protected". This forms the basis of a quantitative assay to compare strain invasiveness, measured as the percent invasion score using colony-forming-units (CFU) recovered post-infection. This assay can also be used as a qualitative measurement of invasion by immunostaining infected epithelial cells and visualizing these cells through confocal microscopy. This method serves as a diagnostic tool to screen IBD patients for AIEC that can also be applied to other multidrug-resistant pathogens to assess cell invasion, a proxy for virulence and pathogenicity.
Introduction
Inflammatory bowel disease (IBD), which includes Crohn’s disease (CD) and ulcerative colitis, is a chronic gastrointestinal inflammatory condition that affects millions of people worldwide1. Despite the rising global incidence of IBD, its precise etiology remains unclear, owing to the complex interplay of genetic, environmental, microbial, and immunological factors2,3. A signature feature of IBD is altered gut microbial composition, which is often driven by environmental factors, such as a high-sugar, high-fat diet common in industrialized countries4,5. The microbiota of IBD patients is frequently characterized by reduced microbial diversity, enrichment of pathogenic Gammaproteobacteria, and depletion of protective Firmicutes6,7. In patients with CD, Escherichia coli (E. coli) is enriched in the gut microbiota, associates with and invades the intestinal mucosa, and positively correlates with active and severe disease8,9. This emerging pathotype of E. coli associated with CD is termed adherent-invasive Escherichia coli (AIEC).
AIEC are gram-negative opportunistic pathogens that colonize the ileal mucosa of CD patients at a greater propensity than healthy controls10. AIEC strains isolated from CD patients are genetically diverse, often spanning all E. coli phylogroups that include both commensal and pathogenic E. coli11. Unlike pathogens such as Shigella and Salmonella, which rely on the use of type III secretion systems to facilitate invasion of host cells, AIEC lack these conserved virulence systems12. Therefore, our understanding of AIEC virulence largely relies on its in vitro phenotype, which is characterized by its ability to adhere to and invade epithelial cells and survive within macrophages10.
Epithelial cell invasion by AIEC is mediated by multiple virulence factors, including the type 1 pilus and long polar fimbriae. FimH, located at the tip of the type 1 pilus, mediates adhesion to mannose residues on the heavily glycosylated host receptor CEACAM613. This binding promotes AIEC entry into enterocytes and supports its intracellular replication14. AIEC also adheres to microfold (M) cells, specialized epithelial cells located above Peyer's patches through interactions between its long polar fimbriae and the M cell surface protein glycoprotein 215,16. This adhesion enables AIEC to translocate across M cells, reach underlying macrophages, and trigger the expression of pro-inflammatory cytokines such as TNF-α, which not only promotes inflammation but also supports bacterial replication within macrophages17,18. These pathogenic mechanisms are hypothesized to perpetuate chronic inflammation in the host, as observed in CD.
AIEC are defined by their in vitro phenotype, making the gentamicin protection assay indispensable for strain classification and virulence factor discovery8. This approach can be complicated by gentamicin-resistant isolates, which can result in their misclassification as invasive11. To circumvent this issue, alternative antibiotics that effectively kill gentamicin-resistant isolates without penetrating host cell membranes were tested. Through this approach, amikacin was identified as a suitable substitute for gentamicin, offering comparable efficacy and compatibility with standard invasion assays, as well as minimal cytotoxicity, as evidenced by trypan blue staining in previous studies and further validated here using a lactate dehydrogenase release assay (Supplementary Figure 1)11. Amikacin is a semisynthetic aminoglycoside derived from kanamycin that inhibits bacterial growth by disrupting protein synthesis19. Amikacin is particularly effective against multi-drug resistant gram-negative bacteria, including Pseudomonas, Acinetobacter, and Escherichia species19. Notably, structural modifications to the kanamycin backbone render amikacin less susceptible to bacterial aminoglycoside-inactivating enzymes19. As a result, amikacin represents a robust alternative to gentamicin for targeting multi-drug-resistant bacteria in invasion assays. The following protocols describe how to assess the invasion phenotype of E. coli using both the reference strain NRG857c and clinical isolates with the amikacin protection assay.
Protocol
NOTE: This protocol describes a method for assessing the invasion capacity of AIEC strains into Caco-2 epithelial cells. The amikacin concentration used in this protocol (240 µg/mL) corresponds to 10× the minimal inhibitory concentration (MIC), as determined using amikacin MIC test strips across a panel of 32 representative AIEC clinical isolates from 13 patients with inflammatory bowel disease11. Investigators should determine the MIC for their own AIEC isolates prior to performing the assay (see Table of Materials), as antibiotic susceptibility can vary between isolates. Section 1 details the amikacin protection assay for the quantification of percent invasion, and Section 2 describes the amikacin protection assay for confocal microscopy.
1. Amikacin Protection Assay for Quantification of Percent Invasion
- Collagen coating of 24-well plates
- Dilute 35.29 µL of sterile glacial acetic acid (see Table of Materials) in 30 mL of 1× PBS (see Table of Materials) in a 50 mL conical tube.
- Pipette 300 µL of collagen (see Table of Materials) into the 1× PBS with acetic acid solution.
- Vortex solution for 10 s to mix well.
- Dispense 250 µL of the diluted collagen solution into each well of a sterile 24-well tissue culture treated plate.
NOTE: The 30 mL collagen solution is sufficient to coat approximately five 24-well plates. - Tilt the plate in all directions to ensure the solution has uniformly covered the bottom of each well.
- Incubate the plates at 37 °C for 2 h to allow the collagen to adhere to the plastic surface.
- After incubation is complete, aspirate the collagen solution from each well.
- Pipette 1 mL of 1× PBS into each well to wash off residual collagen and aspirate each well. Repeat this step 2 more times (3 washes in total).
- Dry plates inside a biological safety cabinet to ensure all visible moisture has evaporated.
NOTE: Plates can be used immediately for cell seeding or can be stored at room temperature. When storing plates, seal the outer perimeter with sterile parafilm or place them inside a sterile zip lock bag.
- Preparation of amikacin stock solutions
- Weigh 240 mg of amikacin disulfate (see Table of Materials) and transfer to a 1.5 mL microcentrifuge tube.
- Pipette 1 mL of sterile water and solubilize amikacin by vortexing, yielding a final concentration of 240 mg/mL (1000× stock).
- Make 20 µL aliquots of the amikacin solution and store at -20 °C.
NOTE: Amikacin is stable at -20 °C for 6–12 months. Prepare single-use aliquots to minimize repeated freeze-thaw cycles.
- Preparation of Caco-2 cells
- Thawing Caco-2 cells from frozen stock
- Prepare complete growth media by supplementing high-glucose Dulbecco's Modified Eagle Medium (DMEM, see Table of Materials) with 10% fetal bovine serum (FBS, see Table of Materials) and 1% antibiotic-antimycotic solution (see Table of Materials).
- Pre-warm media in a 37 °C water bath for 30 min.
- Place the frozen vial of Caco-2 cells in a 37 °C water bath and incubate for 1–2 min until the cells are fully thawed.
- Remove the vial from the water bath and spray the exterior of the vial with 70% ethanol.
- Inside a biological safety cabinet, pipette the cells into a 15 mL conical tube containing 9 mL of complete growth media.
- Centrifuge cells at 500 × g for 5 min at room temperature.
- Aspirate the supernatant and resuspend the cell pellet in 5 mL of complete growth media.
- Transfer cells into a 75 cm2 tissue culture flask (T75) containing 10 mL of warm complete growth media.
- Swirl the plate 3 times to ensure cells are evenly distributed across the bottom of the plate.
- Incubate the cells at 37 °C with 5% CO2 until the cells reach ~90% confluency (6–7 days).
NOTE: Confluency is estimated by visualization approximation of the cells using a light microscope. Replace media every 3 days while cells are recovering.
- Seeding Caco-2 cells
- Pre-warm complete growth media and 0.25% (w/v) trypsin-EDTA (see Table of Materials) in a 37 °C water bath.
- Once Caco-2 cells reach ~90% confluency, aspirate cell culture media and add 2 mL of trypsin-EDTA. Tilt the flask to allow the trypsin solution to cover the entire bottom surface of the flask to ensure all traces of FBS are inactivated.
- Aspirate trypsin-EDTA solution and add 3 mL of trypsin-EDTA. Incubate the cells at 37 °C with 5% CO2 for 5–15 min. Visualize the cells using a light microscope at various time points during the incubation period to observe cell rounding, indicating the cells have detached.
NOTE: Avoid hitting the side of the flask to facilitate cell detachment as this can cause cells to clump. - Pipette 6 mL of complete growth media to deactivate the trypsin-EDTA solution and mix by pipetting up and down gently to resuspend the cells.
- Pipette cells into a 15 mL conical tube and centrifuge at 500 × g for 5 min to pellet cells.
- Aspirate media and resuspend cells in 3 mL of complete growth media.
- Transfer 10 µL of the suspended Caco-2 cells to a 1.5 mL microcentrifuge tube. Add 10 µL of Trypan blue dye (see Table of Materials) to the 1.5 mL microcentrifuge tube and mix by pipetting up and down several times.
- Pipette 10 µL of the Caco-2/Trypan blue mixture to a cell counter slide (see Table of Materials). Enumerate the number of live cells to calculate cell viability.
NOTE: When enumerating the number of Caco-2 cells present, only consider the number of live cells, not the total number of cells for seeding. - Seed Caco-2 cells in a 24-well plate or a T75 flask.
- For a 24-well plate, follow the steps below:
- Seed Caco-2 cells at a concentration of 1 x 10⁵ cells/mL using the equation below:
[(1 × 10⁵ cells)(Number of wells seeding + 2)] / [Viable cell count concentration (cells/mL)] = cells (mL) - Remove the volume of cells calculated above from the suspended Caco-2 cells in step 3.2.6 into a 15 mL conical tube. Calculate the volume of complete growth media to add to the cells using the equation below:
(Number of wells seeding + 2 wells) - cells (mL) = media (mL)
NOTE: The "+2 wells" in the calculation is to account for pipetting error. - Pipette the volume of media calculated above into the 15 mL conical containing the Caco-2 cells and mix by pipetting up and down several times.
- Pipette 1 mL of Caco-2 cells in complete growth media (final concentration 1 x 10⁵ cells/mL) into each well of the collagen-coated 24-well plate.
- Incubate plate at 37 °C with 5% CO2 until cells reach ~90% confluency (3–4 days).
- Seed Caco-2 cells at a concentration of 1 x 10⁵ cells/mL using the equation below:
- For a T75 flask, follow the steps below:
- Transfer 7.5 x 10⁵ viable cells to a T75 flask using the following equation:
[(7.5 × 10⁵ cells)] / [viable cell count concentration (cells/mL)] = cells (mL)
NOTE: The number of viable cells to add to the T75 flask was determined based on ATCC guidelines for Caco-2 cell culture. - Remove the volume of cells calculated above and transfer to a T75 flask. Calculate the volume of complete growth media to add to the cells using the equation below:
15 mL - volume of cells added to flask = media (mL) - Pipette the volume of media calculated above to the T75 flask.
- Swirl the plate gently several times to evenly disperse the cells across the bottom of the flask. Incubate at 37 °C with 5% CO2 until cells reach ~90% confluency (3–4 days).
- Transfer 7.5 x 10⁵ viable cells to a T75 flask using the following equation:
- Thawing Caco-2 cells from frozen stock
- Amikacin Protection Assay
NOTE: Ensure all cell culture media is pre-warmed to 37 °C prior to the start of the experiment.- Preparation of bacteria
- Using a sterile wooden stick or a sterile pipette tip, gently scrape off bacteria from a frozen bacterial glycerol stock stored at -80 °C and streak on an LB agar plate for single colonies. Incubate the plate at 37 °C overnight.
- Using a sterile wooden stick or a sterile pipette tip, pick up a single colony from the agar plate and inoculate into 3 mL of LB broth. Incubate the culture at 37 °C with shaking at 200 rpm overnight.
- Perform a 1:10 dilution of the overnight culture in 1 mL LB broth and measure the optical density at 600 nm (OD600) of the culture using a spectrophotometer.
- Multiplicity of infection (MOI) calculation
- Transfer 100 µL of the overnight culture to a 1.5 mL microcentrifuge tube and centrifuge at 6000 × g for 10 min at 4 °C.
- Aspirate the supernatant carefully to not disturb the cell pellet. Resuspend the pellet in 1 mL of serum and antibiotic-antimycotic-free media.
NOTE: This is a 1:10 dilution of the bacterial overnight culture. For the MOI calculation, use the raw OD600 value calculated for the diluted overnight culture in step 4.1.3, not the OD600 value corrected for the dilution factor. - Calculate the volume of bacterial suspension to add from step 4.2.2 to infect Caco- 2 cells at an MOI of 10 using the following calculation:
[1 OD unit/2.4 × 109 bacteria] × [10 bacteria/cell] × [1 mL × OD 1:10] × 1 ×105 ×103 = volume (uL)
NOTE: Carefully record the calculated volume for each sample as this value will be used later to calculate the inoculum CFU/mL. This volume of bacterial suspension is only for 1 well within the 24-well plate. - Prepare the infection media by transferring the calculated volume of bacterial suspension from step 4.2.3 into a sterile 1.5 mL microcentrifuge tube. Add 1 mL of serum and antibiotic-antimycotic free media. Mix gently by pipetting up and down several times.
- Caco-2 cell infection
- Remove the 24-well plate containing the Caco-2 cell monolayers from the incubator and aspirate the complete media.
- Pipette 1 mL of serum and antibiotic-antimycotic free media to each well and aspirate to remove traces of serum-containing media. Repeat this step 1 more time (2 washes in total).
NOTE: Reduce vacuum pressure when aspirating to avoid disrupting the cell monolayer. - Pipette 1 mL of the infection media from step 4.2.4 to each well of the 24-well plate containing the Caco-2 cells.
- Centrifuge the 24-well plate at 500 × g for 15 min at room temperature to synchronize bacterial contact with the epithelial cells.
- Incubate the 24-well plate at 37 °C with 5% CO2 for 3 h to allow for bacterial invasion.
- During the incubation period, determine the CFU/mL of the diluted overnight culture from step 4.2.2 by performing 10-fold serial dilutions in sterile 1× PBS using a 96-well plate.
- To prepare each dilution, transfer 200 µL of the diluted overnight culture from step 4.2.2 to the first well in the plate.
- Pipette 20 µL of the culture to the next row which contains 180 µL of 1× PBS. Mix by pipetting up and down 10 times. Repeat until dilutions reach 10-6 using a fresh pipette tip for transfer each time.
- Plate 10 µL of spot dilutions in triplicate from the 10-2 to 10-6 dilutions onto LB agar plates. Allow the spots to absorb into the agar under a flame.
- Incubate plates overnight at 27–30 °C to prevent the overgrowth of colonies and ensure clear, separate individual colonies.
NOTE: Spot plating in triplicate improves quantification accuracy and enables detection across a range of bacterial concentrations. Lower incubation temperature slows bacterial growth, enabling more accurate CFU estimation from high-concentration samples.
- Prepare antibiotic containing media by adding 240 µg/mL amikacin to pre-warmed serum and antibiotic-antimycotic free media.
- After the 3 h infection is complete, aspirate the media from the Caco-2 cell monolayers. Add 1 mL of serum and antibiotic-antimycotic free media to each well. Repeat this step 1 more time (2 washes in total).
- Pipette 1 mL of 240 µg/mL amikacin-containing media into each well and incubate at 37 °C with 5% CO2 for 1 h to eliminate extracellular bacteria.
- Aspirate the media from each well and add 1 mL of 1× PBS to wash away adherent bacteria killed by amikacin. Repeat this step 1 more time (2 washes in total).
- Pipette 200 µL of 1% Triton-X-100 (see Table of Materials) diluted in 1× PBS into each well. Incubate on an orbital shaker at 90 rpm for 10 min to lyse epithelial cells.
- Detach cells from the 24-well plate by pipetting up and down approximately 30 times per well.
NOTE: Since coating the plates with collagen improves cell adherence, it is important to ensure the monolayer has detached from the plate. This can be confirmed visually by comparing a lysed well relative to a non-lysed well and a well without Caco-2 cells, which will look clear. - Perform 10-fold serial dilutions of the cell lysates in a 96-well plate using 1× PBS.
NOTE: Perform serial dilutions until the 10-3 dilution. - Plate 10 µL of spot dilutions in triplicate, ranging from the undiluted to 10-3 dilutions, onto LB agar plates. Allow the spots to absorb into the agar under a flame. Incubate plates overnight at 27–30 °C to prevent colony overgrowth and ensure clear, separate individual colonies.
- Colony counting and percent invasion calculation
- After overnight incubation, count the number of colonies in each spot dilution from the diluted overnight culture and the retrieved lysate. Select a dilution in which each spot contains more than 7 isolated colonies. Use the same dilution across the triplicates to calculate an average number of bacterial colonies retrieved for that dilution.
NOTE: Count spot dilutions containing well-isolated single colonies and avoid counting dilutions that contain colonies that are touching. - Calculate the inoculum CFU/mL, retrieved CFU/mL, and percent invasion using the following equations below:
Inoculum CFU (CFU/mL):
CFUinoculum = (average number of colonies)(dilution factor)(volume from infection media (µL ) x 100
Retrieved CFU (CFU/mL):
CFUretrieved = (average number of colonies)(dilution factor) x 100
Percent Invasion (%):
Invasion (%) = [(CFUretrieved)/(CFUinoculum)] × 100
- After overnight incubation, count the number of colonies in each spot dilution from the diluted overnight culture and the retrieved lysate. Select a dilution in which each spot contains more than 7 isolated colonies. Use the same dilution across the triplicates to calculate an average number of bacterial colonies retrieved for that dilution.
- Preparation of bacteria
2. Amikacin Protection Assay for Confocal Microscopy
- Preparation of sterile poly-L-lysine coated coverslips
- In a biological safety cabinet use sterile forceps to place poly-L-lysine-coated coverslips (see Table of Materials) on a paper towel soaked in 70% ethanol.
- Spray both slides of the coverslips with 70% ethanol, using sterile forceps to flip the coverslip to each side.
- Allow coverslips to dry under UV light in the biological safety cabinet until completely dry.
- Seeding Caco-2 cells in a 6-well plate
- In a biological safety cabinet, place 1 poly-L-lysine-coated coverslip into each well of a 6-well plate.
- Repeat steps 3.2.1–3.2.8 from the “Seeding of Caco-2 cells” section.
- Seed Caco-2 cells at a concentration of 1 x 10⁵ cells/mL in a 6-well plate using the equation below:
[(1 × 10⁵ cells)(Number of wells seeding + 2)] / [Viable cell count concentration (cells/mL)] × 2 = cells (mL)
NOTE: This value is multiplied by 2 to account for adding 2 mL of media per well when using a 6-well plate. - Remove the volume of cells calculated above into a 15 mL conical tube. Calculate the volume of complete growth media to add to the cells using the equation below:
(Number of wells seeding + 2 wells) x 2 - cells (mL) = media (mL) - Pipette the volume of media calculated above into the 15 mL conical containing the Caco-2 cells and mix by pipetting up and down several times.
- Add 2 mL of Caco-2 cells in complete growth media to each well of the 6-well plate (final concentration 1 × 10⁵ cells/mL).
- Incubate the plate at 37 °C with 5% CO2 until cells reach ~90% confluency (2–3 days).
- Amikacin protection assay
- Perform the amikacin protection assay as written in Section 1, Steps 4.1-4.3.10
- Immunofluorescence staining
- Fixation and permeabilization of Caco-2 cells
- Fix cells by adding 1 mL of 4% paraformaldehyde diluted in 1X PBS (see Table of Materials) to each well. Incubate for 10 min at room temperature in the dark.
- Aspirate each well and add 1 mL of 1× PBS to wash cells. Repeat this step 2 more times (3 washes total).
NOTE: Cells can be stored for several days in 1X PBS at 4 °C. - Add 1 mL of 0.1% Triton-X-100 to each well and incubate for 10 min at room temperature to permeabilize cells.
- Aspirate Triton-X-100 solution and add 1 mL of 1× PBS to each well. Incubate cells with 1× PBS for 5 min. Repeat this step 2 more times (3 washes total).
- Blocking and antibody staining
- To prevent non-specific antibody binding prepare a blocking solution using 1% bovine serum albumin (BSA), 22.52 mg/mL glycine in 1× PBS + 0.1% Tween20 (see Table of Materials).
- Add 1 mL of blocking solution to each well and incubate for 1 h at room temperature.
NOTE: The blocking step can also be done at 4 °C for 16 h. - Aspirate blocking solution and incubate cells with anti-Rabbit E. coli primary antibody (see Table of Materials) diluted (recommended 1:500 dilution) in blocking solution for 1 h at room temperature.
NOTE: Incubation with the primary antibody can also be done at 4 °C for 16 h. - Aspirate primary antibody solution and add 1 mL of 1× PBS + 0.1% Tween20. Incubate cells in 1× PBS + 0.1% Tween20 for 5 min. Repeat this step 2 more times (3 washes total).
- Incubate cells with goat anti-Rabbit Alexa Fluor 488 secondary antibody (see Table of Materials) diluted (recommended 1:1000 dilution) in blocking solution for 1 h at room temperature. Wrap the plate in aluminum foil to protect the fluorophore from light.
- Aspirate the secondary antibody solution and add 1 mL of 1× PBS + 0.1% Tween20. Incubate cells in 1× PBS + 0.1% Tween20 for 5 min. Repeat this step 2 more times (3 washes total).
- Counterstaining and mounting the coverslip
- To stain host and bacterial DNA and host actin, prepare a combined dilution using 10 mg/mL Hoechst (recommended 1:2000 dilution, see Table of Materials) and Rhodamine-phalloidin (recommended 1:1000 dilution, see Table of Materials) in 1× PBS.
- Add 1 mL of dye solution to each well and incubate for 10 min.
- Remove dye solution and add 1 mL of 1× PBS to each well. Repeat this step 1 more time (2 washes total).
- Add 1 mL of 1× PBS and leave cells submerged in the solution.
- Place one drop of mounting medium (see Table of Materials) on the labeled slide.
- Carefully lift the coverslip from the 6-well plate using a bent needle and invert the coverslip so the side containing the cells is facing the slide containing the mounting media.
- Place the coverslip onto the mounting media. Ensure the mounting media is evenly dispersed across the entire coverslip.
- Incubate the mounted slides at room temperature overnight in the dark.
- Seal the edges of the coverslip using clear nail polish and store slides at 4 °C in a slide box.
- Image the mounted samples using the appropriate channels that correspond to the dyes/fluorophores used with a confocal microscope.
- Fixation and permeabilization of Caco-2 cells
Results
To evaluate the effectiveness of amikacin treatment in eliminating extracellular bacteria and to visualize intracellular invasion, we performed infection experiments using Caco-2 cell monolayers were performed. As shown in Figure 1, treatment with either gentamicin or amikacin following infection with E. coli NRG857c (positive control) or E. coli DH5α (negative control) resulted in similar invasion profiles. These findings indicate that amikacin is as effective as gentamicin in eliminating extracellular bacteria and accurately reflects intracellular bacterial burden, supporting its use as an alternative antibiotic for invasion assays. A recovery range of ~4-10% recovery of NRG857c and <1% for E. coli DH5α is considered acceptable for accurate interpretation of invasion phenotypes relative to mutant strains or other clinical isolates, consistent with previous observations11. If the percent invasion scores for the positive and negative controls are outside of this expected recovery range, the results should be interpreted with caution, and the assay should be repeated.
To demonstrate that amikacin can effectively target gentamicin-resistant clinical E. coli isolates, gentamicin and amikacin protection assays were performed in parallel, and the invasion profiles of the isolates were examined. As shown in Figure 2, treatment of gentamicin-resistant isolates with gentamicin resulted in highly variable recovery values, ranging from 21.52% to 2788.50%. In contrast, treatment with amikacin dramatically reduced recovery across all isolates, highlighting its effectiveness and enabling more accurate and reliable invasion measurements.
Finally, to assess the intracellular phenotype of AIEC during invasion, Caco-2 cells were infected with E. coli NRG857c. Figure 3 shows a representative image of an infected Caco-2 cell with bacteria (green) stained by immunofluorescence, host actin (red), and DNA (blue) visualized by counterstaining with rhodamine-phalloidin and Hoechst, respectively. At 4 h post-infection, NRG857c is observed replicating in the cytoplasm, localizing near the nucleus and within actin boundaries, which confirms the intracellular nature of these bacteria.
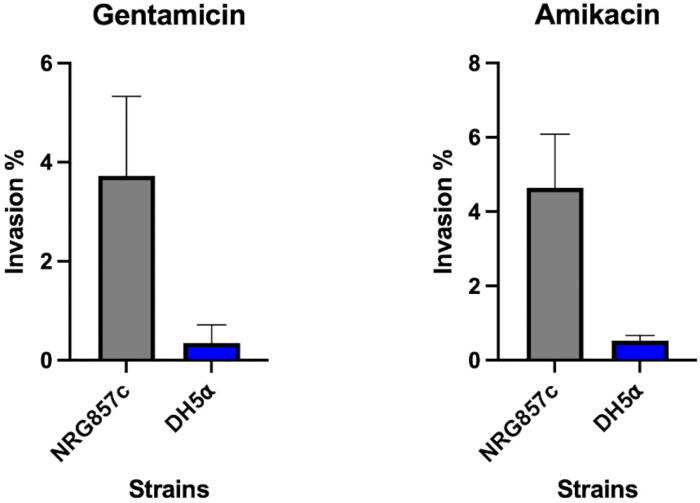
Figure 1: Addition of gentamicin or amikacin to Caco-2 cells infected with AIEC strain NRG857c result in comparable invasion profiles. Caco-2 cell monolayers were infected with AIEC strain NRG857c and E. coli DH5α at an MOI of 10. After 3 hours of infection, cells were treated for 1 h with gentamicin (100 µg/mL) or amikacin (240 µg/mL) to eliminate extracellular bacteria. Cells were then lysed with 1% Triton-X-100, and homogenates were serially diluted and plated on LB agar for CFU enumeration. Invasion was expressed as the percentage of recovered bacteria relative to the initial inoculum. Data represent three independent experiments (n = 3); error bars indicate standard deviation of the mean. Please click here to view a larger version of this figure.
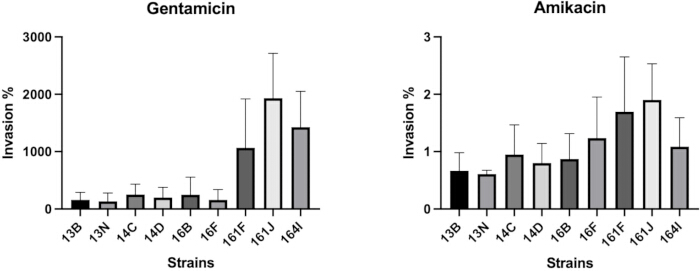
Figure 2: Amikacin effectively targets gentamicin-resistant E. coli strains. Caco-2 cell monolayers were infected with E. coli strains isolated from IBD patients at an MOI of 10. After 3 h of infection, cells were treated for 1 h with gentamicin (100 µg/mL) or amikacin (240 µg/mL) to eliminate extracellular bacteria. Cells were then lysed with 1% Triton-X-100, and homogenates were serially diluted and plated on LB agar for CFU enumeration. Invasion was expressed as the percentage of recovered bacteria relative to the initial inoculum. Data represent three independent experiments (n = 3); error bars indicate standard deviation of the mean. Please click here to view a larger version of this figure.
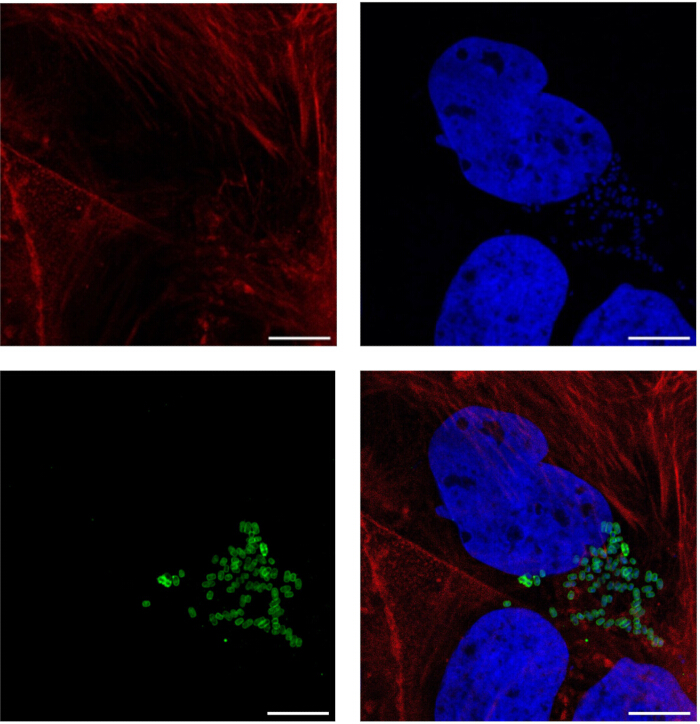
Figure 3: Visualization of epithelial cell invasion by E. coli. Representative confocal micrographs of Caco-2 cells infected E. coli NRG857c. Caco-2 cells were infected for 3 h followed by 1 h incubation with amikacin (240 µg/mL). Host actin was stained with rhodamine-Phallodin (red), and host and bacterial DNA were stained with Hoechst (blue). E. coli (green) was detected using an anti-rabbit E. coli primary antibody and a goat anti-rabbit Alexa Fluor 488 secondary antibody. Images were acquired on a 63× objective with a 3× zoom using a Leica confocal microscope. Scale bars = 10 µm. Please click here to view a larger version of this figure.
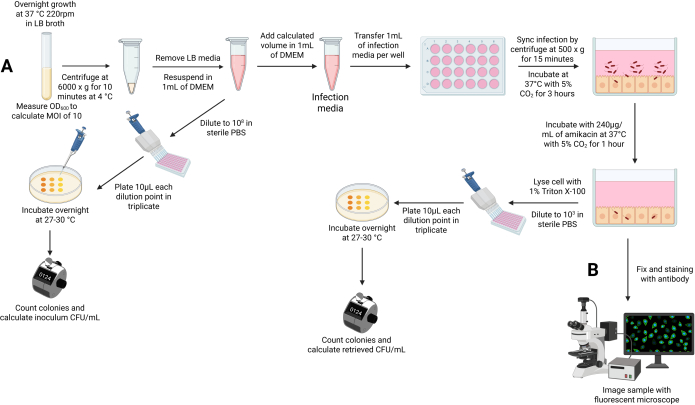
Figure 4: Flow chart of the study. (A) AIEC strains were grown overnight, washed, and added to Caco-2 monolayers at an MOI of 10. After 3 h of infection and 1 h of amikacin treatment, intracellular bacteria were recovered and quantified by plating serial dilutions in triplicate. (B) Infected monolayers were fixed, stained with antibodies, and imaged using fluorescence microscopy. Please click here to view a larger version of this figure.
Supplementary Figure 1: Amikacin treatment results in minimal cytotoxicity in epithelial cells. Caco-2 cells were treated with gentamicin (100 µg/mL) or amikacin (240 µg/mL) for 1 h. Cytotoxicity was determined by measuring the lactate dehydrogenase released into the culture medium. Error bars indicate standard deviation of the mean (n = 3).Please click here to download this file.
Discussion
The amikacin protection assay is a modified approach for assessing E. coli invasion into epithelial cells. Several steps are critical for the success of this assay, including collagen coating of the plates, maintaining monolayer integrity, and efficient cell lysis. Caco-2 cells are an adherent cell line that can attach to tissue-culture-treated plastic and form monolayers20. However, during infection, the use of serum-free media and repeated washing can influence cell detachment, leading to an under-representation of bacterial invasion21. To troubleshoot this, coating plates with extracellular matrix components, such as type IV collagen, can promote cell attachment and the formation of a stable, confluent monolayer during infection21. This is important as the AIEC strain LF82 has been shown to disrupt tight junctions during invasion, and incomplete monolayer formation can bypass this step, leading to skewed results22. Lastly, efficient cell lysis is another key step that affects bacterial recovery, as incomplete lysis could mask invasiveness, confounding assay outcomes23. To circumvent this, it is important to thoroughly resuspend the cell lysate after the incubation with Triton-X-100.
In addition to the technical challenges that could contribute to invasion assay variability, the percent of inoculum recovered post-infection for AIEC strain LF82 has been shown to range between 0.61 and 17.25%8. This variability could be influenced by the absence of certain environmental cues, such as bile salts, mucin, and other intestinal metabolites in this in vitro assay that are known to contribute to AIEC virulence24,25,26. Specifically, bile salts have been shown to induce the expression of long polar fimbriae, which increase AIEC attachment and translocation across M cells27. Other gastrointestinal pathogens, such as Vibrio and Shigella, are known to regulate their type III secretion systems in response to bile to mediate epithelial cell invasion28,29. Subculturing with bile salts to induce virulence factor expression is standard in gentamicin protection protocols for other pathogens, and growing AIEC with these environmental cues may stabilize invasion and yield more consistent profiles30,31.
Another limitation of this assay is that bacterial invasion is assessed at a single time-point, which, although standard in the field, likely oversimplifies the invasion process12. Bacterial invasion is a dynamic process involving adherence, internalization, intracellular replication, and escape from the host cell32. Because novel genes contributing to AIEC invasion have been challenging to identify, the use of a single time-point assay could underrepresent the number of genes contributing to this process12. Time-course invasion assays, therefore, have been used to assess how specific genes contribute to invasion and to study AIEC replication in I-407 and Hep-2 cells8,33. While the use of a time course invasion assay is valuable for characterizing the contribution of individual genes to invasion, it is labor-intensive, particularly when screening many clinical isolates. For this reason, a single time point is used to assess invasion.
In addition, the intracellular lifestyle of AIEC has not been very well characterized. Most studies use percent invasion as the primary readout to detect changes in CFU of various virulence factor deletion mutants14,34. Visualization of infected host cells can provide unique insights into AIEC biology that are missed when using only CFU enumeration35. Therefore, to comprehensively evaluate the role of different genes in cell invasion, performing immunofluorescence microscopy of infected cells should be done in tandem with CFU enumeration. This is important as it can lead to identifying genes that function in endosomal survival and escape, target the host's cytoskeleton, or exhibit differences in bacterial burden per cell, which could be overlooked using CFU recovery alone. It is important to note that using the immunofluorescence staining protocol described here to detect intracellular bacteria does not distinguish between truly internalized bacteria and those adhered to the cell surface. A differential staining approach, in which extracellular bacteria are labeled with a distinct secondary antibody prior to permeabilization and intracellular bacteria are stained following permeabilization, would address this limitation and could be implemented in future studies to more definitively distinguish these populations36.
The significance of this method largely lies in the ability to screen multidrug-resistant E. coli isolates from IBD patients that undergo diverse antibiotic treatment11. Gentamicin is used to treat patients with early-onset IBD and can be administered to treat other bacterial infections37. The emergence of gentamicin-resistant isolates would preclude the use of the standard assay, making amikacin a more reliable alternative11. Using the protocols outlined in this paper will allow for a more thorough characterization of AIEC infection biology and will help identify new genes that can contribute to invasion. These methods are important in the context of bacterial pathogenesis and host-pathogen interaction research, as they enable the discovery of novel virulence factors, the characterization of the bacterial intracellular life cycle, and the interrogation of host pathways targeted during infection. Additionally, they are broadly applicable to study other invasive pathogens using in vitro epithelial cell models.
Disclosures
The authors declare no conflicts of interest.
Acknowledgements
This work was supported by the Howard Hughes Medical Institute Emerging Pathogens Initiative (K.O., J.N.), Welch Foundation grant I-1561 (K.O.), Once Upon a Time Foundation (K.O.), NIH grant R35 GM134945 (K.O.), NIH grant NIDDK K08-DK-123316 (J.N.), Burroughs Wellcome Fund Career Awards for Medical Scientists - 1020904 (J.N.) and NIH T32 AI007520 (S.F.).
Materials
| Name | Company | Catalog Number | Comments |
|---|---|---|---|
| 75 cm2 Tissue culture flask | Fisher Scientific | FB012937 | |
| Amikacin disulfate | Research Products International | A20540-25.0 | |
| Antibiotic-Antimycotic (100x) | Gibco | 15240062 | |
| Anti-E.coli antibody | Abcam | ab137967 | |
| BioLite microwell plates - 6 well | Fisher Scientific | 12-556-004 | |
| Bovine serum albumin | Sigma-Aldrich | A7906 | |
| Collagen I, Rat tail, 100 mg | Corning | 354236 | |
| Countess cell counting chamber slide | Invitrogen | C10312 | |
| DMEM, high glucose | Gibco | 11965118 | |
| Fetal bovine serum | Corning | 35-011-CV | |
| Galcial acetic acid | Sigma-Aldrich | A6283 | |
| Glycine ultrapure | USBiological | G8165 | |
| Goat anti-Rabbit IgG (H + L) cross-adsorbed secondary antibody, Alexa Fluor 488 | Invitrogen | A-11008 | |
| Hoechst 33342, trihydrochloride trihydrate | Invitrogen | H3570 | |
| Liofilchem MTS amikacin [AK] 0.016-256 μg/mL | Fisher Scientific | 22-777-704 | Amikacin MIC Test Strips |
| Paraformaldehyde solution, 4% in PBS | Fisher Scientific | J19943.K2 | |
| PBS, 1x | Corning | 21-040-CV | |
| Poly-L-lysine coated sterile German glass coverslips for cell culture | Neuvitro | NC1327375 | |
| ProLong gold antifade mountant | Invitrogen | P36934 | |
| Rhodamine-Phalloidin | Invitrogen | R415 | Red-orange 540/565 nm |
| Surface treated sterile tissue culture plates | Fisher Scientific | FB012929 | 24-well plates |
| Triton X-100 (Electrophoresis) | Fisher Scientific | BP151-100 | |
| Trypan blue | Invitrogen | T10282 | |
| Trypsin-EDTA (0.25%), phenol red | Gibco | 25200056 | |
| Tween-20 | Fisher Scientific | BP337-100 |
References
- Bruner, L. P., White, A. M., Proksell, S. Inflammatory bowel disease. Prim Care. 50 (3), 411-427 (2023).
- Richard, N., Savoye, G., Leboutte, M., Amamou, A., Ghosh, S., et al. Crohn's disease: Why the ileum?. World J Gastroenterol. 29 (21), 3222-3240 (2023).
- Hracs, L., et al. Global evolution of inflammatory bowel disease across epidemiologic stages. Nature. 642 (8067), 458-466 (2025).
- Lewis, J. D., Abreu, M. T. Diet as a trigger or therapy for inflammatory bowel diseases. Gastroenterology. 152 (2), 398-414.e6 (2017).
- Khan, S., et al. Dietary simple sugars alter microbial ecology in the gut and promote colitis in mice. Sci Transl Med. 12 (567), (2020).
- Ma, X., et al. Gut microbiota in the early stage of Crohn's disease has unique characteristics. Gut Pathog. 14 (1), 46 (2022).
- Vester-Andersen, M. K., et al. Increased abundance of proteobacteria in aggressive Crohn's disease seven years after diagnosis. Sci Rep. 9 (1), 13473 (2019).
- Boudeau, J., Glasser, A. L., Masseret, E., Joly, B., Darfeuille-Michaud, A. Invasive ability of an Escherichia coli strain isolated from the ileal mucosa of a patient with Crohn's disease. Infect Immun. 67 (9), 4499-4509 (1999).
- Darfeuille-Michaud, A., et al. High prevalence of adherent-invasive Escherichia coli associated with ileal mucosa in Crohn's disease. Gastroenterology. 127 (2), 412-421 (2004).
- Barnich, N., et al. Adherent-invasive Escherichia coli in Crohn's disease: the 25th anniversary. Gut. , (2025).
- Kim, J., et al. Genetic and microbial analysis of invasiveness for Escherichia coli strains associated with inflammatory bowel disease. Cell Mol Gastroenterol Hepatol. 19 (4), 101451 (2025).
- Camprubi-Font, C., Martinez-Medina, M. Why the discovery of adherent-invasive Escherichia coli molecular markers is so challenging?. World J Biol Chem. 11 (1), 1-13 (2020).
- Barnich, N., et al. CEACAM6 acts as a receptor for adherent-invasive E. coli, supporting ileal mucosa colonization in Crohn disease. J Clin Invest. 117 (6), 1566-1574 (2007).
- Boudeau, J., Barnich, N., Darfeuille-Michaud, A. Type 1 pili-mediated adherence of Escherichia coli strain LF82 isolated from Crohn's disease is involved in bacterial invasion of intestinal epithelial cells. Mol Microbiol. 39 (5), 1272-1284 (2001).
- Hase, K., et al. Uptake through glycoprotein 2 of FimH(+) bacteria by M cells initiates mucosal immune response. Nature. 462 (7270), 226-230 (2009).
- Chassaing, B., et al. Crohn disease--associated adherent-invasive E. coli bacteria target mouse and human Peyer's patches via long polar fimbriae. J Clin Invest. 121 (3), 966-975 (2011).
- Glasser, A. L., Boudeau, J., Barnich, N., Perruchot, M. H., Colombel, J. F., et al. Adherent invasive Escherichia coli strains from patients with Crohn's disease survive and replicate within macrophages without inducing host cell death. Infect Immun. 69 (9), 5529-5537 (2001).
- Bringer, M. A., Billard, E., Glasser, A. L., Colombel, J. F., Darfeuille-Michaud, A. Replication of Crohn's disease-associated AIEC within macrophages is dependent on TNF-alpha secretion. Lab Invest. 92 (3), 411-419 (2012).
- Ristuccia, A. M., Cunha, B. A. An overview of amikacin. Ther Drug Monit. 7 (1), 12-25 (1985).
- Sambuy, Y., De Angelis, I., Ranaldi, G., Scarino, M. L., Stammati, A., et al. The Caco-2 cell line as a model of the intestinal barrier: influence of cell and culture-related factors on Caco-2 cell functional characteristics. Cell Biol Toxicol. 21 (1), 1-26 (2005).
- Vllasaliu, D., Falcone, F. H., Stolnik, S., Garnett, M. Basement membrane influences intestinal epithelial cell growth and presents a barrier to the movement of macromolecules. Exp Cell Res. 323 (1), 218-231 (2014).
- Wine, E., Ossa, J. C., Gray-Owen, S. D., Sherman, P. M. Adherent-invasive Escherichia coli, strain LF82 disrupts apical junctional complexes in polarized epithelia. BMC Microbiol. 9, 180 (2009).
- Jamur, M. C., Oliver, C. Permeabilization of cell membranes. Methods Mol Biol. 588, 63-66 (2010).
- Delmas, J., et al. Metabolic adaptation of adherent-invasive Escherichia coli to exposure to bile salts. Sci Rep. 9 (1), 2175 (2019).
- Zhang, S., et al. Mucosal metabolites fuel the growth and virulence of E. coli linked to Crohn's disease. JCI Insight. 7 (10), (2022).
- Viennois, E., et al. Dietary emulsifiers directly impact adherent-invasive E. coli gene expression to drive chronic intestinal inflammation. Cell Rep. 33 (1), 108229 (2020).
- Chassaing, B., Etienne-Mesmin, L., Bonnet, R., Darfeuille-Michaud, A. Bile salts induce long polar fimbriae expression favouring Crohn's disease-associated adherent-invasive Escherichia coli interaction with Peyer's patches. Environ Microbiol. 15 (2), 355-371 (2013).
- Gotoh, K., et al. Bile acid-induced virulence gene expression of Vibrio parahaemolyticus reveals a novel therapeutic potential for bile acid sequestrants. PLoS One. 5 (10), e13365 (2010).
- Bajunaid, W., et al. The T3SS of Shigella: Expression, structure, function, and role in vacuole escape. Microorganisms. 8 (12), (2020).
- Poore, K., Lenneman, B. R., Faherty, C. S. Epithelial cell infection analyses with Shigella. J Vis Exp. (204), e66426 (2024).
- Chimalapati, S., Lafrance, A. E., Chen, L., Orth, K. Vibrio parahaemolyticus: Basic techniques for growth, genetic manipulation, and analysis of virulence factors. Curr Protoc Microbiol. 59 (1), e131 (2020).
- Rodrigues, E., Marzook, N. B., Pallett, M. A., Sateriale, A. Convergent mechanisms of epithelial cell structure manipulation by intestinal pathogens. PLoS Pathog. 21 (7), e1013367 (2025).
- Jaishankar, J., et al. A critical role for Vibrio parahaemolyticus LPS to mediate evasion of host immune response during infection. Proc Natl Acad Sci U S A. 122 (33), e2426547122 (2025).
- Cieza, R. J., Hu, J., Ross, B. N., Sbrana, E., Torres, A. G. The IbeA invasin of adherent-invasive Escherichia coli mediates interaction with intestinal epithelia and macrophages. Infect Immun. 83 (5), 1904-1918 (2015).
- Liu, H., Semino-Mora, C., Dubois, A. Mechanism of H. pylori intracellular entry: an in vitro study. Front Cell Infect Microbiol. 2, 13 (2012).
- Heesemann, J., Laufs, R. Double immunofluorescence microscopic technique for accurate differentiation of extracellularly and intracellularly located bacteria in cell culture. J Clin Microbiol. 22 (2), 168-175 (1985).
- Lev-Tzion, R., Ledder, O., Shteyer, E., Tan, M. L. N., Uhlig, H. H., et al. Oral vancomycin and gentamicin for treatment of very early onset inflammatory bowel disease. Digestion. 95 (4), 310-313 (2017).
Reprints and Permissions
