Here, we present a protocol for generating chemoresistant cells using a dose-escalation approach, followed by a CRISPR/Cas9-based screen using a focused sgRNA library targeting epigenetic modifiers to identify regulators of acquired chemoresistance. The protocol also provides multiple optimization points tailored to chemoresistant cell models, offering a robust framework for researchers investigating resistance mechanisms.
Method Article
Epigenome-Wide CRISPR-Cas9-Based Knockout Screens on Chemoresistant Cells
* These authors contributed equally
In This Article
Summary
Abstract
Chemotherapy resistance remains a major challenge in cancer treatment, driven by cancer cells' ability to acquire adaptive properties, rewire signaling pathways, and alter chromatin structure to evade drug-induced cytotoxicity. Because these processes rely heavily on epigenetic mechanisms that regulate chromatin organization and transcriptional plasticity, epigenetic regulators have emerged as key contributors to chemotherapy resistance. To investigate resistance to paclitaxel, one of the most widely used chemotherapeutic agents in triple-negative breast cancer (TNBC), we employed an epigenome-focused knockout library (EPIKOL), a CRISPR-Cas9–based library, designed to systematically disrupt genes involved in chromatin regulation. Chemoresistant cell lines were generated through a stepwise dose-escalation protocol that recapitulates clinically relevant drug adaptation. However, these resistant cells exhibit a multidrug-resistant (MDR) phenotype, posing significant challenges for efficient viral transduction and the selection of stable cell populations. In this study, we describe key methodological steps for achieving high-efficiency lentiviral transduction and selection, enabling the successful application of EPIKOL CRISPR screens in chemoresistant TNBC models. Following the described protocol, an epigenome-wide CRISPR screen was conducted on chemoresistant TNBC cells, and novel epigenetic regulators of chemoresistance were identified. This protocol provides a robust framework for identifying epigenetic regulators that contribute to acquired paclitaxel resistance using a CRISPR-based loss-of-function approach.
Introduction
Triple negative breast cancer (TNBC) is a subtype of breast cancer that accounts for 12–17% of all breast cancers1. It is characterized by the impaired expression of estrogen receptor (ER), progesterone receptor (PR), and human epidermal growth factor receptor-2 (HER2), which severely limits the availability of targeted therapy options and leaves conventional chemotherapy as the primary treatment modality2. Taxanes and anthracyclines are commonly used in TNBC treatment; however, patients usually develop resistance2,3. Acquisition of chemoresistance is a complex and multidimensional process that includes both genetic, metabolic, transcriptional, and epigenetic adaptations2,4. Epigenetic alterations have emerged as central regulators of cellular plasticity, facilitating dynamic transcriptional reprogramming that enables cancer cells to tolerate chemotherapy-induced toxicity5.
Taxol (paclitaxel) is a member of the taxane class, which causes cell death by impairing the microtubule dynamics and functions as an antimitotic agent6. Even though TNBC patients initially respond to the chemotherapy regimens including Taxol, resistance usually develops over time2. Acquired Taxol resistance is commonly associated with overexpression of ATP-binding cassette (ABC) transporters, specifically ABCB1 (MDR1, P-glycoprotein), which mediate the drug efflux of Taxol, resulting in decreased intracellular drug toxicity7. Since a wide range of chemotherapeutic agents are substrates of these ABC transporters, their upregulation limits the use of other chemotherapeutic drugs, causing a multidrug resistance phenotype (MDR)8. Inhibition of ABC transporters has proven largely unsuccessful as a strategy to overcome multidrug resistance in clinical settings, primarily due to their ubiquitous expression and essential roles in transporting a wide range of endogenous and exogenous substrates9. Although verapamil, a first-generation ABCB1 inhibitor, demonstrated limited or no clinical benefit and was associated with significant toxicity in clinical trials10, it remains a valuable experimental tool for enhancing selection efficiency in in vitro models of MDR.
MDR phenotype is a dynamic and adaptive process that mostly emerges during stress conditions2. ABC transporter expression is predominantly controlled by transcriptional and epigenetic regulatory mechanisms, rather than by mutational events5,11. The limitation of directly targeting ABC transporters highlights the need to identify the upstream regulators of these proteins as a vulnerability specific to the resistant cells. Therefore, systematic interrogation of epigenetic factors has become an important strategy to identify novel regulators of chemotherapy resistance and to develop combination therapies targeting these vulnerabilities.
CRISPR-Cas9-based functional knockout screens enable unbiased, systematic genome-wide perturbations to study effects of gene loss in cancer at the genome scale12. However, genome-wide CRISPR libraries offer limited single guide RNA (sgRNA) representation per gene, which reduces sensitivity when compared to focused libraries13. Importantly, a robust screen not only depends on the quality of the perturbations but also on an appropriate model and an optimized experimental protocol. In this context, studying a dynamic and complex process such as drug resistance might benefit from a focused library with a customized protocol13. In a previous work, we generated an epigenome-focused CRISPR-Cas9 knockout library to target chromatin regulators14. Compared to other publicly available epigenome-focused CRISPR libraries, epigenetic knockout library (EPIKOL) contains 779 genes, consisting of chromatin readers, writers, erasers, and associated proteins, each targeted with 10 sgRNAs, thereby enabling increasing depth per gene and improving robustness and reproducibility of chromatin-focused functional screens14. EPIKOL is available in both the LentiGuide system, in which Cas9 is expressed from a different vector, and the LentiCRISPR system, which includes Cas9, providing flexibility depending on the cell line. Reaching sufficient library coverage, defined as the average number of cells per sgRNA (e.g., 500×–1000×) is easier for EPIKOL when compared to genome-wide libraries, providing an advantage while studying the slow-growing chemoresistant cell lines.
While CRISPR screening offers a powerful approach to examine chemoresistance mechanisms, standard pooled screening workflows are not optimized for chemoresistant cells with active drug efflux. Puromycin, a commonly used selection antibiotic in lentiviral CRISPR systems, can be pumped out of the resistant cells by ABC transporters, mainly ABCB1, preventing successful selection of transduced cells15,16. This limitation can lead to heterogeneous cell populations, increasing background noise, and ultimately compromising the data quality. To address this challenge, we optimized the puromycin selection step by transiently inhibiting ABC-mediated drug efflux with verapamil, thereby enabling efficient enrichment of sgRNA-infected cells. Using this strategy, we identified Bromodomain and PHD Finger Containing 1 (BRPF1) as a regulator of ABCB1 expression and Taxol resistance in TNBC17. BRPF1 inhibition, either genetically or pharmacologically, restored the Taxol sensitivity in resistant cells, demonstrating the utility of this optimized protocol in identifying actionable targets in chemoresistance17.
Here, we outline the key steps in negative selection CRISPR screening on chemoresistant models, specifically focusing on the technical challenges that are often overlooked in most chemoresistance or CRISPR screening protocols. The protocol first demonstrates a stepwise dose escalation method for the generation of chemoresistant cells and then optimizes viral delivery and selection conditions to overcome ABC transporter-mediated drug efflux. Together, these optimizations ensure efficient enrichment of sgRNA-positive cells during the CRISPR screens, while effectively eliminating the non-transduced cells, thereby providing a robust and efficient strategy for transduction and selection in chemoresistant TNBC cells. Finally, the protocol highlights the fundamentals of identifying CRISPR screening hits through next-generation sequencing and bioinformatic analysis. Together, this protocol enables effective implementation of the EPIKOL screening platform to identify potential therapeutic targets to overcome resistance17,18,19.
Protocol
All reagents and equipment used in this study are provided in the Table of Materials.
1. Generation of Taxol-resistant triple-negative breast cancer cell lines
- To determine drug sensitivity of the cells, adjust cell density of SUM159PT adherent cells to 2 × 10³ cells per well in 96-well black clear bottom plates with Ham's F12 nutrient mix supplemented with 5% fetal bovine serum (FBS), 1% Penicillin-Streptomycin, 5 µg/mL insulin, 10 mM HEPES, and 1 µL/mL hydrocortisone and incubate the cells for 16 h in a cell culture incubator at 37 °C with 5% CO2.
- Prepare Taxol stock dissolved in dimethyl sulfoxide (DMSO). To treat cells, prepare serial dilutions of Taxol in culture media, ranging from 0.3 nM to 10 µM (e.g., 0.3 nM, 1 nM, 3 nM, 10 nM, 30 nM, 100 nM, 300 nM, 1µM, 10 µM), and use DMSO alone as a vehicle control.
- Treat cells with 200 µL of increasing doses of Taxol, (prepared in step 1.2) as triplicates and leave the plate in a cell culture incubator for 72 h at 37 °C with 5% CO2.
- After 72 h of drug treatment, measure cell viability with a luminescence-based adenosine triphosphate (ATP) quantification cell viability assay. Use a microplate reader to measure luminescence and normalize values to DMSO controls. Calculate the 10% inhibitory concentration (IC10) and IC50 values by nonlinear regression using a four-parameter logistic dose-response model in an appropriate statistical software.
- To start generating chemoresistant cells, seed 2 × 10⁵ SUM159PT cells per well in 6-well plates. Incubate overnight at 37 °C with 5% CO2.
- The next day, treat cells with either IC10 or IC50 values of Taxol in 2 mL of culture media for 72 h as starting concentrations.
- If cells tolerate the current drug concentration, split them into two wells. Maintain one well as a backup control in fresh medium and replace the medium in the second well with medium containing twice the previous Taxol concentration.
NOTE: If cells need recovery due to stress-induced morphological changes such as abnormal cellular projections, extensive rounding and detachment, or marked reduction in proliferation, keep them in drug-free medium and wait until cells become healthy and confluent. Then repeat the steps starting from step 1.7. - While generating resistant cells, passage parental cells with DMSO-containing medium as a control. Adjust DMSO volume to match the amount of DMSO present in the corresponding Taxol treatment.
- Measure cell viability as in steps 1.2–1.4 every 3–4 weeks and continue this procedure until a significant difference (p < 0.05 or 10–50 fold depending on the applied drug) between IC50 values of parental and resistant cell lines is obtained. Dose incrementation procedure typically takes 6–9 months, depending on the drug used.
- After stable resistant cells are obtained, maintain them in the maintenance dose (last applied dose) of the drug while culturing to preserve the resistant phenotype.
NOTE: Chemoresistant cell generation with the dose-escalation method is a time-intensive process, and the duration depends on several factors, including the cell line, intrinsic growth rate, and the specific chemotherapeutic agent used. It generally takes 6–9 months, depending on the clinically relevant resistance level. An alternative approach to determine significant differences in resistant levels is to assess the minimum drug concentration at which resistant cells survive, but parental cells do not. - Characterization of resistant cells: Perform RNA sequencing, western blotting, quantitative polymerase chain reaction (qPCR), and cell viability assays with drug treatment (e.g., colony formation assay) to characterize resistant cell phenotype. Make sure to re-evaluate the resistant phenotype after several passages to demonstrate that the elevated IC50 phenotype is stable over time.
2. Lentivirus production
- Day 0: Seed HEK293T cells as 4 × 10⁶ per 100 mm tissue culture dish with Dulbecco's Modified Eagle Medium (DMEM) supplemented with 10% FBS, 1% Penicillin-Streptomycin, to achieve 90% confluency the following day.
- Day 1: Prepare polyethylenimine (PEI) and DNA mixtures in serum-free DMEM (-/-) separately for each virus. Use Table 1 and Table 2 to adjust volume and concentrations of PEI and DNA according to the desired viral yield.
NOTE: PEI is used four times of the total µg of DNA (e.g., in a 100 mm plate, use 30 µL of PEI for a total of 7.5 µg DNA). Virus production in 100 mm dishes is followed in this protocol and virus obtained from 5–10 100 mm dishes will allow for multiple screens to be performed. For validation experiments or small-scale infections, a single well of a 6-well plate or a 60 mm dish is sufficient. Since linear polyethylenimine hydrochloride is a toxic transfection agent, make sure that cell confluency is 90% at the time of transfection.- After mixing thoroughly, add the DNA mixture to the PEI tube. Mix well and let PEI-DNA complexes stand for 30 min at room temperature.
- Then add the 600 µL of PEI-DNA complex to the HEK293Ts, dropwise. Place plates in the virus incubator for 16 h at 37 °C with 5% CO2.
- Day 2: Replace the medium of infected cells by aspirating the PEI and virus-containing media and adding 8 mL of complete DMEM for each 100 mm tissue culture dish. Incubate the cells to allow viral production.
- Day 3: Perform the first collection of viruses by gently removing the 8 mL of supernatant into an appropriate-sized centrifuge tube and store at 4 °C. If there are multiple plates for the viral production, combine the supernatants. Then add 8 mL of fresh complete DMEM to each dish and return the plates to the virus incubator.
- Day 4: Repeat collection steps and combine with supernatants from Day 3.
- Prepare a 50% (w/v) Polyethylene glycol (PEG)-8000 solution in phosphate-buffered saline (PBS) to obtain 5× PEG stock solution. Autoclave to dissolve and sterilize.
- Centrifuge the collected viral supernatants at 300 x g for 5 min to pellet residual cells, then proceed to filtration.
- Filter 16 mL of viral supernatant using a 0.45 µm filter (either syringe or 50 mL vacuum filter) into the tube containing 4 mL of PEG solution to achieve a final 1× PEG concentration and remove remaining debris and cells.
- Cap the tube and mix by inversion. Repeat this step for all viral preparations. Store overnight at 4 °C in the dark, with optional gentle agitation.
- The next day, visible precipitates should be present. Centrifuge the tubes at 1400 x g for 20 min at 4 °C.
NOTE: PEG precipitated viral pellets may be stored at 4 °C up to 5 days prior to centrifugation; however, viral titer may decrease with extended incubation. - After centrifugation, carefully discard the supernatant, leaving a small volume (approximately 100 µL) in the tube to avoid disturbing the pellet.
- Centrifuge the tubes 5 min at 300 x g to collect as much liquid from the sides of the tube as possible. Then carefully discard the remaining supernatant.
- To concentrate the virus 100-fold, add PBS to 1/100 of the initial volume of the viral supernatant to the pellet and resuspend the pellet by pipetting (e.g., if starting with 16 mL of viral supernatant, add 120–140 µL of PBS to the pellet to reach 160 µL final volume, accounting for the pellet volume). Avoid vigorous pipetting; aliquot the virus.
NOTE: Expected titer following PEG concentration is >1 × 10⁸ infectious particles/mL (ip/mL) for the LentiGuide system and >1 × 10⁷ for the LentiCRISPR system. Titers lower by one order of magnitude may still be acceptable, but should be verified against the infectivity of the target cell line and required viral volume. - If virus concentration is not required, aliquot the virus to minimize freeze-thaw cycles. Store concentrated or unconcentrated virus at -80 °C. Bleach and trash plates.
NOTE: For a more detailed description of lentiviral production and handling, readers are referred to established protocols20. For common issues encountered during lentivirus production, refer to Supplementary Table 1.
| 1 well of 6 well plate | 60 mm plate | 100 mm plate | 150 mm plate | |
| PEI (stock 1 mg/mL) volume | 6 µL | 9 µL | 30 µL | 60 µL |
| DMEM (-/-) volume | 54 µL | 100 µL | 270 µL | 540 µL |
Table 1: Required PEI and DMEM volumes for different plates for the PEI mixture.
| 1 well of 6 well plate | 60 mm plate | 100 mm plate | 150 mm plate | |
| VSV-G | 75 ng | 150 ng | 375 ng | 750 ng |
| Gag-Pol | 675 ng | 1350 ng | 3375 ng | 6750 ng |
| Target vector | 750 ng | 1500 ng | 3750 ng | 7500 ng |
| DMEM (-/-) adjust final volume to | 60 µL | 100 µL | 300 µL | 600 µL |
Table 2: Required plasmid and DMEM volumes for different plates for the DNA mixture.
3. Establishment of optimized puromycin selection for MDR cells
NOTE: In chemoresistant cells exhibiting ABCB1 overexpression, puromycin selection fails due to active ABCB1-mediated efflux of puromycin, preventing effective selection of sgRNA-infected cells. To overcome this limitation, verapamil is co-administered with puromycin to transiently inhibit ABCB1-mediated efflux, allowing intracellular accumulation of puromycin and efficiently eliminating non-infected cells.
- Determine the verapamil concentration that blocks ABCB1-mediated drug efflux without affecting cell viability. For this, use the chemotherapeutic agent to which resistance was acquired (in this case, Taxol) in combination with increasing doses of verapamil.
- Seed SUM159PT Taxol-resistant and parental cells to 96-well black clear bottom plates at 2 × 10³ cells per well in triplicate. Incubate cells overnight at 37 °C with 5% CO2.
- Treat cells with serial dilutions of verapamil (0, 1.25, 2.5, 5, 10, 20, 40, and 80 µM) while maintaining a constant concentration of the Taxol (e.g., maintenance dose) across all conditions.
- After 72 h of treatment, assess cell viability with a luminescence-based ATP quantification cell viability assay. Determine the verapamil concentration that does not reduce viability on its own (≥90%–95% viability compared to untreated controls) but restores sensitivity in resistant cells.
- To find the puromycin concentration to be used in combination with verapamil, seed SUM159PT Taxol-resistant cells into a 96-well plate at 2 × 10³cells per well. Incubate the plate for 16 h at 37 °C with 5% CO2.
- Prepare serial dilutions of puromycin (0, 0.625, 1.25, 2.5, 5, 10, 20, and 40 µg/mL) in the medium containing the previously determined verapamil concentration and treat cells accordingly.
- After 72 h, measure cell viability with a luminescence-based ATP quantification cell viability assay, and determine the minimum concentration of puromycin that eliminates all the cells (≤5% viability) in the presence of verapamil. This concentration will be used for selection during CRISPR screening.
NOTE: These drug concentration optimization steps are cell-line and context-dependent. Factors such as intrinsic drug sensitivity, ABC transporter expression levels, and growth rate can influence the effective concentrations. Therefore, perform this optimization for each new cell line and resistance model. (For reference, 5 µg/mL puromycin in combination with 20 µM verapamil is used for Taxol-resistant cells used in this study17). For troubleshooting puromycin + verapamil selection, refer to Supplementary Table 1.
4. Viral titration and multiplicity of infection (MOI) calculation
- Day -1: Seed SUM159PT Taxol-resistant cells as 2 × 10⁵ in each well of a 6-well plate with complete Ham's F12 nutrient mix.
- Day 0: Perform four serial dilutions of the virus in Ham's F12 nutrient mix containing Protamine sulfate (PS) at 8 µg/mL. (For concentrated viruses, start with 1 µL and dilute tenfold in each dilution as 1 > 10-1 > 10-2 > 10-3. For unconcentrated viruses, adjust volumes accordingly (e.g., 100 µL > 10 µL > 1 µL > 0.1 µL).
- Give 1 mL of virus-containing media to each of the four wells. Leave one well as puromycin selection control and one well as untreated control.
- Day 1: Replace the viral media with 2 mL of fresh media 16 h post-infection.
- Day 2: Transfer cell contents of each well to a 100 mm cell culture dish with Ham's F12 nutrient mix containing puromycin + verapamil at concentrations determined in step 3.2. If unselected cells are overconfluent, seed a defined fraction (e.g., ½), and this will be taken into consideration when doing the final calculations.
NOTE: Replenish media with fresh puromycin + verapamil, if needed, in the following 3-4 days until all the cells in the control plate are dead. - Day 4–5: When the cells in the control plate are dead, determine the plates that have enough cells for counting. Trypsinize the cells, count, and determine the total number of cells.
- After counting viable cells, calculate the transduction efficiency and Multiplicity of Infection (MOI) as follows (use Supplementary Table 2 as a template):
- Calculate transduction rate (fraction of infected cells) using the formula below
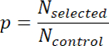

NSelected: Total number of cells after puromycin selection in the infected wells
NControl: Total number of cells in the untransduced, unselected control well
p: Transduction rate (fraction of infected cells).
NOTE: If only a fraction of the untreated control cells was seeded, take this into account while calculating NControl - Calculate MOI. During lentiviral transduction, infection events follow a Poisson distribution. Therefore, the fraction of cells infected with at least one virus is defined as:
p =1- e -MOI
Thus, calculate MOI as:
MOI = - ln(1-p) - Calculate lentiviral titer (infectious particle/milliliter, IP/mL) based on the number of infected cells:
Titer (IP/mL) = (MOI x Nstarting)/ Volume of virus
Nstarting: number of cells seeded for infection
Volume of virus: volume of virus added per well (in mL)
NOTE: Calculate the lentiviral titer for each infection separately and determine the final titer by taking the average of the wells showing proportional virus amount and titer values. Wells showing saturation or deviation from proportional scaling should be excluded from titer calculations.
- Calculate transduction rate (fraction of infected cells) using the formula below
5. Generation and/or validation of a Cas9-expressing stable cell line
NOTE: This step is required when using LentiGuide_EPIKOL. If a validated Cas9-stable line is already available, or if LentiCRISPR_v2_EPIKOL is used, proceed directly to Section 6.
- Produce Cas9 lentivirus using the LentiCas9_blast vector as described in section 2.
- Infect cells the following day, targeting an MOI of 10. Calculate the virus amount according to the intended MOI in section 4, use the calculated amount of virus volume, and give it directly to the cells in the plate that contains culture medium containing 8 µg/mL Protamine sulfate (PS).
- Replace viral medium with fresh medium 16 h post-infection
- Next day, apply blasticidin selection by giving cells the culture medium containing the previously determined concentration of blasticidin (final concentration determined per cell line with a cell viability assay as described in section 3) until uninfected cells are eliminated (typically 6–7 days).
NOTE: If Cas9-expressing cells are cultured for extended periods prior to screening, repeat blasticidin selection to eliminate Cas9-negative cells. - Cas9 validation (recommended): Validate Cas9 activity using control sgRNAs targeting essential genes (sgRNA sequences are available within the EPIKOL library; see Supplementary Table 3) or reporter systems such as green fluorescent protein (GFP) to assess the knockout efficiency and kinetics. Detailed validation methods can be found in a previous study19.
6. Epigenome-wide CRISPR knockout lentiviral library infection and screening
NOTE: To ensure accurate genotype-to-phenotype mapping, pooled CRISPR screens require low-MOI infection and sufficient library coverage (typically 500×–1000), depending on experimental stringency and cell line behavior. For general principles of pooled genome-wide CRISPR screening workflows, including library design and experimental setup, see previously published protocols21,22. For EPIKOL, maintaining >500x coverage is strongly recommended throughout the screen, as dropping below this threshold increases the risk of stochastic sgRNA dropout, especially in the drug treatment arm of the screen. The following calculations are required to determine the starting cell number, transduction efficiency, and viral volume needed for EPIKOL transduction to perform low-MOI infection without compromising the library complexity.
- Day -1: Seed a total amount of cells calculated below in 100 mm or 150 mm cell culture dishes with an appropriate number of cells per plate.
- Calculate the number of successfully infected cells to reach the desired library coverage (use Supplementary Table 2 as a template):
Ninfected = (number of sgRNAs) × (target coverage) - Calculate the starting cell number per replicate to compensate for the fraction of uninfected cells upon low MOI (0.3–0.4) infection:
Nstarting = Ninfected/p
where p is the transduction rate (fraction of infected cells) determined based on Poisson distribution (see step 4.6).
NOTE: This adjustment ensures that a sufficient number of single sgRNA-infected cells will be present in the pool upon low-MOI infection to reach the desired library coverage.
- Calculate the number of successfully infected cells to reach the desired library coverage (use Supplementary Table 2 as a template):
- Day 0 - Transduction
- Calculate the required viral volume per replicate
Required viral volume = (Nstarting × MOI) / (Viral Titer (previously determined ip/mL))
NOTE: Transduction efficiency at the target MOI range of 0.3–0.4 corresponds to approximately
26%–33% puromycin-resistant cells prior to selection. - Infect cells with the calculated viral volume in the complete culture media containing 8 µg/mL Protamine sulfate (PS). Reduce media volume to increase virus-cell contact during infection (e.g., 8 mL instead of 10 mL for a 100 mm plate)
- Prepare independent infection mixtures for each biological replicate.
NOTE: At least two biological replicates are recommended; three are preferred. Biological replicates must be transduced, selected, and maintained separately (including media changes and passaging) and should not be pooled at any stage prior to sequencing.
- Calculate the required viral volume per replicate
- Day 1 - Replace viral media with fresh media after 16 h and incubate at 37 °C with 5% CO2
- Day 2 - Selection of transduced cells: Apply puromycin selection in the presence of verapamil (concentrations determined in step 3.2) to enrich sgRNA-infected cells in SUM159PT Taxol-resistant cells. Continue selection until all cells in the uninfected control plate are eliminated (typically ~3 days).
- Day 5 - T0 Reference sampling: After completion of puromycin + verapamil selection, trypsinize the cells and collect an initial timepoint time zero (T0) cell pellet from each biological replicate corresponding to the coverage level decided during transduction. Since it will serve as a reference for initial library distribution, collect cell pellets as soon as the selection is completed, before any cell loss occurs. Seed sufficient cell numbers to preserve coverage at all times.
NOTE: Following puromycin + verapamil selection, the number of surviving transduced cells will vary depending on the cell line's doubling time and the transduction efficiency achieved. Surviving population typically recovers to the initial seeding density upon completion of selection and may exceed it in faster-growing cell lines. If the surviving cell number allows, collect multiple T0 pellets and freeze backup samples at -80 °C. Additionally, EPIKOL-infected cells can be cryopreserved in liquid nitrogen while maintaining coverage. These backup stocks can be thawed in case of an unexpected screen failure or for future alternative experimental approaches (e.g., testing additional drug treatments). Check the transduction efficiency using an uninfected control plate to confirm that the intended transduction efficiency has been achieved (see section 4). If the observed transduction efficiency is higher than expected, restart the experiment to ensure that the transduction is performed at low MOI, preventing multiple sgRNA integration per cell. - Screen execution: After allowing completion of Cas9-mediated genome editing, for the duration determined at section 5, split the cells into treatment groups.
NOTE: This typically takes 7–9 days post-transduction, as maximal knockout efficiency is reached approximately on post-transduction day 723. For epigenetic targets, 9 day-long window also allows for changes at the chromatin level prior to the initiation of drug selection.- Split cells into experimental arms while preserving coverage: one is the control arm that is a baseline condition receiving DMSO, and the other is the treatment arm that is the condition receiving Taxol.
- Maintain cultures for 14–16 population doublings. Population doubling level (PDL) is calculated as:
PDL = PDLs + 3.322 (Log Cf – log Ci)
PDLs = starting population doubling level
Ci = initial cell number seeded
Cf = total number of cells at the end of a growth period - At each passage, monitor viability and growth kinetics and avoid bottlenecks by maintaining adequate cell numbers. Adjust treatment intensity if excessive cell death occurs.
NOTE: Aim to collect backup cell pellets at each passage, weekly or at certain PDLs during the screen. These backup samples may serve as alternative timepoints for sequencing or as optimization samples for the genomic DNA extraction process. Cryopreserve cells periodically to avoid unexpected cell loss.
- Tfinal sampling: Upon reaching the desired PDL, collect final timepoint pellets (Tfinal) for each replicate and condition by maintaining the library coverage per pellet. Store pellets at -80 °C until downstream gDNA extraction.
NOTE: Aim to terminate the screen at comparable PDLs between arms, even if the culture duration differs between conditions.
7. Genomic DNA extraction
- Extract genomic DNA (gDNA) using a validated method (e.g., MN NucleoSpin Tissue Kit), with minor protocol adjustments to improve lysis efficiency from large, pooled cell pellets.
- Follow the tissue protocol rather than the cell protocol due to the large pellet size. Consider increasing reagent volumes and using multiple spin columns per cell pellet (do not exceed 5 × 10⁶ cells per column) if necessary to ensure efficient lysis.
NOTE: Prior to lysis, resuspending the pellet with a minimal amount of PBS (~50 µL) can improve lysis efficiency. Incomplete lysis of the pellet may clog the spin column, resulting in reduced DNA yield. - Follow high-yield and high-concentration elution recommendations. Elute gDNA in a reduced volume of elution buffer (approximately ⅔ of the recommended volume) per column, particularly if cell pellets were divided into multiple columns.
- Follow the tissue protocol rather than the cell protocol due to the large pellet size. Consider increasing reagent volumes and using multiple spin columns per cell pellet (do not exceed 5 × 10⁶ cells per column) if necessary to ensure efficient lysis.
- Measure gDNA quality and quantity (e.g., Nanodrop).
8. EPIKOL sequencing library preparation from genomic DNA
- Use a dedicated PCR cabinet to perform all library PCR steps to prevent plasmid contamination during gDNA PCRs, as the plasmid templates amplify more efficiently than genomic DNA and can distort sgRNA distribution.
- Clean the workspace, micropipettes, and racks with 10% bleach and 70% ethanol, respectively.
- Aliquot all reagents (especially primers) in single-use volumes prior to use to reduce the risk of cross-contamination and freeze-thaw cycles.
- Store reagents at -20 °C and keep them on ice during PCR setup.
- Optimize the starting gDNA input volume by targeting 200×–500× coverage per sgRNA to maintain appropriate library complexity. Example: For the EPIKOL library, gDNAs are preferably extracted from cell pellets collected at 1000× coverage, and final coverage of 250× is used for gDNA amplification.
- Calculate the required gDNA input for the desired coverage as follows.
gDNA amount = (Number of sgRNAs) × coverage × (66pg DNA/nucleus)
Example: 8000 gRNA × (250× coverage) × (6.6 pg DNA/nucleus) = 13.2 µg gDNA/sample should be amplified. - Perform a test PCR using external and internal PCR reaction conditions in Table 3, Table 4, Table 5, and Table 6 with increasing amounts of gDNA per reaction (e.g., 1 µg, 3 µg, 6 µg) to determine the optimal gDNA amount per tube.
NOTE: Insufficient gDNA input or excessive PCR cycling can introduce amplification bias and distort sgRNA coverage. - Run a 2% agarose gel to analyze internal PCR products. Ensure a bright band at approximately 350 bp is observed.
- Based on optimal gDNA amount per tube, determine the total number of PCR reactions required per sample to achieve the desired library coverage while avoiding excessive amounts of gDNA per individual reaction.
NOTE: If 13.2 µg of total gDNA is required and 3.3 µg of gDNA per reaction yields optimal amplification, prepare four parallel PCR reactions with 3.3 µg of gDNA in 100 µL reaction volume. In this setting, the volume of gDNA should not exceed 10% of the reaction volume to avoid PCR inhibition due to excessive template input.
- Calculate the required gDNA input for the desired coverage as follows.
- Amplify sgRNA cassettes from gDNA template (First/External PCR)
- Amplify genomic regions containing the stably integrated lentiviral sgRNA cassette using the primers listed in Supplementary Table 2. Perform PCR reactions with the amount of gDNA determined in step 8.2 (see Table 3) by using the PCR reaction conditions in Table 4. Prepare a PCR control tube that has no template DNA to check for possible contamination, and keep the tubes on ice at all times.
- Add DNA Polymerase lastly, mix well by tapping or pipetting, and briefly spin down the PCR tubes before putting them into the thermal cycler. Perform hot-start to prevent non-specific amplification.
- Upon completion of the external PCR, pool all PCR reactions in one microcentrifuge tube. PCR clean up or gel visualization after external PCR is not required. Use the pooled PCR product directly as a template in the second (internal) PCR. Store PCR products at -20 °C.
| Reagent | Volume per reaction |
| dNTP (10 mM each) | 2 µL |
| Phusion Polymerase | 1 µL |
| 6´ GC Buffer | 20 µL |
| Forward primer (10 µM) | 5 µL |
| Reverse Primer (10 µM) | 5 µL |
| gDNA | X µL |
| Nuclease-free water | up to 100 µL (67–X µL) |
| Total | 100 µL |
Table 3: Required reagents for the first/external PCR.
| Cycle number | Denature | Annealing | Extension |
| 1 | 95 °C, 3 min | ||
| 2–19 | 95 °C, 25 s | 65 °C, 20 s | 72 °C 15 s |
| 20 | 72 °C 3 min |
Table 4: PCR conditions for the first/external PCR.
- Perform index barcoding (Second/Internal PCR) and gel extraction
- During the second (internal) PCR, reverse index primer is used to barcode the samples; therefore, use different index primers for each sample.
NOTE: For libraries generated using pLentiCrispr v2 backbone, use reverse index primers that end with CT bases, labeled as lenticrisprv2_rev(index X) (see Supplementary Table 2). - For libraries generated using pLentiGuide backbone, use indexes that end with GT bases and are labeled as rev_index_X in Supplementary Table 2.
- Prepare a forward staggered primer mix by combining 2 µL from each of the nine staggered primers (stock 100 µM) and adding 162 µL of nuclease-free water to a sterile microcentrifuge tube. The final concentration of the primer mix will be 10 µM.
- Use the pooled external PCR product as input and perform two parallel 100 µL internal PCR reactions per sample by using the instructions in Table 5 and Table 6. Prepare a PCR control reaction using the 'No template DNA' control from external PCR (step7.3) as input to monitor potential contamination.
- Add DNA Polymerase lastly, mix well by tapping or pipetting, briefly spin down the PCR tubes before putting them into the thermal cycler. Perform hot-start to prevent non-specific amplifications.
- Combine and run internal PCR reactions in 2% agarose gel to separate the target amplicon.
NOTE: No bands should be detected in the no-template PCR controls. A distinct band around 337 bp for LentiCrispr_V2 and 357 bp for LentiGuide libraries should be observed. An upper non-specific band of approximately 500 bp may also be present and should be excluded from downstream processing. - Load 12 µL (10 µL of PCR product + 2 µL of loading dye) of internal PCR product to visualize the bands, load the rest of the PCR product in merged or adjacent wells designated for gel extraction. Minimize agarose thickness to maximize the DNA recovery. Avoid overexposing the gel extraction lanes while visualizing to minimize the UV-induced DNA damage during gel excision.
- Purify PCR products from agarose gel using a specific gel extraction kit (e.g., NucleoSpin Gel and PCR Clean-up) following the manufacturer's instructions. Measure the DNA concentration using a spectrophotometer. Store PCR products at -20 °C.
NOTE: A minimum concentration of >20 ng/µL after gel extraction is required for proper sequencing. If the required yield could not be achieved even with three parallel internal PCR reactions, isolate new gDNA and repeat the process.
- During the second (internal) PCR, reverse index primer is used to barcode the samples; therefore, use different index primers for each sample.
| Reagent | Volume per reaction |
| dNTP (10 mM each) | 2 µL |
| Phusion Polymerase | 1 µL |
| 6´ GC Buffer | 20 µL |
| Forward Stagger Mix primer (10 µM) | 5 µL |
| Reverse Index Primer (10 µM) | 5 µL |
| External PCR | 5 µL |
| Nuclease-free water | 62 µL |
| Total | 100 µL |
Table 5: Required reagents for the second/internal PCR.
| Cycle number | Denature | Annealing | Extension |
| 1 | 95 °C, 3 min | ||
| 2–25 | 95 °C, 25 s | 65 °C, 20 s | 72 °C 15 s |
| 26 | 72 °C 3 min |
Table 6: PCR conditions for the second/internal PCR.
9. Sequencing
- Determine the required number of mapped reads based on the library coverage that is defined at the beginning of the screen. Assuming a mapping efficiency of 60%–70%, request a higher number of total reads to compensate for the read loss. For 1000× coverage of the EPIKOL library, ~8 million mapped reads are required, corresponding to 10–12 million total reads.
- Perform quality control of the sequencing libraries using Tapestation or Bioanalyzer prior to sequencing to confirm the library size and integrity.
- Pool sequencing libraries from different samples before sequencing, since they are uniquely barcoded with index primers.
- Confirm read structure (R1/R2 orientation) and demultiplexing requirements with the sequencing facility. 2× 150 bp paired sequencing is suggested in Illumina HiSeq, Novaseq, or an equivalent Illumina-compatible sequencing platform. Consider requesting at least 5% PhiX spike-in to improve sequencing diversity.
10. Overview of sequencing analysis for EPIKOL
- Use the MAGeCK analysis pipeline to analyze paired-end FASTQ files24. Organize each biological replicate as an individual input file.
- Use the sgRNA input file of EPIKOL that is compatible with MAGeCK as a reference library (provided in Supplementary Table 4) and apply the count function to quantify sgRNA reads from individual FASTQ files to create raw count files for each replicate and condition.
- Normalize each count file using Reads per million (RPM) normalization to check the quality and distribution of each sample by visualizing the normalized sgRNA count graphs14.
- Perform a second -count function to merge counts into a single file using median normalization with default settings.
- Run -test function to identify gene-level changes using merged raw count files. To evaluate screen performance, compare Tfinal samples to the T0 samples and check the distribution of non-targeting control and essential gene-targeting sgRNAs.
NOTE: It is critical to assess depletion of positive control genes in each screen arm to evaluate screen performance. It is expected to see biological variability between replicates in the drug-treated screen arm as drug exposure can cause stochastic differences in cellular response. This variability is inherent to chemoresistance screens and does not necessarily indicate poor screen quality. Therefore, during hit-calling, at least three biological repeats must be analyzed together, and hits should be determined as the genes that have at least 6 effective sgRNAs out of 10. - To identify drug-induced changes in sgRNA abundances and gene-level effects, compare Tfinal-Taxol treated samples to Tfinal-DMSO, using the DMSO group as a control.
- Apply a false-discovery rate (FDR) cutoff of FDR < 0.05 to identify depleted genes in the treatment group to reveal the genes that contribute to the fitness or resistance of the Taxol-resistant cells.
Results
To study epigenetic regulators of chemoresistance in TNBC, the overall protocol using the SUM159PT cell line is shown in Figure 1. First, IC10 and IC50 values of Taxol in SUM159PT cells were determined by treating the cells with increasing concentrations of Taxol (Figure 2A). A stepwise dose escalation method was used to generate Taxol-resistant SUM159PT cells. After several months, a shift in IC50 values illustrates the successful establishment of a resistant phenotype using this protocol when compared to control cells that were passaged in parallel without Taxol exposure (Figure 2B).
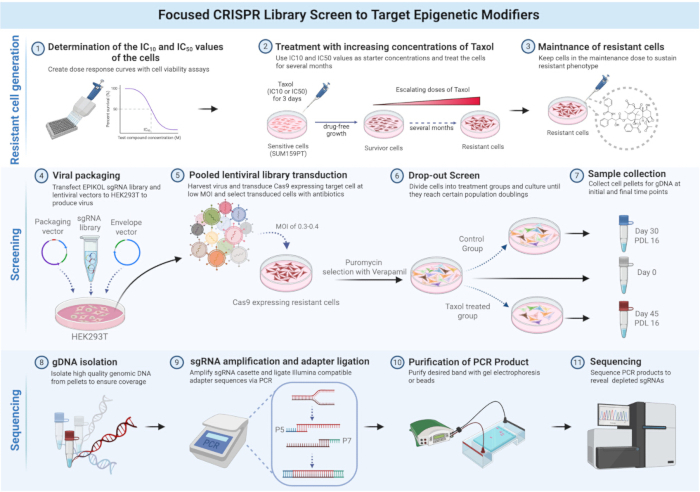
Figure 1: Schematic of the EPIKOL screen in Taxol-resistant SUM159PT cells. Overall workflow of EPIKOL screening in the generated Taxol-resistant SUM159PT cells. The figure was created with BioRender.com Please click here to view a larger version of this figure.
Once the resistant cells were established, several experiments were performed to characterize their phenotypic and molecular changes. Proliferation capacities of resistant cells under Taxol treatment were assessed with a colony formation assay in comparison to parental cells. As seen in Figure 2C,D, resistant cells maintain their proliferative capacity under Taxol treatment while parental cells cannot survive. This assay is one of the important steps in resistant cell characterization and demonstrates how proliferative capacity under drug treatment can be assessed between parental and resistant cells.
As a part of the resistant cell characterization, RNA sequencing was performed on parental and resistant cells to analyze the transcriptomic changes associated with chemoresistance (Figure 2E). Among the most upregulated genes in resistant cells was ABCB1, and it was followed by a couple of other ABC transporters, including ABCB4 and ABCA5. The upregulation of ABCB1 expression was validated with quantitative polymerase chain reaction (qPCR), and this illustrates how candidate gene expression changes can be validated using qPCR (Figure 2F).
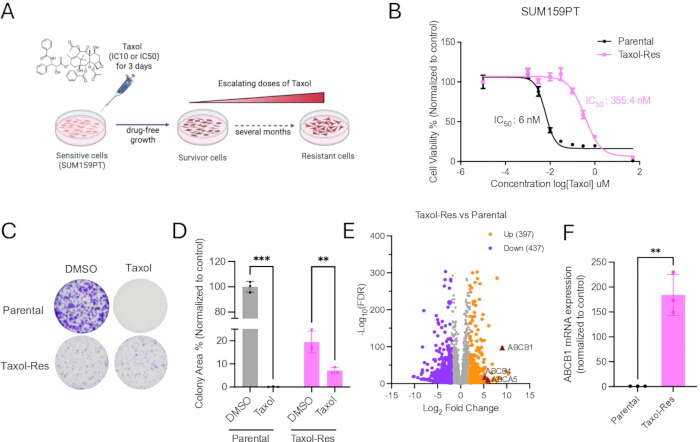
Figure 2: Generation of resistant cells and their characterization. (A) Schematic showing the generation of Taxol-resistant SUM159PT cells with the dose escalation method. (B) Dose response curve showing the difference between IC50 values of parental and generated resistant cells. Parental IC50 = 6 nM and Taxol-resistant IC50 = 355.4 nM. (C) Colony formation assay in the presence of Taxol. (D) Quantification of colony areas in (C.) Two-way analysis of variance (ANOVA) with Tukey's post hoc test was applied using Prism 8 (GraphPad Software). Significance levels were set as *P < 0.05, **P < 0.01, ***P < 0.001. (E) Volcano plots showing differentially expressed genes in Taxol-Res cells compared to parental cells, with an LFC>2 and p<0.001 cutoff. (F) qPCR validation of ABCB1 mRNA expression in parental and Taxol-Res cells. P values determined by two-tailed Student's t-test in comparison with control group; **P < 0.01. Panel A was created with BioRender.com. Panel E figure has been modified with permission from Yedier-Bayram et al.17. Please click here to view a larger version of this figure.
After showing overexpression of ABCB1 and other ABC transporters in Taxol-resistant cells and considering the broad substrate spectrum of ABCB1, the presence of MDR phenotype was assessed. To this end, Taxol-resistant cells were treated with multiple drugs that are known substrates of ABCB1 transporter and have different mechanisms of action, and their drug sensitivity was evaluated (Figure 3A,B). In line with the observed ABC transporter expression profile, Taxol-resistant cells also showed resistance to Doxorubicin and Vincristine, confirming the presence of MDR profile and illustrating how multidrug resistance phenotype can be functionally assessed.
MDR phenotype is a challenge for the CRISPR-based screening approach, EPIKOL, given that the library requires puromycin selection to enrich transduced cells. Since puromycin can be pumped out of the cells by ABCB1-mediated drug efflux, puromycin selection may not be efficient in resistant cells (Figure 3C). Hence, non-transduced cells can survive selection, confounding screen outcomes.
To address this limitation, the selection process of chemoresistant cells with an MDR profile was optimized prior to the EPIKOL screen. Verapamil, a first-generation ABCB1 inhibitor, was used to block ABC transporter-mediated drug efflux, thereby allowing intracellular accumulation of chemotherapeutic agents or puromycin (Figure 3D). While verapamil alone did not affect cell viability, it restored drug sensitivity when combined with chemotherapeutic agents (Figure 3E,F). Similarly, puromycin kill curves combined with non-toxic doses of verapamil demonstrated that ABCB1 inhibition restores puromycin sensitivity (Figure 3G,H). This ensures that cells surviving selection are those that are successfully transduced rather than cells escaping selection due to ABCB1-driven drug efflux. Establishing an effective selection workflow in chemoresistant cells is crucial for reliable EPIKOL screen outcomes.
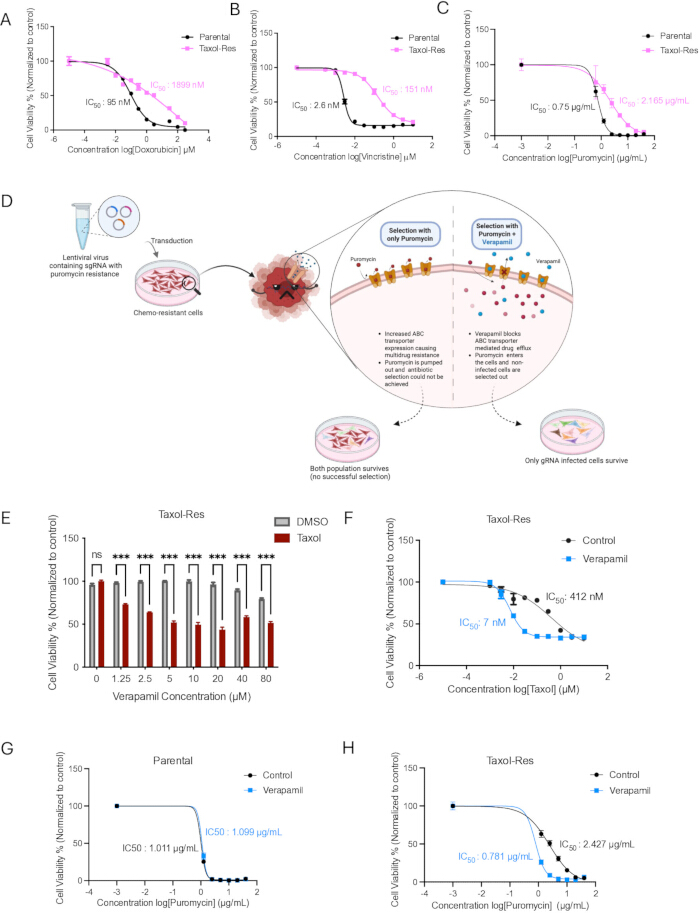
Figure 3: Multidrug resistance phenotype and effect of verapamil on resistant cells. Dose response curves showing the difference between IC50 values of parental and generated resistant cells with (A) Doxorubicin, (B) Vincristine, (C) Puromycin. (D) Schematic showing the selection of Taxol-resistant SUM159PT cells with and without verapamil. The figure was created with BioRender.com. (E) Cell viability assay with Taxol-Res cells to determine optimal verapamil concentration with Taxol. (F) Verapamil resensitizes Taxol-resistant cells to Taxol. (G) Verapamil does not alter Parental cells' response to puromycin. (H) Verapamil restores puromycin sensitivity in Taxol-Res cells. Panels A, B, and F have been reused with permission from Yedier-Bayram et al.17. Please click here to view a larger version of this figure.
To find novel regulators of chemoresistance in TNBC, an EPIKOL screen was performed with Taxol-resistant SUM159PT cells as illustrated in Figure 4A. Since resistant cells grow slower than parental cells17, population doubling levels were monitored throughout the screen in both Taxol and DMSO-treated groups to determine the time required to reach 16 population doublings (Figure 4B). Accordingly, EPIKOL screening for the DMSO-treated group was completed at approximately Day 35, while the Taxol-treated group was cultured for an additional 15 days to reach the same population doubling level.
Following sequencing, the MAGeCK analysis pipeline was used to combine the effect of sgRNAs targeting the same gene to reveal the gene-level changes upon knockout24. EPIKOL library includes sgRNAs targeting essential genes as positive controls, the first quality control step was to assess whether these sgRNAs were depleted as expected. Waterfall plots illustrate the Log2 fold changes of essential genes across different comparisons (Figure 4C–E). When final timepoint samples from DMSO- or Taxol-treated conditions were compared to the initial timepoint, almost all essential genes were depleted upon knockout, indicating effective screen performance (Figure 4C,D). However, this depletion is not clearly observed when the two endpoint samples (DMSO-treated and Taxol-treated) were compared to each other, as expected, since essential genes are required for cell survival under both conditions (Figure 4E).
An alternative visualization of the screen results is the volcano plot, which displays the Log2 fold changes together with statistical significance (the p-value or FDR values). In the EPIKOL screen performed in Taxol-resistant cells, multiple positive control genes were identified as significantly depleted, further supporting the reliability of the screen since depletion of sgRNAs targeting positive control genes illustrates a typical quality control of a successful screen (Figure 4F). In addition to essential gene controls, the EPIKOL library includes context-specific positive control sgRNAs targeting several ABC transporter genes. As expected, normalized counts of ABCB1 sgRNAs in different groups highlighted the significant depletion of ABCB1-targeting sgRNAs specifically in the Taxol-treated group (Figure 4G). Overall, this demonstrates how sgRNA-level changes can be interpreted to identify candidate genes associated with drug response.
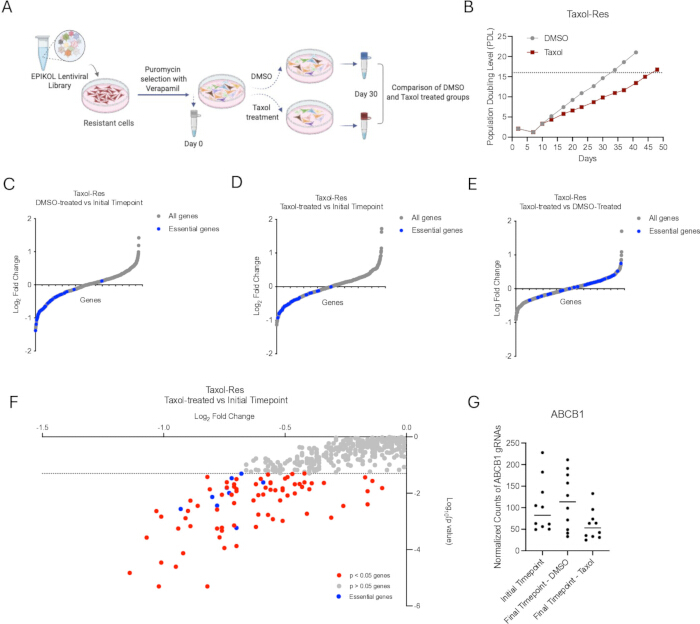
Figure 4: EPIKOL screen results in Taxol-resistant cells and example graphs. (A) Schematic of EPIKOL screen protocol. (B) Population Doubling Level (PDL) of Taxol-Res cells. (C–E) Waterfall plots showing results of EPIKOL screen on Taxol-Res cells, highlighting essential genes, DMSO-treated group compared to the Initial timepoint in panel C, Taxol-treated group compared to the Initial timepoint in panel D, Taxol-treated group compared to the DMSO-treated group in panel E. (F) Volcano plot showing Log2FoldChanges of genes in Taxol-treated samples compared to the Initial timepoint. Genes that have p<0.05 were colored and labeled. This figure has been modified from a previous publication17. (G) Read per million (rpm) counts of 10 different ABCB1 sgRNA graphs from EPIKOL. Panel A was created with BioRender.com. Panel E has been reused with permission from Yedier-Bayram et al.17. Please click here to view a larger version of this figure.
Supplementary Table 1: Troubleshooting table.Please click here to download this file.
Supplementary Table 2: Viral Titer and MOI calculation.Please click here to download this file.
Supplementary Table 3: sgRNA list of EPIKOL library.Please click here to download this file.
Supplementary Table 4: Primers used in EPIKOL sequencing library preparation. Please click here to download this file.
Discussion
CRISPR-Cas9-based pooled screening approaches are well established in different cellular contexts. However, screening in chemoresistant cells presents distinct challenges and requires additional optimization. Since chemoresistant cells serve as valuable models to study the vulnerabilities of chemoresistant tumors, it is important to address these limitations in screening strategies to reliably identify genetic or epigenetic regulators of chemoresistance.
Generation of chemoresistant cell lines itself may be cumbersome and is highly dependent on the chemotherapeutic agent used. While cells may readily adapt to certain drugs, they can be highly susceptible to others25. Therefore, it is important to determine cell line-specific IC50 values prior to the resistant cell line generation protocol. In cases where cells fail to tolerate IC50-level drug exposure over several passages, it is possible to start with a lower drug concentration (e.g., IC10-20) (see Protocol section 1)17. Since the acquisition of resistance is a stochastic event, several wells/plates of cells might be treated at the same time to increase the likelihood of obtaining resistant cells. It is crucial to comprehensively characterize the obtained drug-resistant cell population in order to describe transcriptional and phenotypic changes during the dose-escalation procedure in comparison to their naïve state. Global profiling approaches such as RNA-seq can be employed to identify differentially expressed genes relative to the parental line. Functionally, acquired drug resistance should be validated with cell viability and proliferation assays to demonstrate that resistant cells maintain survival under drug treatment conditions that are cytotoxic to parental cells. Also, potential changes in their proliferative capacity and growth rate should be measured in comparison to the parental cell line to calculate their respective PDLs. Since acquired Taxol resistance is known to be mediated, at least in part, by ABC-mediated drug efflux, the expression of key ABC transporters (e.g., ABCB1) should be evaluated at the mRNA and protein levels using qPCR and Western blotting, and can be complemented by transcriptomic data. Based on the ABC transporter expression profile, the presence of MDR phenotype should be considered, and resistance to other chemotherapeutic agents should be assessed. In our previous study, we characterized the Taxol-resistant cell lines and identified ABCB1 as one of the most upregulated genes, and we reasoned that ABCB1-mediated multidrug resistance can cause failure in puromycin selection17. Therefore, after resistant cell generation, expression of ABC transporters and MDR phenotype must be assessed before any transfection procedure.
The dose-escalation method offers advantages over high-dose drug exposure protocols, as cells can be cryopreserved at each step before increasing the drug dose, providing flexibility and safeguarding against culture loss. Moreover, gradual dose escalation allows acquisition of resistance phenotypes over time, enabling adaptive evolution; in contrast to acute high-dose treatment, which results in selection of pre-existing resistant subpopulations. Its stepwise progression enables researchers to deliberately choose the desired resistance level at which to stop selection and evaluate the properties of the resulting phenotype. Also, the intermediate steps of the dose escalation could be leveraged to study mechanisms of acquired resistance in a time-course manner. According to the underlying biological question, different resistant levels could be obtained to study either early adaptive mechanisms with lower resistance levels or stable and fully established resistance phenotypes in more resistant cells. Moreover, clinically relevant resistance thresholds vary substantially depending on the drug, cell line, and intrinsic proliferation rate; therefore, the timeline of dose escalation may differ accordingly (in our case, the generation of Taxol-resistant cells required approximately 6 months). Consistent with this rationale, we established two different levels of resistance with SUM159PT cells in our previous study and compared their distinct and shared features17. Therefore, we recommend that researchers define the target IC50 range of the drug of interest according to clinical and biological relevance.
It is well established that withdrawal of drug pressure may lead to loss of chemoresistance, as cells may rewire their epigenome and transcriptome25. For this reason, it is suggested to assess the stability of the resistance phenotype over several months. If cells tend to revert back to a sensitive state upon drug withdrawal, resistant cells may be cultured in the presence of the maintenance dose, typically corresponding to the final drug concentration used during resistance generation, to preserve their resistance phenotype. While in vitro chemoresistant cell line models are practical, reproducible, and widely used for studying acquired chemoresistance, they may not fully recapitulate the phenotypic heterogeneity observed in patient tumors and lack the tumor microenvironment, immune interactions, and spatial heterogeneity3,4,25. Furthermore, prolonged passaging during the resistance generation can cause genetic and epigenetic alterations diverging from those observed in patient samples, potentially limiting the translational relevance of identified hits. Therefore, candidate genes and mechanisms identified through this protocol should be further validated in more clinically relevant experimental systems, such as co-culture models, patient-derived organoids, or in vivo studies. EPIKOL provides advantages with its focused nature if complementary screens are to be performed on these models, where the maximum number of cells that can be obtained is inherently limited.
Chemoresistant cells often grow more slowly than their parental counterparts, which can pose a practical challenge for genome-wide screens that require large cell populations to maintain library coverage. Focused libraries such as EPIKOL offer an advantage to perform a screen with less amount of starting material while providing increased sgRNA depth per gene, thereby improving sensitivity and reproducibility within the defined target space. However, by design, EPIKOL only captures epigenetic resistance mechanisms and does not cover non-epigenetic contributors to chemoresistance. The choice of library should therefore be guided by prior experiments and the specific biological question. Users of these libraries should be aware of the limitations of the focused libraries and should interpret the results within the scope of the library.
A major barrier in CRISPR screening of chemoresistant models is the emergence of MDR phenotype driven by ABC transporter upregulation9,10. Different ABC transporters mediate the efflux of different substrates. Once a drug-resistant cell line is generated, it is important to assess whether resistance extends to other chemotherapeutic agents. Puromycin resistance is mainly caused by ABCB1 overexpression, and this affects the selection process of the pooled CRISPR screening approaches, as most of these libraries carry puromycin selection cassettes for enrichment of transduced cells. Here, we utilized verapamil, a first-generation ABCB1 inhibitor, to facilitate intracellular accumulation of puromycin and selectively eliminate the untransduced resistant cells that would otherwise escape the selection due to ABCB1-mediated drug efflux. Since verapamil binds ABCB1 reversibly, ABCB1 function is restored within hours upon removal of verapamil. Therefore, verapamil does not confer an additional vulnerability to resistant cells during the subsequent drug treatment phase of the screen. However, several limitations of verapamil should be acknowledged. Since verapamil is an inhibitor of calcium channels and other transporters, it can influence cellular physiology beyond ABCB1 inhibition10. Additionally, effective verapamil concentration varies across cell lines and MDR models depending on the level of ABCB1 expression and the activity of other transporters. Therefore, verapamil concentration should be optimized for each cell line, and a new generation of ABCB1 inhibitors more specific to ABCB1 may be considered if off-target effects are a concern. As another critical step, viral titering should be performed on the resistant cell itself rather than the parental counterparts, as the infectivity and selectability often differ for resistant cells.
Another important consideration is to determine the appropriate duration of the screen, as chemoresistant cells often grow more slowly than their matched parental counterparts26. To account for this difference, we utilized population doubling level calculations (Protocol section 6) to assess when the control and treatment groups reached the desired PDL threshold. Screens may therefore be terminated on different days, allowing comparable population doublings and enabling safer interpretation of sgRNA effects in the treatment group.
Library preparation PCRs are considerably important for the accuracy of the downstream hit identification. Bias introduced by low gDNA input and increased PCR cycles may lead to amplification of certain sgRNA sequences, causing false-positive enrichments or depletions. To mitigate this, we recommend using the maximum amount of gDNA possible, adhering to the PCR cycle numbers that are offered by this protocol, and running parallel reactions to pool before sequencing. When possible, library coverage should not fall below the recommended thresholds (>300× coverage) to ensure reliable detection of depleted sgRNAs rather than stochastic dropout of low-abundance sgRNAs due to low coverage.
Following sequencing, we used the MAGeCK analysis framework and performed several downstream quality control analyses and data interpretation steps24. First, principal component analysis (PCA) was used to assess the distribution and reproducibility of biological replicates (data not shown, MAGeCK output). Replicate clustering in PCA is expected within each arm; however, higher variability in the drug-treated arm is a common feature of chemoresistance screens, as the drug can induce stochastic changes. If the positive and negative controls behave as expected in each arm, this variability does not prevent identification of true-positive hits. Next, reads per million (RPM) normalization of sgRNA counts at the initial and final timepoints was applied to evaluate whether sgRNAs targeting essential genes were depleted as expected14. Subsequently, median normalization was used to aggregate sgRNA-level effects, enabling identification of gene-level depletions24. Gene-level depletion scores were visualized using waterfall plots, which rank genes from the most depleted to the enriched ones. Copy number alterations and polyploidy arising from prolonged drug exposure can confound screen results through inefficient or excessive Cas9 cutting27. While EPIKOL targets chromatin regulators that are generally not subject to Taxol-driven amplifications, we recommend assessing ploidy status and copy number changes in the resistant cells before screening. If copy number changes are suspected, computational correction tools such as CRISPRcleanR or CERES can be applied during MAGeCK analysis.
In screens involving two experimental arms, control and treatment groups, different comparisons are required to properly interpret screen performance and biological dependencies17. Initial-to-final comparisons are suited for assessing screen performance, including expected behavior of essential genes and non-targeting controls. Comparison of the endpoint of the control group (DMSO) with the initial time point allows identification of genes required for the growth and fitness of resistant cells in the absence of drug pressure. In contrast, comparison of two endpoint samples, drug-treated (Taxol) and control (DMSO), reveals the specific genes that were required for resistance to the drug rather than general fitness. It should be noted that direct comparison of the two endpoint samples leads to a skewed distribution of essential gene controls, as they are required for survival in both groups. An alternative visualization method might be the Volcano plot, which displays log2 fold changes together with significance values, enabling identification of significantly depleted genes. Once the candidate genes are identified, normalized sgRNA counts and visualization plots are useful to decide on the best-performing sgRNAs for downstream validation assays. For the EPIKOL screen, we recommend prioritizing candidate genes supported by the concordant behavior of at least 6 out of 10 sgRNAs, as this provides greater confidence in gene-level effects.
Here, we provide an optimized protocol for performing EPIKOL screening on Taxol-resistant cell lines that have upregulated ABCB1 and exhibited MDR phenotype. This protocol is broadly applicable to any chemoresistant model that displays cross-resistance to puromycin or other selection antibiotics, thereby enabling CRISPR screening in these cells. Practical guidance for the most common technical challenges encountered across all protocol steps is provided in Supplementary Table 1.
Disclosures
The authors declare no conflict of interest.
Acknowledgements
This work was supported by the Scientific and Technological Research Council of Turkey (TUBITAK) 1003- 216S461 and 1001-221S419 Grants. Schematic illustration figures were created with BioRender.com and licensed for publication (Figure 1: LB29MV4E2Q, Figure 2: JZ29CC68WD, Figure 3: BV29CC72LB, Figure 4: BN29CC6XFH). The authors acknowledge the use of ChatGPT (OpenAI) solely for grammatical editing and English language enhancement. The tool did not contribute to the generation of scientific content. We gratefully acknowledge the use of the services and facilities of the Koç University Research Center for Translational Medicine (KUTTAM), funded by the Presidency of Turkey, Head of Strategy and Budget.
Materials
| Name | Company | Catalog Number | Comments |
|---|---|---|---|
| 100 mm plate | Corning | 353003 | Cell culture |
| 45 µm filter | Sigma-Aldrich | SLHVM33RS | Cell culture |
| 6 well plate | Corning | 3506 | Cell culture |
| 96-well black clear bottom plates | Sigma-Aldrich | CLS356259 | For CellTiter-Glo Luminescent Cell Viability Assay |
| Blasticidin | Thermo Fisher | A1113903 | For selection |
| CellTiter-Glo luminescent cell viability assay | CellTiter-Glo, Promega | G7570 | For CellTiter-Glo Luminescent Cell Viability Assay |
| DMEM | Gibco | Cell culture | |
| DMSO | PanReac AppliChem | A3672,0050 | Cell culture |
| FBS | Gibco | 16140071 | Cell culture |
| Ham’s F12 nutrient mix | Gibco | 11765054 | Cell culture |
| HEK293T cells | Kind gifts from Robert Weinberg (MIT, Boston, USA). | ||
| HEPES | Thermo Fisher | 15630080 | Cell culture |
| Hydrocortisone | Sigma-Aldrich | H4001-1G | Cell culture |
| Insulin | Sigma-Aldrich | I9278-5ML | Cell culture |
| LentiCas9-blast | Addgene | #52962 | For Cas9-stable cell line generation |
| LentiGuide-Puro | Addgene | #52963 | Backbone for gRNA cloning |
| MN NucleoSpin tissue kit | Macherey-Nagel | 740952.5 | For genomic DNA extraction |
| PBS | Gibco | 10010023 | Cell culture |
| Penicillin-Streptomycin | Gibco | 15140122 | Cell culture |
| pLentiCRISPR v2 | Addgene | #52961 | Backbone for gRNA cloning |
| Polyethylene glycol (PEG)-8000 | Sigma-Aldrich | P2139-500G | For lentivirus concentration |
| Polyethylenimine, linear (PEI) | Sigma-Aldrich | 765090-1G | For lentivirus production |
| Protamine sulfate (PS) | Sigma-Aldrich | P4380-25G | For lentivirus infection |
| psPAX2 | Addgene | # 12260 | For lentivirus production |
| Puromycin | Thermo Fisher | A1113803 | For selection |
| SUM159PT adherent cells | Kind gifts from Robert Weinberg (MIT, Boston, USA). | ||
| Taxol | Paclitaxel, Sigma | PHR1803-200MG | For res cell generation and maintenance |
| Trypsin-EDTA (0.05%) | Gibco | 25300054 | Cell culture |
| Verapamil | Selleck Chemicals | S4202 | For selection |
| VSV-G | Addgene | # 8454 | For lentivirus production |
References
- Almansour, N. M. Triple-negative breast cancer: brief review about epidemiology, risk factors, signaling pathways, treatment and role of artificial intelligence. Front Mol Biosci. 9, 836417 (2022).
- Nedeljkovic, M., Damjanovic, A. Mechanisms of chemotherapy resistance in triple-negative breast cancer-how we can rise to the challenge. Cells. 8 (9), 957 (2019).
- Bianchini, G., Balko, J. M., Mayer, I. A., Sanders, M. E., Gianni, L. Triple-negative breast cancer: challenges and opportunities of a heterogeneous disease. Nat Rev Clin Oncol. 13 (11), 674–690 (2016).
- Holohan, C., Van Schaeybroeck, S., Longley, D. B., Johnston, P. G. Cancer drug resistance: an evolving paradigm. Nat Rev Cancer. 13 (10), 714–726 (2013).
- Flavahan, W. A., Gaskell, E., Bernstein, B. E. Epigenetic plasticity and the hallmarks of cancer. Science. 357 (6348), eaal2380 (2017).
- Beretta, G. L. et al. Novel insights into taxane pharmacology: update on drug resistance mechanisms, immunomodulation and drug delivery strategies. Drug Resist Updat. 81, 101223 (2025).
- Sajid, A., Rahman, H., Ambudkar, S. V. Advances in the structure, mechanism and targeting of chemoresistance-linked ABC transporters. Nat Rev Cancer. 23 (11), 762–779 (2023).
- Szakacs, G., Paterson, J. K., Ludwig, J. A., Booth-Genthe, C., Gottesman, M. M. Targeting multidrug resistance in cancer. Nat Rev Drug Discov. 5 (3), 219–234 (2006).
- Robey, R. W. et al. Revisiting the role of ABC transporters in multidrug-resistant cancer. Nat Rev Cancer. 18 (7), 452–464 (2018).
- Chen, Z. et al. Mammalian drug efflux transporters of the ATP binding cassette (ABC) family in multidrug resistance: review of the past decade. Cancer Lett. 370 (1), 153–164 (2016).
- You, D., Richardson, J. R., Aleksunes, L. M. Epigenetic regulation of multidrug resistance protein 1 and breast cancer resistance protein transporters by histone deacetylase inhibition. Drug Metab Dispos. 48 (6), 459–480 (2020).
- Shalem, O., Sanjana, N. E., Zhang, F. High-throughput functional genomics using CRISPR-Cas9. Nat Rev Genet. 16 (5), 299–311 (2015).
- Doench, J. G. Am I ready for CRISPR? User's guide to genetic screens. Nat Rev Genet. 19 (2), 67–80 (2018).
- Yedier-Bayram, O. et al. EPIKOL, chromatin-focused CRISPR/Cas9-based screening platform, to identify cancer-specific epigenetic vulnerabilities. Cell Death Dis. 13 (8), 710 (2022).
- Gottesman, M. M., Lavi, O., Hall, M. D., Gillet, J. P. Toward better understanding of the complexity of cancer drug resistance. Annu Rev Pharmacol Toxicol. 56, 85–102 (2016).
- Theile, D., Staffen, B., Weiss, J. ATP-binding cassette transporters as pitfalls in selection of transgenic cells. Anal Biochem. 399 (2), 246–250 (2010).
- Yedier-Bayram, O. et al. Chromatin-focused genetic and chemical screens identify BRPF1 as a targetable vulnerability in Taxol-resistant triple-negative breast cancer. Exp Mol Med. 57 (6), 1294–1307 (2025).
- Gokbayrak, B. et al. Identification of selective SWI/SNF dependencies in enzalutamide-resistant prostate cancer. Commun Biol. 8 (1), 169 (2025).
- Kala, E. Y. et al. Functional genomic screens reveal RBBP4 as key regulator of cell cycle progression in TMZ-resistant glioblastoma. bioRxiv. doi:10.1101/2025.05.09.653010 (2025).
- Chan, K., Tong, A. H. Y., Brown, K. R., Mero, P., Moffat, J. Pooled CRISPR-based genetic screens in mammalian cells. J Vis Exp. 151, e59780 (2019).
- Yuan, Y. et al. Genome-wide CRISPR screen for unveiling radiosensitive and radioresistant genes. J Vis Exp. 219, e67982 (2025).
- Stewart, C., Manriquez Roman, C., Kenderian, S. S. Performing an in vitro genome-wide CRISPR knockout screen in chimeric antigen receptor T cells. J Vis Exp. 215, e67338 (2025).
- Joung, J. et al. Genome-scale CRISPR-Cas9 knockout and transcriptional activation screening. Nat Protoc. 12 (4), 828–863 (2017).
- Li, W. et al. MAGeCK enables robust identification of essential genes from genome-scale CRISPR/Cas9 knockout screens. Genome Biol. 15 (12), 554 (2014).
- McDermott, M. et al. In vitro development of chemotherapy and targeted therapy drug-resistant cancer cell lines: practical guide with case studies. Front Oncol. 4, 40 (2014).
- Hart, T. et al. High-resolution CRISPR screens reveal fitness genes and genotype-specific cancer liabilities. Cell. 163 (6), 1515–1526 (2015).
- Meyers, R. M. et al. Computational correction of copy number effect improves specificity of CRISPR-Cas9 essentiality screens in cancer cells. Nat Genet. 49 (12), 1779–1784 (2017).
Reprints and Permissions
