This protocol describes the establishment of patient-derived colon tumor organoids in co-culture with autologous lymphocytes, followed by treatment with therapeutic small molecules and immune checkpoint inhibitors to evaluate T cell reactivity and treatment efficacy.
Method Article
A Multimodal Framework to Assess Patient-Derived Colon Tumor Organoid–Immune Cell Co-cultures
* These authors contributed equally
In This Article
Summary
Abstract
T cells play a key role in cancer immunotherapy, and understanding their interactions with tumors is essential for developing novel immunotherapies. This protocol describes the step-by-step workflow for establishing colorectal cancer patient-derived organoids (PDOs) from our biobank and developing autologous PDO-T cell co-culture systems. Using Annexin V NIR and cleaved caspase-3 staining, we standardized flow cytometry protocols for surface and intracellular staining to assess T cell reactivity and cytotoxicity, as well as tumor organoid killing. In addition to flow cytometry-based analysis, the protocol includes methodological approaches for functional assays, such as ELISpot assays to quantify granzyme B and perforin secretion, and live-cell imaging to monitor T cell–mediated tumor killing over time via Annexin V–based apoptosis detection. This workflow further details the setup of co-culture conditions, including the incorporation of target inhibitors and immune checkpoint inhibitors in both monotherapy and combination treatment settings. Guidelines are provided for selecting and applying key immunological and tumor-associated markers, including CD137 for T cell reactivity, CD107a for T cell degranulation, caspase-3 for tumor apoptosis, and Ki67 for tumor proliferation. Collectively, this paper provides a comprehensive and reproducible framework for colorectal cancer organoid establishment, autologous T cell culture and expansion, co-culture setup, therapeutic perturbations, and downstream analyses using flow cytometry, ELISpot, confocal microscopy, and live-cell imaging.
Introduction
Colorectal cancer (CRC) remains one of the leading causes of cancer-related mortality worldwide despite advances in early detection and multimodal therapies1. A major challenge in improving patient outcomes is the lack of preclinical models that accurately recapitulate the complex architecture, intratumoral heterogeneity, tumor–immune interactions, and therapeutic responses observed in human CRC2,3,4,5,6. Conventional models, including genetically engineered mouse models (GEMMs) and patient-derived xenografts (PDXs), have significantly advanced CRC research but harbor notable limitations. GEMMs often fail to capture the diversity of human tumors and are developed in murine microenvironments that differ substantially from human physiology. Similarly, PDX models preserve aspects of tumor heterogeneity but are expensive, time-consuming, dependent on immunodeficient mice, and limited in their ability to study human-specific immune responses due to species-specific differences7,8. Additionally, increasing restrictions on small-animal use emphasize the need for more human-relevant and ethically sustainable alternatives.
In recent years, patient-derived organoids (PDOs) have emerged as a transformative platform for translational cancer research. CRC organoids generated from fresh surgical or biopsy specimens preserve the histological, genetic, and phenotypic characteristics of primary tumors, including clonal diversity and therapy-responsive cell states. These properties make PDOs valuable tools for disease modeling, functional genomics, biomarker discovery, and personalized medicine7,8,9,10,11. Importantly, the incorporation of human immune components into organoid systems has further expanded their utility. Co-culture of CRC organoids with peripheral blood mononuclear cells (PBMCs) or engineered immune subsets enables investigation of tumor–immune interactions, immune evasion mechanisms, antigen presentation, and immunotherapy responses in a physiologically relevant system12. Such models support evaluation of checkpoint inhibitors, CAR-T/TCR therapies, and bispecific antibodies while providing insight into predictive biomarkers and resistance mechanisms.
Beyond immunotherapy, CRC organoids have become increasingly important for drug screening and precision oncology applications. Patient-derived cultures can be tested against chemotherapeutic and targeted therapeutic agents to predict individual treatment responses, with several studies demonstrating correlations between organoid responses and clinical outcomes. These systems therefore provide a scalable and patient-centric alternative to conventional animal-based approaches10,13,14,15,16,17,18.
Here, a tractable, scalable protocol is presented for establishing patient-derived CRC organoids and integrating them with immune co-culture systems for translational and preclinical research. Tumor tissues are enzymatically dissociated and embedded within a three-dimensional extracellular matrix under optimized growth conditions that preserve tumor heterogeneity and lineage differentiation. Established organoids can be expanded, cryopreserved, genetically manipulated, and used for downstream applications, including molecular characterization, drug perturbation studies, and immune profiling. In addition, co-culture with PBMCs enables assessment of immune-mediated cytotoxicity, checkpoint blockade sensitivity, and tumor-specific immune activation.
We further describe protocols for tissue processing, organoid quality assessment, flow cytometric analysis, immunofluorescence imaging, and ELISpot-based immune monitoring. Collectively, these organoid-based systems provide an ethically sustainable and clinically relevant platform for studying CRC biology, therapeutic resistance, tumor heterogeneity, and immunotherapy responses. Ongoing advances in organoid engineering and microenvironmental integration continue to position these models as a cornerstone of future CRC research and precision oncology.
Protocol
All patients provided informed consent under the IRB-approved Montefiore Einstein Comprehensive Cancer Center Biobank protocol (Einstein IRB# 2021-13730). Clinical coordination and regulatory support were provided by the Cancer Clinical Trials Office (CCTO). Tumor tissues were collected after standard-of-care surgical resection and pathology review, then processed for formalin fixation, patient-derived organoid generation, or cryopreservation in DMEM with 20% FBS and 10% DMSO. All reagent preparations are in Table 1.
1. Establishment of tumor organoid culture from biopsy or resection tissue (4 h)
- Place the freshly obtained tumor tissue in a sterile Petri dish and wash it with organoid washing buffer 5 times, each time for 5 min on ice. Using a sterile razor blade or fine needles, dissect the tissue into small cubes of approximately 1–2 mm3.
NOTE: Keep the tissue moist with ice-cold phosphate-buffered saline (PBS) during dissection to prevent drying. - Transfer dissected tissue fragments into a 15 mL Falcon tube, wash once with Dulbecco's phosphate-buffered saline (DPBS), and centrifuge at 200 x g for 5 min at room temperature (RT). Carefully discard the supernatant, then transfer the tissue cubes to a sterile 6-well plate or a 35-mm Petri dish.
- Using sterile, angled, autoclaved scissors, chop the tissue further into finer pieces. Using 1X Gentle Collagenase/Hyaluronidase, dilute 1 mL in 9 mL of DPBS. Add 10 µL of Y-27632 (ROCK inhibitor) and 20 µL of Primocin.
- Add pre-warmed dissociation solution into the 15 mL tube containing the tissue pieces. Re-coat your P1000 tip before pipetting up and down to agitate the tissue pieces.
- Incubate the 15 mL tube in a 37 °C rocking water bath for 30 min, inverting every 10 min. Allow tissue pieces to settle, transfer most of the digestion solution to a new tube, and centrifuge at 500 x g for 5 min at RT.
- Add 1 mL DMEM to the original 15 mL tube and vigorously pipette with a coated P1000 tip to mechanically dissociate tissue fragments and release additional crypts.
- Check progress under a microscope to monitor whether tissue is breaking down into single cells or small clusters. Transfer 10–20 µL of your DMEM with tissue pieces to a petri dish and examine under a microscope for crypts.
NOTE: Incubation time varies with sample type. For biopsies, the incubation time is 15–30 min, and for surgical resections, it is 45–60 min. - Once crypts are detected (or after 30 min for biopsies/60 min for resections), stop digestion with an equal volume of ice-cold basal medium and centrifuge at 500 x g for 5 min at RT.
- Wash the pellet with DPBS to resuspend it, then spin down again. Optionally, transfer the suspension into a conical tube and centrifuge at 300 x g for 5 min at RT to pellet cells.
NOTE: For CRC, RBC lysis is usually not required. - If the pellet appears red, lyse erythrocytes by incubating in 5 mL RBC lysis buffer for 15 min at RT. After lysis, immediately fill the tube with PBS and centrifuge again.
- Wash the pellet once with DPBS. Centrifuge at 300 x g for 5 min at RT, then discard the supernatant. Resuspend the pellet in a small volume of medium. Count live cells using a hemocytometer with trypan blue exclusion or an automated cell counter.
- Resuspend cells in ice-cold Matrigel (basement membrane matrix) (Optional: concentration of ~1.5–3 x 10⁴ cells per 10 µL medium). Mix the cell suspension with basement membrane matrix using chilled wide-bore tips (some labs use a 1:1 ratio of basement membrane matrix to complete organoid media).
NOTE: Keep the basement membrane matrix and all mixtures ice-cold to prevent premature polymerization. - Plate ~50 µL domes of the cell–basement membrane matrix mixture into each well of a pre-warmed, sterile 24-well culture plate. Incubate the plate at 37 °C for 10–12 min to allow the basement membrane matrix to solidify into a dome shape (make the plate upside down).
- After the basement membrane matrix solidification, flip the plate upright. Carefully add 500 µL/well of PDO media containing Rock inhibitor (1:1000) and Primocin (1:500).
NOTE: Use Primocin in all culture media until a frozen organoid biobank is established to prevent contamination. - Replace the organoid medium twice weekly with fresh, complete organoid medium. Monitor organoid growth regularly under a microscope.
2. Isolation of human PBMCs from blood (2 h)
- Aliquot 5 mL Histopaque into sterile 15 mL Falcon tubes, equilibrate to RT, and carefully layer an equal volume of fresh human blood (up to 5 mL) on top. Slowly layer blood along the tube wall over Ficoll without disturbing the interface; keep the total volume ≤10 mL per tube.
NOTE: Maintain distinct Ficoll and blood layers before centrifugation for optimal separation. - If using multiple tubes, balance them properly in the centrifuge. Avoid mixing or shaking. The blood–Ficoll interface must remain intact.
- Centrifuge at 1500 x g for 15 min at RT. Use 0 brake settings to prevent disruption of the gradient. After centrifugation, distinct layers will form a) the bottom RBC layer, b) the middle PBMC buffy coat, and c) the top plasma layer. Gently aspirate and discard the plasma until the buffy coat layer is visible.
NOTE: Handle the tube gently to avoid disturbing the PBMC layer. - Using a fresh sterile pipette, carefully aspirate the buffy coat layer containing PBMCs and transfer cells into a new sterile 15 mL Falcon tube. To remove Ficoll and platelets, wash cells twice with 10 mL PBSA (PBS + 0.1% BSA) by centrifugation at 1000 x g for 7 min at RT, carefully discarding the supernatant after each wash.
- To remove residual platelets, wash once with PBSA, centrifuge at 200 x g for 7 min at RT. Carefully discard the supernatant. If the pellet appears red, perform RBC lysis by incubating in 5 mL RBC lysis buffer at 37 °C for 5 min, then wash with PBSA and centrifuge at 200 x g for 7 min at RT.
- Resuspend the PBMC pellet in 2 mL DPBS or culture medium and determine viable cell counts using Trypan blue with a hemocytometer or automated cell counter. If not used immediately, cryopreserve PBMCs at 5–10 x 106 cells/mL in 90% FBS and 10% DMSO. Freeze gradually at –80 °C overnight, then transfer to liquid nitrogen for long-term storage.
- Expansion of PBMCs (7–12 days):
- Pellet cells by centrifugation at 500 x g for 5 min at RT. Resuspend at 5 x 10⁵ cells/well in T cell expansion media and activate with a CD3/CD28 cocktail.
- Stimulate cells with 500 IU/mL IL-2 and incubate for 3 days. On day 3, mix and count the cells, then expand the culture by adding IL-2–supplemented T cell expansion media.
- Adjust cells to 1–2.5 x 10^5 cells/mL in complete T Cell Expansion Medium, incubate for 2 days, and monitor viability every 2–3 days during expansion.
NOTE: Replace with fresh, warm complete medium every 2–3 days (do not exceed >3 days). PBMCs may be cryopreserved in T-cell freezing medium for future use.
3. Organoid co-culture (4 days):
- Preparation and quality control:
- Ensure organoids are healthy, contamination-free, and phenotypically characterized before co-culture. Obtain PBMCs from consented donors or commercial sources and confirm viability and basic phenotype before using.
- Determine whether PBMCs will be used fresh, rested, or pre-activated, and whether they are autologous or allogeneic. Assess organoid viability, size uniformity, and marker expression before co-culture.
- Validate PBMC viability and baseline immune composition (CD3, CD4, CD8, NK markers, monocytes), record donor metadata.
- Organoid isolation for co-culture with PBMCs:
- Remove culture medium and add pre-warmed cell recovery solution in each well to dissolve the extracellular matrix and release organoids. Gently resuspend organoids with a wide-bore pipette tip and incubate briefly until the matrix dissolves and organoids are released.
- Transfer the suspension to a collection tube, add 0.5M EDTA if needed, and adjust volume with balanced buffer. Centrifuge to pellet organoids, discard supernatant, wash with basal medium containing supplements (HEPES and Glutamax) and antibiotics, and centrifuge again to re-pellet.
- Resuspend organoids in complete culture medium, plate in a tissue-culture-treated plate, and allow recovery for ~24 h before further processing.
- Parallel PBMC recovery:
- Rapidly thaw cryopreserved PBMCs using standard practice and immediately dilute them into pre-warmed T cell expansion medium to minimize osmotic shock.
NOTE: Some cell loss is typical during thawing; pre-warming of medium improves recovery. - Centrifuge thawed PBMCs at 400 x g to pellet cells, remove freezing medium, and briefly incubate in T cell expansion medium containing benzonase to reduce cell clumping and improve single-cell suspension quality.
- Wash and re-pellet PBMCs in fresh expansion medium, then resuspend in T cell culture medium supplemented with cytokines (e.g., IL-2) to support viability and recovery. Plate PBMCs into a multi-well plate for an overnight rest period before co-culture.
- Rapidly thaw cryopreserved PBMCs using standard practice and immediately dilute them into pre-warmed T cell expansion medium to minimize osmotic shock.
- Pre-co-culture preparation (1 day before co-culture):
- Optionally treat organoids with an immune-stimulatory cytokine (e.g., IFN-γ) before co-culture to enhance antigen presentation pathways.
- Prepare the co-culture plate at least 24 h in advance by coating wells with a co-stimulatory antibody (e.g., anti-CD28) and store at 4 °C. Before use, remove unbound antibody and wash wells twice with DPBS.
- Organoid dissociation to single cells (Day of co-culture experiment):
- Collect pre-stimulated organoids, pellet and remove the supernatant, then resuspend in enzymatic dissociation reagent (e.g., TrypLE) together with any adherent cells to recover the full cell population.
- Incubate with gentle mixing and monitor microscopically until most organoids dissociate into single cells or small clusters, avoiding over-digestion.
- Quench the dissociation reagent with buffer, pellet the cells, remove the supernatant, and resuspend in T cell culture medium for counting and mixing.
- Cell counting and preparation for co-culture:
- Gently mix the cell suspension and determine viable cell numbers using a hemocytometer or automated counter with a viability dye. Adjust the tumor–PBMC ratio to the desired density in T cell medium.
- Prepare PBMCs by pelleting, resuspending in fresh medium, and determining viable cell counts. Wash and resuspend PBMCs in T cell medium supplemented with cytokines (e.g., IL-2) and optional immunomodulatory antibodies (e.g., anti-PD-1) as required.
- Perform the co-culture:
- Combine dissociated tumor cells and PBMCs at the desired effector: target ratio. Wash anti-CD28-coated wells before adding cells, avoiding well drying.
- Plate the organoid–PBMC mixture at the required assay volume and incubate under standard culture conditions. Refresh or split cultures as needed during the experiment.
- Experimental design and controls (for treatment strategy):
- Use the co-culture system to evaluate how drugs (e.g., checkpoint inhibitors or small molecules) modulate PBMC responses to tumor organoids.
- Include biological replicates (multiple organoid lines and PBMC donors) and technical replicates (at least triplicate wells per condition).
- Include controls: organoid only, PBMC only (vehicle or activated), organoid + PBMCs (vehicle), organoid + drug, and PBMC + drug conditions.
- Typical co-culture timepoint frameworks:
- Analyze co-cultures at 24, 48, and 72 h post-initiation to assess immune activation, proliferation, cytokine secretion, apoptosis, and tumor cell killing.
- Assess early activation markers and cytokine secretion at 24 h, and evaluate cytotoxicity, proliferation, and activation/exhaustion markers at 48–72 h using flow cytometry, imaging, or viability assays.
NOTE: Later time points (e.g., days 5–7) may be included to assess chronic activation, immune exhaustion, or long-term drug responses.
- Immunofluorescence staining of organoids:
- Wash the slides in PBS for 5 min and fix them in a 4% paraformaldehyde (PFA) solution for 20 min at RT. After fixation, wash the slides in PBS twice for 5 min each.
NOTE: Keep organoids hydrated throughout staining. Slides may be stored in PBS at RT for up to 3 h if needed, but avoid overnight storage in PBS. - Permeabilize organoids with 0.1–0.5% Triton X-100 in PBS for 15–20 min at RT to enable intracellular and nuclear staining while preserving organoid structure.
NOTE: Avoid over-permeabilization, as it can disrupt organoid structure. Proper permeabilization ensures uniform cytoplasmic and nuclear staining while preserving morphology for imaging. - Wash slides twice with 1x IF buffer and block with 1–10% BSA (or species-matched serum) in IF buffer for 60–120 min at RT to reduce non-specific staining.
NOTE: BSA is suitable for general blocking, but species-matched serum is recommended for specific marker staining to reduce non-specific binding and improve signal specificity. - Wash slides three times (5 min each) and incubate with primary antibodies (10–50 µg/mL) in 1% serum blocking buffer overnight at 4 °C in a humidified chamber.
NOTE: Cover slides with parafilm to prevent evaporation and optimize primary antibody concentration by titration for specific staining with minimal background. - Wash slides in 1x IF for 3 x 5 min.
NOTE: Washing should be optimized for individual antibody staining. If using more than one primary antibody concurrently, then washing should be standardized. - Incubate organoid slides with fluorophore-conjugated secondary antibodies (1:200–1:500 in 1% serum blocking buffer) in a humidified chamber overnight at 4 °C or for 2 h at RT in the dark.
NOTE: After adding the secondary antibody, perform all subsequent steps in the dark to prevent photobleaching of the fluorophores. - Wash slides with 1x IF buffer (2x 5 min) followed by PBS (5 min). Incubate with DAPI (1 µg/mL) and AlexaFluor-594-conjugated antibodies (20 µg/mL) in 5% serum blocking buffer for 1 h at RT in the dark, then wash with PBS (3x 5 min).
- Add mounting medium to the slides and coverslip, then invert the coverslip onto the slide while avoiding air bubbles. Alternatively, if using DAPI-containing mounting medium, skip DAPI staining. Use a hard-mounting medium for slide scanning applications.
- Allow slides to dry at RT for an hour, store at –20 °C, and image using confocal microscopy or a slide scanner.
- Wash the slides in PBS for 5 min and fix them in a 4% paraformaldehyde (PFA) solution for 20 min at RT. After fixation, wash the slides in PBS twice for 5 min each.
4. Flow cytometry and intracellular staining protocol for organoids
- Carefully aspirate the organoid culture medium and gently wash the organoids once with 1x PBS to remove residual medium and serum proteins. Release organoids from the extracellular matrix using cold PBS or recovery solution and gently pipette to disrupt the matrix while minimizing shear stress.
- Transfer the organoid suspension to a centrifuge tube, pellet at 300 x g for 5 min at 4 °C, and discard the supernatant. Resuspend the organoid pellet in 250–500 µL of 0.05% TrypLE solution for enzymatic dissociation. Incubate at 37 °C for efficient digestion of cell–cell junctions.
NOTE: Every 5 min, gently mix the suspension by tapping and pipetting up and down, and monitor under a microscope until a single-cell suspension is achieved without over-digestion. - Pass the cell suspension through a 40 µm cell strainer to remove clumps. Centrifuge cells at 300 x g for 5 min at 4 °C and resuspend in 1x PBS without Ca2+ / Mg2+ buffer.
- Count cells and adjust to ~1 x 10⁶ cells/mL in staining buffer. Incubate with Fc block (1:200) and viability dye (e.g., Live/Dead Blue, 1:1000–1:3000) to reduce non-specific binding and identify live/dead cells.
- Incubate cells for 30 min at RT in the dark, then wash once with 1x PBS and once with staining buffer.
- Prepare the surface-antibody cocktail by mixing each antibody at its optimized working dilution in staining buffer and calculating total volumes using the titrated µL/test values for the master mix.
NOTE: If your panel contains multiple polymer-based fluorochromes (e.g., Brilliant Violet, Brilliant Ultraviolet, or Brilliant Blue dyes), include Brilliant Stain Buffer (BSB) in the antibody cocktail to reduce fluorochrome interactions and improve signal resolution. Add BSB according to the manufacturer’s instructions (typically 1x final concentration), mix gently, and prepare a master mix for all samples (~10% extra volume). Protect from light and keep on ice until use. - Add the antibody cocktail and incubate for 30–50 min at RT in the dark. Wash with staining buffer and PBS (without Ca2⁺/Mg2⁺), then centrifuge at 500 x g for 5 min. Prepare working fixation/permeabilization solution by diluting the concentrate with the diluent. For example, 1 part Concentrate: 3 parts diluents (making 1x or specified working strength).
- Add fixation/permeabilization solution to fully resuspend cells (~100–200 µL per 1 million cells) and incubate for 15–20 min at RT or 2–8 °C, protected from light. After fixation time, wash the cells with 1x Permeabilization Buffer. Discard supernatant. Repeat wash at least once (sometimes twice) to remove excess fixative.
- Prepare an intracellular staining cocktail by diluting fluorescently conjugated antibodies to optimized concentrations in 1x permeabilization buffer. Add the intracellular antibody cocktail to permeabilized cells, including antibodies targeting cytokines, transcription factors, or phosphorylated proteins, as required.
- Incubate cells for 2 h at RT in the dark.
NOTE: If needed, incubation can be shortened to the manufacturer’s minimum recommendation or performed overnight at 4 °C in the dark without affecting staining quality. - Wash cells twice with 1x permeabilization buffer and once with staining buffer, then resuspend the pellet in 250–300 µL staining buffer.
- Pass the suspension through a 40 µm strainer to obtain a single-cell suspension and keep samples on ice or at 4 °C, protected from light, until analysis. Avoid prolonged storage of stained samples and acquire samples on the cytometer as soon as possible after staining.
- Use a flow cytometer with appropriate lasers and filters matching the fluorophores. Set up compensation controls, including single-stained samples and fluorescence-minus-one (FMO) controls.
- Acquire at least 50,000–100,000 events per sample for robust statistical analysis. Analyze data using FlowJo, FCS Express, or equivalent software. Gate on live, single cells. Analyze surface and intracellular marker expression.
NOTE: Titrate each antibody–fluorochrome conjugate using serial dilutions to identify the optimal concentration that provides maximum signal, minimal background, and clear population separation.
5. Annexin V–based apoptosis analysis by flow cytometry:
- Essential controls and reagents:
- Unstained control: Establishes the baseline of cellular autofluorescence, allowing discrimination of true positive signal from background.
- Single-stain controls: Required for every fluorochrome in the panel to enable proper compensation (conventional cytometry) or spectral unmixing (spectral cytometry). These ensure accurate signal separation across channels.
- Fluorescence-minus-one (FMO) controls: Essential for defining gates of dim or transitional populations. They help prevent overestimation of weakly positive events.
- Positive control for apoptosis: A sample deliberately induced to undergo apoptosis (e.g., staurosporine-treated cells) validates that the assay reliably detects apoptotic events.
- Isotype controls: Not useful for Annexin V itself, since binding is phospholipid-specific rather than antibody-mediated. However, they can be included for additional surface marker antibodies if needed.
NOTE: Use Annexin V binding buffer containing calcium ions, as Annexin V binding is calcium-dependent; use a commercial or validated equivalent buffer. - A membrane-impermeant viability dye (e.g., PI, 7-AAD, DAPI, or fixable dead cell dyes) is used to distinguish early apoptotic cells from late apoptotic/necrotic cells. Select a dye compatible with the flow cytometer lasers and fixation conditions.
- Staining procedure:
- Harvest co-cultured cells by centrifuging plates at 500 x g for 5 min. Carefully aspirate and discard the supernatant to remove culture medium and floating debris. Wash cells twice with cold staining buffer (e.g., PBS with 1–2% FBS) to reduce background staining and remove interfering proteins.
- If lineage or subset markers are needed (e.g., CD8 for PBMCs, cancer stem cells marker like Lgr5 in tumor cells), incubate the cells with antibody cocktails for 30–45 min at room temperature on a gentle shaker, protected from light. Surface staining at this stage preserves antigen integrity and enables compartment-specific analysis.
- Wash cells twice: first with cold stain buffer to remove unbound antibodies, followed by Annexin V binding buffer (e.g., BioLegend Cat. No. 422201) to ensure calcium availability. Adjust cell concentration to approximately 1 x 10⁶ cells/mL in binding buffer.
- Add 5 µL of fluorochrome-conjugated Annexin V reagent to 100 µL of cell suspension per sample. The chosen fluorochrome should be spectrally compatible with other dyes in the panel.
- Counterstain with a viability dye such as PI, 7-AAD, or DAPI. For PI and DAPI, optimal dilutions typically range from 1:1000 to 1:60,000, depending on the instrument and laser strength, and should be empirically determined. Fixable viability dyes are preferable if downstream fixation is required.
- Gently resuspend cells by pipetting up and down and incubate for 20–40 min at RT in the dark. The optimal incubation time should be determined empirically, as excessive incubation may increase nonspecific binding or false positives.
- Add 200 µL of Annexin V binding buffer to each well (minimum of 100 µL if samples are highly concentrated). This provides sufficient volume for flow cytometry and maintains buffer conditions during acquisition. Acquire samples promptly on a calibrated flow cytometer, ensuring that voltage settings are optimized to clearly resolve negative and positive populations.
- Recommended gating strategy:
- Use forward scatter (FSC) vs side scatter (SSC) plots to eliminate small debris and large aggregates, retaining only intact cells. Apply FSC-A vs FSC-H (or FSC-W) gating to remove doublets and aggregates, ensuring only single cells are analyzed.
- Based on the viability dye, exclude strongly positive dead cells if appropriate. Alternatively, include the dye in the Annexin V analysis quadrants. Use surface markers to distinguish PBMCs (e.g., CD45+) from tumor cells (e.g., EpCAM+ or another tumor-specific marker). This allows compartment-specific quantification of apoptosis.
- Within each gated compartment, plot Annexin V vs viability dye to generate four populations: a) Annexin V− / Dye− = Viable cells; b) Annexin V+ / Dye− = Early apoptotic cells; c) Annexin V+ / Dye+ = Late apoptotic or necrotic cells; d) Annexin V− / Dye+ = Primary necrotic cells or artifacts (to be interpreted cautiously).
- Further subdivide PBMCs into subsets (e.g., CD4 T cells, CD8 T cells, NK cells, monocytes) to examine apoptosis profiles in specific immune populations.
6. ELISPOT assay for T-cell monitoring in organoid co-cultures (3 days):
- On Day 0, wash the pre-coated PVDF-membrane 96-well plate and activate it. Store at 4 °C for 24 h according to the ELISpot protocol kit for the detection of the antibody/cytokine of interest.
- On Day 1,
- Make the organoids into a single cell suspension as described in section 3.5. Centrifuge at 500 x g for 5 min at RT, then resuspend in CTL media (provided with the CTL ELISpot kit). Thaw the cryopreserved PBMCs or use the fresh isolated PBMCs. Centrifuge PBMCs at 500 x g for 5 min at RT.
- Resuspend PBMCs in kit media. Perform co-culture by gently mixing organoid single cells with PBMCs at a 5:1 ratio. Add 200 µL/well of co-culture mixture to each well of preactivated 96-well assay plate. Tap the plate very carefully. Incubate for 4 h at 37 °C. After 4 h, gently take out the assay plate from the incubator. Add treatments to designated wells while including appropriate positive and negative controls.
NOTE: The organoid: PBMC ratio must be optimized for optimal cytokine spot development and scanning results.
- On Day 2,
- After 24 h incubation, follow the manufacturer’s staining protocol. Consider control for single-color and dual color to detect and compare the number of cells secreting the specified markers. The incubation time varies by color, and spot development should be monitored regularly. Scan the plate following the manufacturer’s instructions. Plot and compare the secreted immune spots.
NOTE: Based on experimental design and markers of interest, the relationship between cells plated and spots indicates the expression of the cytokine/antibody in single- or dual-color.
- After 24 h incubation, follow the manufacturer’s staining protocol. Consider control for single-color and dual color to detect and compare the number of cells secreting the specified markers. The incubation time varies by color, and spot development should be monitored regularly. Scan the plate following the manufacturer’s instructions. Plot and compare the secreted immune spots.
7. Real-time apoptosis detection using Annexin V NIR and live-cell imaging (3 days):
Combined with automated live-cell imaging, Annexin V NIR enables real-time, high-throughput monitoring of apoptotic cell death for drug response and cytotoxicity analysis.
- On Day 0, make the organoids into a single-cell suspension. Stain the cells with a GFP cell tracer. Seed the stained single cells in 100 µL complete medium per well. Allow cells to attach and form clusters.
NOTE: Use 96 U-bottom, ultra-low attachment plates. Typical starting densities (adjust empirically): 5,000 cells/well, 10,000 cells/well. Include wells for untreated negative control, vehicle control, and any experimental treatments (in triplicate or more). - On Day 1, thaw cryopreserved PBMCs or use freshly isolated PBMCs. Centrifuge PBMCs at 500 x g for 5 min at RT. Resuspend PBMCs in expansion media supplemented with IL-2 and incubate them in the incubator.
- On Day 2, stain the PBMCs with yellow cell tracer dye. After staining, resuspend the PBMCs in RPMI. Take out the organoid media from the plate very gently. Perform co-culture by gently mixing organoid single cells with PBMCs at a 1:5 ratio. Add 200 µL RPMI media containing PBMCs to each well of the co-culture mixture. Tap the plate very carefully and place it in the incubator.
NOTE: Avoid disturbing the organoid single cells at the bottom of the wells. - Incubate for 2–4 h at 37 °C. After 4 h, gently remove the plate from the incubator.
- Prepare drug wells with appropriate positive and negative controls. Reconstitute the lyophilized Annexin V NIR reagent in 100 µL complete medium or PBS, mix gently. Prepare 2x treatment medium containing Annexin V NIR at twice the final working concentration (e.g., 1:100 for a 1:200 final dilution) and ensure the medium contains ≥1 mM Ca2⁺.
- Add 1:200 dilution of Annexin V NIR into the wells. Place the plate in a live-cell imaging incubator for the next 48–72 h.
NOTE: The organoid: PBMC ratio must be optimized to ensure sufficient cell-cell interactions and measurable apoptotic responses. - Live-cell imaging and analysis
- Use a 4x or 10x objective and acquire images in the NIR channel for Annexin V NIR (plus additional channels if multiplexing). Scan the plate every 4–6 h for 24–72 h, depending on treatment duration.
- Use live-cell imaging software such as the IncuCyte CX3. For basic quantification, analyze the NIR channel using total area or object count; for single-cell kinetics, use the Cell-by-Cell or Object analysis modules. If multiplexing (e.g., Cell tracer yellow and GFP), check spectral unmixing notes.
Results
To start, we generated tumor organoids from specimens from several patients using a standardized workflow (Figure 1). These PDOs typically require 2 weeks of establishment, after which they can be expanded and passaged for further research. It should be noted that establishment time and organoid generation vary across tissues. For example, some tissues need additional time to generate the organoids, and some organoids need more time to reach the appropriate confluency to be passaged. The organoids’ media supplements may be adjusted accordingly.
Next, we used the protocol described herein (Figure 2) to establish an organoid-T cell co-culture. PBMCs from the patient's peripheral blood were isolated as described, then expanded. The tumor: lymphocyte ratio should be optimized, as ratios outside this range may yield different results. A lower ratio may limit the extent of interactions between organoids and T cells.
To assess the functionality of the co-culture system, we have conducted parallel immunofluorescence imaging of organoids and co-culture to compare Ki67 and cleaved caspase-3 as proliferation and apoptosis biomarkers, respectively (Figure 3). The viability and functionality of the co-culture were demonstrated by Annexin V and DAPI staining. To distinguish T cells from organoids, immune cells and organoids were first stained as described and analyzed by flow cytometry (Figure 4A). After treatments, co-cultures were stained with Annexin V and DAPI and measured using flow cytometry. The Cell Trace markers allow for separate measurement of T cell (Figure 4B) and organoids (Figure 4C) apoptosis.
Immune biomarkers CD107a and CD137 were also evaluated using flow cytometry (Figure 5A). Both markers typically indicate T cell activation or degranulation. In this study, after co-culture, T cell reactivity can be evaluated by CD107a and CD137 expression (Figure 5 B,C). A live-cell imaging system was subsequently used to monitor the apoptosis of PDO-T cell co-cultures during treatment. The qualitative (Figure 6A) and quantitative (Figure 6B) analyses show organoid apoptosis under different conditions over a 33-h period. The IncuCyte CX3 platform was used to continuously monitor interactions between tumor organoids and PBMCs. Scanning time can be set for the desired time point after any treatment.
An Immunospot assay was conducted to quantify secretion of Granzyme B and Perforin cytokines in organoid co-culture treated with drug A and anti-PD-1, in monotherapy and combination, for 24 h. We used ELISpot double color for CRC PDO co-culture (Figure 7). It is important to note that the ratio of organoids to lymphocytes can yield distinct cytokine profiles.
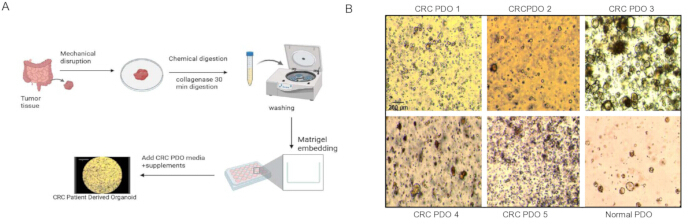
Figure 1. Establishment of CRC tumor organoids. (A) Graphical procedure of tumor organoid establishment. (B) Representative established patient-derived organoids. (4X) magnification images of established PDO cultures during normal growth (acquired with Echo Revolve utilizing phase contrast microscopy). Scale bar = 200 µm. This figure has been modified from Mohammadi M et al. 19. Please click here to view a larger version of this figure.
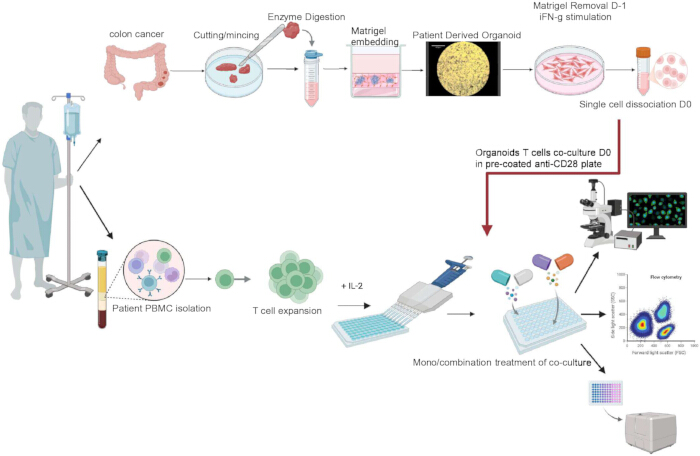
Figure 2. Graphical procedure of tumor organoid and immune cells co-culture and downstream analysis. Tumor organoids are established in parallel with immune cell isolation and expansion. Single-cell suspensions of tumor organoids and immune cells are co-cultured at defined ratios. After 24 h, the co-cultures are treated. Downstream analyses are performed as described in this protocol. Please click here to view a larger version of this figure.
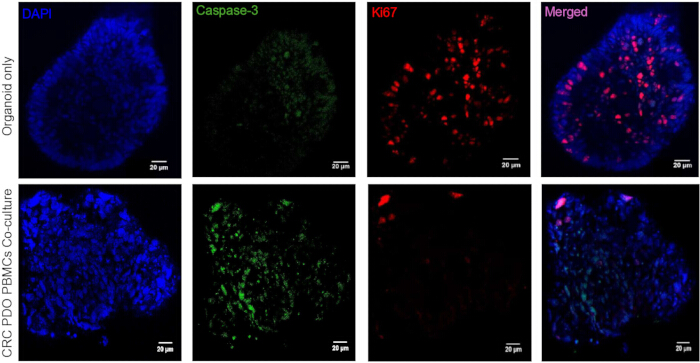
Figure 3. Comparison of organoids and co-culture after 24 h. Confocal microscopy was performed to assess Ki67 (proliferation) and cleaved caspase-3 (apoptosis) markers with 40X magnification. The organoids were plated and co-cultured with autologous immune cells. They were also stained with DAPI for nuclear visualization. Scale bar = 20 µm. Please click here to view a larger version of this figure.
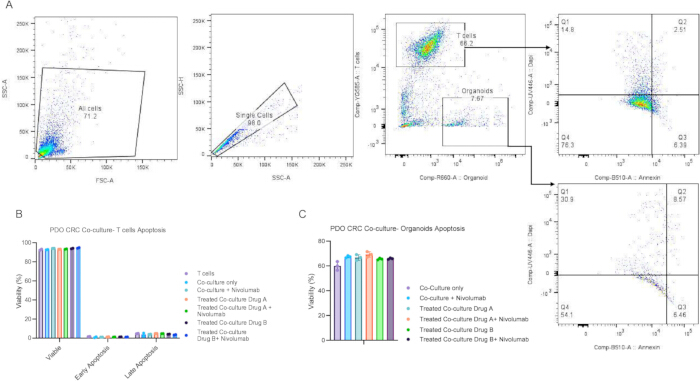
Figure 4. Quantification of apoptosis in co-cultures using an apoptosis flow cytometry assay. (A) Flow cytometry gating strategy showing labeling of tumor cells with CellTrace Far Red and T cells with CellTrace Far Yellow. The Annexin V vs DAPI plots show the viability in T cells and organoids after 48 h. (B) Quantification of T cell viability across different treatment conditions. (C) Quantification of tumor organoid apoptosis across different treatment conditions. The experiment was performed in triplicate. Drug A and Drug B were evaluated as targeted therapies alone and in combination with anti-PD-1 (nivolumab). Please click here to view a larger version of this figure.
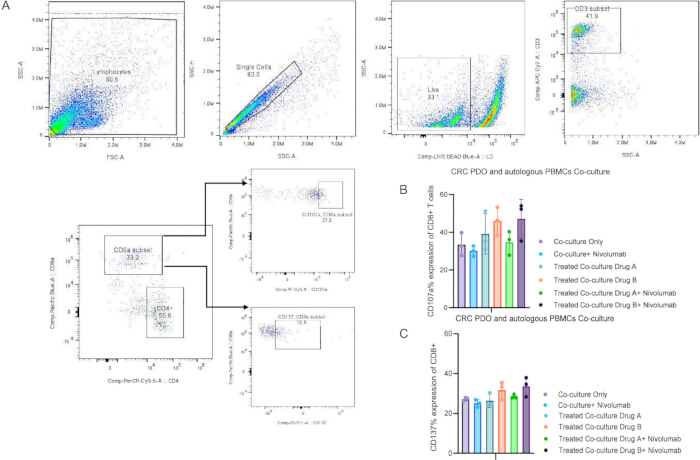
Figure 5. Evaluation of immune markers in CRC organoid-immune cell co-culture. (A) Flow cytometry gating strategy to detect CD8+ T cells expressing the T cell activation markers CD107a and CD137. (B) Comparison of CD107a expression levels of CD8+ T cells from co-cultures across different treatment groups. (C) Comparison of CD137 expression levels of CD8+ T cells from co-cultures across different treatment groups. Drug A and Drug B were evaluated as targeted therapies alone and in combination with anti-PD-1 (nivolumab). The experiment was conducted in triplicate. The bar graph shows the mean percentage with SD for markers in different groups (p = 0.0023 through one-way ANOVA). Please click here to view a larger version of this figure.
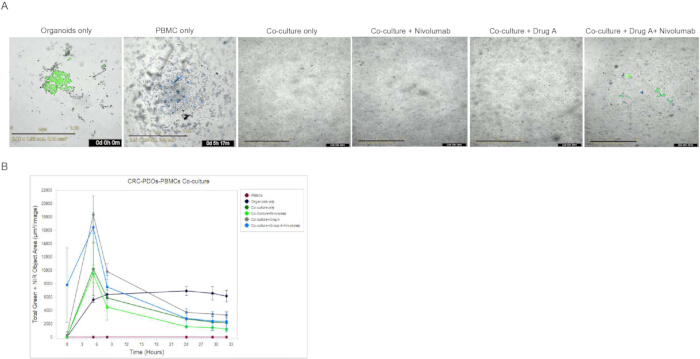
Figure 6. Live-cell imaging analysis of CRC organoid-immune cell co-culture. (A) Representative live-cell images (short time-lapse recordings) of tumor organoids and immune cells captured using the IncuCyte CX3 system at Day 0. Tumor organoids are labeled in green, fluorescent dye to distinguish them from peripheral blood mononuclear cells stained with cell trace yellow, fluorescent dye (PBMCs; blue). (B) Quantification of tumor organoid apoptosis during co-culture under different treatment conditions. Apoptotic cell death was monitored using the Annexin V Near-Infrared (NIR) assay during continuous live-cell imaging over a 33-h period. Scale bar = 1 mm. Please click here to view a larger version of this figure.
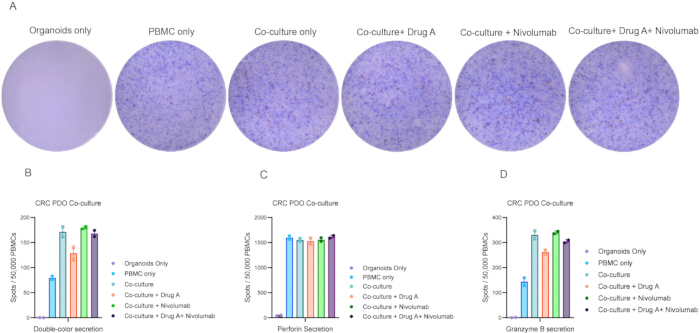
Figure 7. Representative ELISpot results for cytokine quantification (granzyme B and Perforin) in CRC organoid-immune cell co-culture. (A) Representative immune-assay imaging and developing human Granzyme B (red) and perforin (blue) secretions by stimulating and treating effector cells after 24 h of co-culture. (B) Double-color (Perforin in blue and Granzyme B in red) secretions. (C) Perforin secretion per condition. (D) Granzyme B secretion per condition. The assay was performed in duplicate. Scanning and counting were performed using a CTL analyzer, and the data were plotted in GraphPad Prism. Please click here to view a larger version of this figure.
| Number | Buffer/reagent | Procedure | Comments |
| 1 | CRC PDO media | Thaw L-WRN, grow for the specified time to achieve confluency, collect the media, and add fresh media every day for up to 12-14 days. Add Advanced DMEM to the collected media, filter and supplement immediately after filtering with GLUTAMAX I, HEPES, [LEU15]-Gastrin I Human, B-27 (serum-free), N2, Penicillin-Streptomycin, and N-Acetylcysteine | On the starting day of the experiment, add the second set of supplements to the organoid culture media: A83-01, SB202190, EGF, nicotinamide, and PGE2. Add Y-27632 and Primocin during the first week after thawing and passaging.Store at -80 °C. |
| 2 | Organoid washing medium | Add Primocin at 1:500, Gentamicin at 1:200, 1% Penicillin/streptomycin, and Amphotericin at 1:100 in PBS | |
| 3 | T cell thawing medium | Supplement RPMI-1640 with 1% Penicillin/streptomycin and 10% FBS | |
| 4 | T cell growth medium | Add 10% human serum albumin and 1% Penicillin/streptomycin to RPMI-1640. | Store the medium at 4 °C for no longer than 1 month |
| 5 | T cell expansion medium | Supplement the T cell growth medium with 500 IU/mL IL-2 and CD3/CD28 cocktail. | Prepare Freshly |
| 6 | Freezing medium | Make 10% DMSO in FBS | |
| 7 | Coating buffer | Add 1% BSA and 15 mM HEPES to Advanced DMEM/F12 | Store the buffer at 4 °C for up to 3 months |
| 8 | FACS buffer | Add 1% FBS to PBS | Store at 4 °C |
| 9 | IF buffer | Add 0.2% Triton X-100 and 0.05% Tween-20 to PBS | Store at 4 °C |
| 10 | Blocking buffer | Add 1% bovine serum albumin (BSA) to IF buffer | Store at 4 °C |
Table 1: Reagent preparation. Composition and preparation of buffers, media, staining solutions, and supplements used for colorectal cancer patient-derived organoid culture, PBMC isolation and expansion, organoid–immune cell co-culture, flow cytometry, immunofluorescence, ELISpot, and live-cell imaging assays are described in this protocol.
Discussion
In this protocol, a tractable, reproducible method for generating PDOs and expanded T cells from our biobank repository was described. The PDO CRC co-culture setup for our patient samples with different mutations, along with the treatment regimen were also described in detail. The results obtained demonstrated the effect of treatment on co-culture models.
The organoid co-culture system described here provides a robust, adaptable platform for modeling complex biological interactions in vitro. By integrating PBMCs with matched patient-derived organoids, this protocol better recapitulates organoid signaling dynamics and functional heterogeneity than conventional 2-D cell culture. Unlike earlier approaches with lower reproducibility or limited viability, our method optimizes culture conditions to maintain both organoid integrity and T cell activity for the desired time points20,21. A key strength of this protocol is its flexibility. It can be applied to diverse organoid types, including intestinal, hepatic, and lung models, and supports co-culture with a range of immune cells13,14,20,21,22,23. This adaptability enables researchers to tailor the method to their specific biological questions, from dissecting host–pathogen interactions to evaluating therapeutic responses in a patient-specific context13,20,24,25. Furthermore, the workflow is compatible with downstream analyses, including transcriptomics, metabolomics, and imaging, thereby expanding its utility for mechanistic and translational studies26,27.
These protocols are highly applicable across diverse areas of cancer immunology, translational oncology, and personalized medicine13,20,21. The organoid–immune co-culture platform provides a physiologically relevant and scalable system for studying patient-specific tumor–immune interactions, evaluating immunotherapies and targeted treatments, and identifying biomarkers of response or resistance13,14,20,21. By integrating functional assays such as flow cytometry, ELISpot, and live-cell imaging, these methods enable comprehensive analysis of immune activation, cytotoxicity, and tumor behavior13,14,20,21. The use of three-dimensional patient-derived organoids further enhances translational relevance by preserving tumor heterogeneity and microenvironmental features, making these protocols valuable tools for preclinical drug testing and next-generation immunotherapy development13,14,20.
Despite their advantages, organoid models still have limitations. Organoid establishment efficiency varies depending on tumor type, sample quality, and prior treatment history, particularly in heavily pretreated tumors20,21. In addition, organoids often lack key tumor microenvironment components such as fibroblasts, vasculature, and stromal signaling14,20,21. Although co-culture systems improve modeling of tumor–immune interactions, maintaining immune cell viability and function in vitro remains challenging13,14,20,21. Variability in culture conditions and extracellular matrices across laboratories also limits standardization and reproducibility14,20,21.
Future advances in organoid research will focus on integrating fibroblasts, endothelial cells, microbiota, and autologous immune cells to better mimic the tumor microenvironment and improve personalized immunotherapy testing28. Emerging organ-on-chip systems and CRISPR/Cas9-based engineering will further enhance disease modeling, functional studies, and therapeutic screening. Standardization through biobanking initiatives is expected to improve scalability, reproducibility, and clinical translation. Overall, this protocol provides a reproducible, physiologically relevant platform for studying organoid–immune interactions and supports translational and precision oncology research.
Disclosures
C.K. reports the following disclosures, all of which are unrelated to this manuscript: Loki Therapeutics (research funding), Teiko (consultant), Seattle Genetics (consultant), Insights Driven Research (consultant), BMS (consultant), Guardant Health (consultant), OMNI Oncology (consultant), Exelixis (consultant), Nuvectis Pharma (consultant, drugs), Real CME (Honoraria). C.K. and N.T. are co-inventors on U.S. Provisional Application 63/746,435 filed January 17, 2025, which is unrelated to this manuscript. The remaining authors have no disclosures to report.
Acknowledgements
This work was supported by the Montefiore Einstein Comprehensive Cancer Center CCSG (P30CA013330). We thank Hillary Guzik, Rotem Alon, Jinghang Zhang, Swathi Swaminathan, and Jacky Chuen for technical assistance. Flow cytometry studies were performed using a Cytek Aurora analyzer funded by the National Institutes of Health (1S10OD026833-01) at the Albert Einstein College of Medicine Flow Cytometry Core Facility. Confocal imaging was conducted using a Leica STELLARIS 8 microscope funded by the NIH (1S10OD034397-01) at the Albert Einstein College of Medicine Analytical Imaging Facility. E.N., W.E., and C.K. were supported by NIH grants T32CA200561, R01CA248536, R42CA287679, and K12CA279871. The funders had no role in the preparation of the manuscript.
We also acknowledge The Ruth L. and David S. Gottesman Institute for Stem Cell and Regenerative Medicine Research for MM, NS and NT.
Materials
| Name | Company | Catalog Number | Comments |
|---|---|---|---|
| Chemicals, Reagents, and Antibodies | |||
| B27 supplement without vitamin A | GIBCO | C12587-010 | |
| B27 supplement | GIBCO | 17504-044 | |
| N-Acetylcysteine | Sigma-Aldrich | A9165-5G | |
| Nicotinamide | Sigma-Aldrich | N0636 | |
| Human recombinant EGF | Peprotech | AF-100-15 | |
| N2 | Gibco | 17502001 | |
| A83-01 | Tocris | 2939 | |
| SB202190 | Cayman Chemicals | 10010399 | |
| Prostaglandin E2 | Cayman Cehmicals | 14010-1 | |
| Y-27632 | Sigma-Aldrich | Y-0503 | |
| Collagenase type II | Sigma-Aldrich | C6885 | |
| Hyaluronidase type IV | Sigma-Aldrich | H3506 | |
| Advanced DMEM-F12 | GIBCO | 12634-028 | |
| Penicillin/streptomycin | GIBCO | 15070063 | |
| Ultraglutamine type I | Lonza | BE17-605E | |
| HEPES | GIBCO | 15630-056 | |
| TrypLE Express | GIBCO | 12604-013 | |
| Recovery Cell Culture Freezing Medium | GIBCO | 12648-010 | |
| RPMI 1640 | GIBCO | 11875093 | |
| Human serum, from human male AB plasma | Sigma-Aldrich | H3667 | |
| Benzonase | Merck | 70746-3 | |
| Human recombinant interferon gamma | Peprotech | 300-02 | |
| Dispase type II | Sigma-Aldrich | D4693 | |
| Cell Recovery Solution | Corning | 354253 | |
| Invivogen Primocin | Invivogen ANTPM1 | NC9141851 | |
| Recombinant Human IL-2 (E. coli expressed, carrier-free) | Biolegend | 791906 | |
| Recombinant Human IL-7 (E. coli expressed, carrier-free) | Biolegend | 569706 | |
| Recombinant Human IL-15 (carrier-free) | Biolegend | 570306 | |
| PE/Cyanine5 anti-human CD107a (LAMP-1) | Biolegend | 328656 | |
| Brilliant Violet 711™ anti-human CD137 (4-1BB) | Biolegend | 309832 | |
| Pacific Blue™ anti-human CD8a Antibody | Biolegend | 300928 | |
| anti-human CD3-APC/Cy7 | Biolegend | 317342 | |
| anti-human CD4PerCP/Cyanine5.5 anti-human CD4 | Biolegend | 980810 | |
| Alexa Fluor® 647 anti-human/mouse Granzyme B | Biolegend | 515406 | |
| anti-human CD56-PE/Cy7 | Biolegend | 985912 | |
| PE/Dazzle™ 594 anti-human IFN-γ Antibody | Biolegend | 506530 | |
| PE anti-human CD274 (B7-H1, PD-L1) | Biolegend | 393608 | |
| Purified anti-human CD28 Antibody | Biolegend | 302901 | |
| Brilliant Violet 510™ anti-human CD45 Antibody | Biolegend | 304036 | |
| Mouse anti-human CD326 (EpCAM) (PE/Cy7-conjugated) | Biolegend | 324222 | |
| anti-Ki67 | Abcam | ab15580 | |
| NucView® 488 Caspase-3 Assay Kit for Live Cells | Biotium | 30029 | |
| FITC Annexin V Apoptosis Detection Kit with PI | Biolegend | 640914 | |
| PE/Cyanine7 Annexin V | Biolegend | 640950 | |
| Incucyte® Annexin V NIR Dye | Sartorious | 4768 | |
| LIVE/DEAD™ Fixable Blue Dead Cell Stain Kit, for UV excitation | Invitrogen | L23105 | |
| Cell Trace Far Yellow | Thermo Fischer | C34567 | |
| Cell Trace Far red | Thermo Fischer | C34564 | |
| Green CMFDA | MedChem Express | HY-126561 | |
| Human TruStain FcX™ (Fc Receptor Blocking Solution) | Biolegend | 422302 | |
| Brilliant Stain Buffer | BD Biosciences | 563794 | |
| BD Pharmingen™ Stain Buffer (BSA) | BD Biosciences | 554657 | |
| Compensation Beads | Biolegends | 424602 | |
| Corning® Dulbecco’s Phosphate-Buffered Saline, 1X without calcium and magnesium | Corning | 20-031-CM | |
| Corning® Dulbecco’s Phosphate-Buffered Saline, 1X with calcium and magnesium | Corning | 20-030-CV | |
| Anti-human PD1 antibody (nivolumab) | Merus/Selleckchem | A2002 | |
| Dimethyl sulfoxide | Fisher Scientific | BP231-100 | |
| DMEM | Genesee | 25-500 | |
| EDTA buffer | Invitrogen | 15575020 | |
| FBS | VWR | 97068-075 | |
| PBS | Genesee | 25-507 | |
| Parafolmaldehyde (PFA) | Thermo Scientific Chemicals | 0473779L | |
| Fixation/Permeabilization Solution Kit | BD | 554714 | |
| Gastrin I HUMAN | Millipore | G9145-.1MG | |
| GLUTAMAX I | Fisher Scientific | 35050061 | |
| CD3/CD28 cocktail | STEMCELL Technologies | 10971 | |
| Immunocult Expansion Media | STEMCELL Technologies | 10981 | |
| ProLong Diamond Antifade Mountant with DAPI | Invitrogen | P36962 | |
| Triton X-100 | Thermo Scientific Chemicals | 215680025 | |
| Trypan blue solution, 0.4% | Gibco | 15250061 | |
| Tween-20 | TCI America | T0543500G | |
| Equipments | |||
| Flow Cytometer/Flow Cytometry Core | Cytek (Wuxi) Biosciences | Model No. N7-0021 | |
| Flow Cytometer/Singh Lab | Invitrogen | ATTUNE NXT (Model no. 4486517 | |
| Confocal Microscope | Leica | STELLARIS 8 | |
| Live-cell analysis system | Sartorius | Incucyte CX3 |
References
- Cervantes A, et al. Metastatic colorectal cancer: ESMO Clinical Practice Guideline for diagnosis, treatment and follow-up. Ann Oncol. 2023;34(1):10-32.
- Colonna G. Overcoming barriers in cancer biology research: current limitations and solutions. Cancers (Basel). 2025;17(13):2102.
- Liu Y, et al. Patient-derived xenograft models in cancer therapy: technologies and applications. Signal Transduct Target Ther. 2023;8(1):160.
- Rocha Neto J, Gaspar MM, Reis CP. Experimental murine models for colorectal cancer research. Cancers (Basel). 2023;15(9):2570.
- Bleijs M, van de Wetering M, Clevers H, Drost J. Xenograft and organoid model systems in cancer research. EMBO J. 2019;38(15).
- Hou X, et al. Opportunities and challenges of patient-derived models in cancer research: patient-derived xenografts, patient-derived organoids and patient-derived cells. World J Surg Oncol. 2022;20(1):37.
- Tentler JJ, et al. Patient-derived tumour xenografts as models for oncology drug development. Nat Rev Clin Oncol. 2012;9(6):338-50.
- Drost J, Clevers H. Organoids in cancer research. Nat Rev Cancer. 2018;18(7):407-18.
- Zeng G, et al. Advancing cancer research through organoid technology. J Transl Med. 2024;22(1):1007.
- Jin MZ, et al. Organoids: an intermediate modeling platform in precision oncology. Cancer Lett. 2018;414:174-80.
- Dart A. Organoid 2.0. Nat Rev Cancer. 2019;19(3):126-7.
- Cattaneo CM, et al. Tumor organoid-T-cell coculture systems. Nat Protoc. 2020;15(1):15-39.
- Neal JT, et al. Organoid modeling of the tumor immune microenvironment. Cell. 2018;175(7):1972-88.e16.
- Bar-Ephraim YE, Kretzschmar K, Clevers H. Organoids in immunological research. Nat Rev Immunol. 2020;20(5):279-93.
- Jang J, et al. Redefining preclinical testing: human-relevant alternatives beyond animal models. BMB Rep. 2025; in press.
- Xie BY, Wu AW. Organoid culture of isolated cells from patient-derived tissues with colorectal cancer. Chin Med J (Engl). 2016;129(20):2469-75.
- Vlachogiannis G, et al. Patient-derived organoids model treatment response of metastatic gastrointestinal cancers. Science. 2018;359(6378):920-6.
- Ooft SN, et al. Patient-derived organoids can predict response to chemotherapy in metastatic colorectal cancer patients. Sci Transl Med. 2019;11(513).
- Mohammadi M, et al. Cyclin-dependent kinase 9 inhibitors as oncogene signaling modulators in combination with targeted therapy for the treatment of colorectal cancer [Preprint]. bioRxiv. 2025:2025.08.13.669992. doi:10.1101/2025.08.13.669992.
- Guo L, et al. Toward reproducible tumor organoid culture: focusing on standardization. Front Immunol. 2024;15:1290504.
- Wang J, et al. Tumor organoid-immune co-culture models: exploring a new frontier in cancer research. Cell Death Discov. 2025;11:98.
- Najafi M, et al. Organoid-immune co-cultures: a next-generation platform for studying human immunology and disease. Trends Immunol. 2026;47(1):45-62.
- Kakni P, et al. A microwell-based intestinal organoid-macrophage co-culture system to study intestinal inflammation. Biomaterials. 2022;276:121018.
- Meirelles LA, Persat A. Decoding host-microbe interactions with engineered human organoids. EMBO J. 2025;44(6):1569-73.
- Ryu JO, et al. Applications and research trends in organoid-based infectious disease models. Sci Rep. 2025;15:7816.
- Du L, et al. Spatial omics in 3D culture model systems. Nat Rev Bioeng. 2025;3(1):45-67.
- Lombardi M, et al. Organoid models through the lens of metabolomics. Analyst. 2026;151(4):1458-78.
- Skardal A, et al. Drug compound screening in single and integrated multi-organoid body-on-a-chip systems. Biofabrication. 2020;12(2):025017.
Reprints and Permissions
This article has been published
Video Coming Soon