This protocol describes a tunable actin comet-tail bead motility assay to quantitatively investigate how myosin motor activity influences branched actin assembly and network architecture at a membrane-like interface.
Method Article
Reconstituting Myosin-I-Mediated Branched Actin Assembly in a Bead-Based Actin Comet-Tail Motility Assay
In This Article
Summary
Abstract
Branched actin polymerization mediated by the actin-related protein 2/3 (Arp2/3) complex provides the primary pushing forces for a variety of cellular processes, including cell migration, endocytosis, and phagocytosis. Myosin-I motors, which frequently colocalize with branched actin networks at the cell leading edge, have also been shown to participate in these processes and are thought to regulate actin network organization and mechanical output. However, the molecular mechanisms by which myosin-I interacts with the Arp2/3 complex to modulate branched actin assembly and force generation remain largely unknown. Here, we describe a highly tunable in vitro actin comet-tail bead motility assay that reconstitutes the interplay among myosin-I, actin, and the Arp2/3 complex at the cell leading edge on the surface of micron-sized beads. This method is adapted from well-established actin comet-tail assays by co-immobilizing myosin-I with nucleation-promoting factors (NPFs) on bead surfaces, thereby creating a membrane-like actin assembly interface. The assay enables visualization and quantitative analysis of actin network assembly, network density, bead motility, and growth efficiency. It also provides indirect, qualitative readouts of myosin-I-mediated force enhancement in branched actin networks. This protocol includes bead functionalization, reaction assembly, fluorescence imaging, quantitative image analysis, and troubleshooting strategies providing a reproducible platform for studying myosin-I-regulated actin assembly at membrane-like interfaces.
Introduction
Branched actin polymerization mediated by the actin-related protein 2/3 (Arp2/3) complex generates the primary protrusive forces that drive diverse cellular processes, including cell motility, endocytosis, phagocytosis, and the formation of cell adhesion complexes1,2,3,4,5,6. At the leading edge of migrating cells, nucleation-promoting factors (NPFs) activate the Arp2/3 complex at the plasma membrane, initiating dendritic actin network assembly that pushes the membrane forward. Myosin-I motors frequently colocalize with these branched actin networks at membrane interfaces and have been implicated in regulating actin organization and modulating force generation7,8,9,10,11,12,13. Despite accumulating evidence that myosin-I contributes to actin-dependent mechanical processes, the molecular mechanisms by which myosin-I interacts with Arp2/3-mediated branched actin assembly to modulate network architecture and mechanical output remain poorly understood.
To address this gap, we incorporated myosin-I into the well-established actin comet-tail bead motility system14,15,16,17 to reconstitute the interplay among myosin-I, actin, and the Arp2/3 complex on the surface of micron-sized beads. The overall goal of this method is to quantitatively investigate how myosin-actin coupling influences branched actin assembly, network architecture, symmetry breaking, and bead motility at a membrane-like interface. In this assay, myosin-I and NPFs are co-coated onto microscale beads to mimic their colocalization at the plasma membrane18. Upon initiation of polymerization, surface-bound NPFs stimulate Arp2/3-dependent branched actin assembly, leading to actin-shell formation, symmetry breaking, and the development of a polarized comet tail that drives bead propulsion14,19,20,21,22,23. By systematically varying myosin surface density18 and modulating actin network density through capping protein (CP) concentration15,19,24, this method enables quantitative analysis of actin assembly kinetics, growth efficiency, network architecture, and bead motility, providing indirect readouts related to myosin-I-dependent changes in mechanical output.
The assay also offers distinct advantages over complementary approaches. Compared with bulk polymerization assays, such as pyrene-actin assays, this bead motility system enables direct visualization of branched actin assembly and actin polymerization-driven bead movement. In contrast to cellular studies, where overlapping protein functions and complex cellular environments can obscure individual contributions and complicate interpretation, this assay provides precise control over protein composition, concentration, and surface organization, thereby enabling systematic investigation of how myosin-I interacts with Arp2/3-mediated actin assembly under defined biochemical conditions.
This method is most appropriate for studying how cytoskeletal components coordinate at a membrane-like interface to regulate actin network architecture and mechanical output. Although the current protocol is optimized for myosin-I-mediated branched actin assembly, its modular design may be adapted in the future to examine other membrane-associated myosin classes (e.g., myosin VI, VII, X, XV, and XIX) and/or actin-binding proteins (e.g., formins, vasodilator-stimulated phosphoprotein (VASP), cortactin, coronin, or tropomyosin). Such adaptations would require validation of protein immobilization, activity, and surface density. In addition, the assay is amenable to pulse-chase labeling strategies. Incorporating photoconvertible or photoactivatable actin, or labeled Arp2/3 subunits, could enable measurement of filament turnover and branch dissociation rates within the growing network25. Overall, this assay provides a versatile platform for examining the molecular interplay among membrane-associated motors, actin filaments, and actin-binding proteins, as well as for probing how motors and actin-binding proteins regulate network remodeling and force generation at membrane-like interfaces14,15,26,27,28,29,30,31,32,33,34. More broadly, it also serves as a minimal, tunable active matter platform for investigating the physical principles underlying motor-driven nonequilibrium dynamics, such as symmetry breaking, self-organization, mechanochemical feedback, and other emergent behaviors in active actomyosin networks18,19,20,21,22,23,35,36, with potential relevance to active matter physics and materials engineering.
Protocol
This protocol was developed by incorporating myosin-I into the well-established actin comet-tail bead motility system14,15,16,17 to mimic and investigate the role of myosin-I in modulating branched actin assembly and force generation at the leading edge. It is intended to complement the original primary research article (Xu et al.18) by providing the experimental details, analysis workflow, troubleshooting strategies, and limitations required to reproduce and adapt the assay. This protocol uses full-length biotinylated Drosophila Myo1d because it functions optimally at 20°C–22°C37,38, the temperature commonly used in most in vitro reconstitution assays. A detailed description of the myosin biotinylation and purification procedures can be found in previous studies18,38,39,40.
1. Buffer preparation
- Prepare X buffer for neutravidin and NPF coating of beads with 10 mM 4-(2-hydroxyethyl)-1-piperazineethanesulfonic acid (HEPES; pH 7.5), 100 mM KCl, 1 mM MgCl₂, 100 µM CaCl₂, and 1 mM adenosine triphosphate (ATP).
- Prepare M buffer for myosin coating of beads with 20 mM HEPES (pH 7.5), 100 mM KCl, 1 mM MgCl₂, 1 mM ethylene glycol-bis(β-aminoethyl ether)-N,N,N′,N′-tetraacetic acid (EGTA), and 2 mM ATP.
- To prepare X buffer or M buffer, first prepare a HEPES stock solution adjusted to pH 7.5 at room temperature. Add KCl, MgCl₂, CaCl₂ (for X buffer) or EGTA (for M buffer), followed by ATP, and then bring the buffer to the final volume with double-distilled water.
- Filter the buffer through a 0.22 µm syringe filter before use. Degassing is not required for routine bead-coating experiments. Keep the filtered buffer on ice until use.
NOTE: Always prepare buffers containing ATP or dithiothreitol (DTT) fresh for optimal results. Store freshly prepared X buffer and M buffer on ice for up to 3–4 days.
- Prepare a 100 mg/mL bovine serum albumin (BSA) stock solution in double-distilled water for blocking. Filter the solution through a 0.22 µm syringe filter, aliquot 50 µL per tube, and store the aliquots at −80°C. Use aliquots within 3–6 months and avoid repeated freeze-thaw cycles.
- Prepare the bead storage buffers.
- Prepare the control bead storage buffer by diluting the 100 mg/mL BSA stock solution 100-fold with X buffer to obtain 1 mg/mL BSA in X buffer.
- Prepare the myosin bead storage buffer by diluting the 100 mg/mL BSA stock solution 100-fold with M buffer to obtain 1 mg/mL BSA in M buffer.
- Prepare 2× motility buffer containing 40 mM HEPES (pH 7.5), 200 mM KCl, 2 mM MgCl₂, 2 mM EGTA, and 0.4% methylcellulose (viscosity: 1500 cP). Store the buffer at 4°C for up to 1 month. Mix gently before use to ensure homogeneity and avoid introducing bubbles.
CAUTION: Handle all chemicals according to institutional laboratory safety procedures. Wear appropriate personal protective equipment during buffer preparation.
2. Bead preparation
NOTE: Coat carboxylate polystyrene beads (2.0-µm diameter) with NPFs and neutravidin following previously published protocols14,15,16,17, with modifications for myosin coating18. Use glutathione S-transferase (GST)-tagged WCA domain from human neuronal Wiskott–Aldrich syndrome protein (N-WASP) as the NPF (GST-VCA). The protocol below is designed to prepare 50 µL of bead slurry and can be scaled to 100–200 µL as required.
- Neutravidin and NPF coating
- Prepare a 50 µL NPF and neutravidin coating mixture by mixing 5 µL of GST-VCA (1 mg/mL), 10 µL of neutravidin at the desired concentration, and 35 µL of X buffer. Mix gently by pipetting up and down 5–10 times while avoiding bubble formation.
NOTE: Use the following reference neutravidin concentrations to obtain different myosin-to-NPF coating ratios18: 8.3 µM (0.5 mg/mL) for a myosin:NPF molar ratio of 0.28:1; 16.7 µM (1 mg/mL) for a myosin:NPF molar ratio of 0.35:1; 33.3 µM (2 mg/mL) for a myosin:NPF molar ratio of 0.43:1; and 83.3 µM (5 mg/mL) for a myosin:NPF molar ratio of 0.80:1. Select the neutravidin concentration according to the desired myosin-to-NPF coating ratio. For standard comet-tail motility experiments, use the 0.43:1 myosin-to-NPF ratio, which provides robust myosin coating while maintaining sufficient NPF density for Arp2/3-dependent actin assembly. Lower ratios (0.28:1 or 0.35:1) can be used to evaluate lower myosin surface densities, whereas the 0.80:1 ratio can be used to examine higher myosin loading. Because increasing the neutravidin concentration can alter both myosin recruitment and the effective NPF surface density, validate the coating ratio by sodium dodecyl sulfate–polyacrylamide gel electrophoresis (SDS-PAGE) (See section 2.3) or fluorescence-based surface-density measurements when adapting the assay to new protein preparations or experimental conditions. - Transfer 5 µL of bead slurry to a microcentrifuge tube. Wash the beads with 10 µL of X buffer by pipetting at least five times. Pellet the beads by centrifugation at 16,000 × g for 2 min at 4°C. Carefully remove the supernatant by tilting the tube and aspirating from the side opposite the bead pellet.
- Resuspend the washed beads in 50 µL of the coating mixture. Mix the suspension by gentle pipetting and leave a small air bubble in the suspension to facilitate mixing during incubation. Incubate the beads on a benchtop rotator at 20 rpm for 2 h at 4°C. Pellet the beads by centrifugation at 16,000 × g for 2 min at 4°C and carefully remove the supernatant containing excess neutravidin and GST-VCA.
- Resuspend the coated beads in 200–400 µL of 10 mg/mL BSA prepared by diluting the 100 mg/mL BSA stock solution in X buffer. Incubate the suspension on ice for 30 min to block unoccupied binding sites on the bead surface. Pellet the beads by centrifugation at 16,000 × g for 2 min at 4°C and carefully remove the supernatant.
- Resuspend the beads in 50 µL of 1 mg/mL BSA prepared in X buffer. Pellet the beads by centrifugation at 16,000 × g for 2 min at 4°C, carefully remove the supernatant, and repeat the wash twice.
NOTE: After the coating reaction, gently resuspend the beads by pipetting up and down 5–7 times while avoiding bubble formation. The bead suspension should appear well dispersed, with no visible aggregates or clumps. Do not use bead preparations showing extensive aggregation, poor resuspension, or obvious bead loss, as these conditions can result in uneven coating and reduced assay reproducibility. - Store the coated beads in 1 mg/mL BSA prepared in X buffer on ice. Use the coated beads within one week.
NOTE: Store the coated beads on ice in 1 mg/mL BSA prepared in X buffer for up to one week before proceeding to fluorescent labeling or myosin decoration. Before use, gently resuspend the beads by pipetting and visually inspect the suspension for aggregation, poor resuspension, or obvious bead loss. Do not use bead preparations showing extensive aggregation or poor recovery after storage.
- Prepare a 50 µL NPF and neutravidin coating mixture by mixing 5 µL of GST-VCA (1 mg/mL), 10 µL of neutravidin at the desired concentration, and 35 µL of X buffer. Mix gently by pipetting up and down 5–10 times while avoiding bubble formation.
- Fluorescent labeling and biotinylated myosin decoration
- Exchange the storage X buffer with M buffer before myosin coating.
- Divide 50 µL of neutravidin-NPF-coated beads equally into two microcentrifuge tubes (25 µL per tube).
- Pellet the beads by centrifugation at 16,000 × g for 2 min at 4°C and carefully remove the supernatant. Wash the beads with 25 µL of 1 mg/mL BSA prepared in M buffer. Pellet the beads by centrifugation at 16,000 × g for 2 min at 4°C, carefully remove the supernatant, and repeat the wash twice.
- Resuspend the control beads in 25 µL of 1 µM biotin-CF640 fluorescent dye diluted from the stock solution in M buffer.
- Resuspend the myosin beads in 25 µL of 500 nM – 1 µM biotinylated myosin supplemented with 1–5 µM calmodulin.
- Cover the tubes with aluminum foil and incubate the bead suspensions on ice for at least 30 min. Pellet the beads by centrifugation at 16,000 × g for 2 min at 4°C and carefully remove the supernatant containing excess biotinylated myosin or fluorescent dye.
- Wash the decorated beads with 25 µL of 1 mg/mL BSA prepared in M buffer. Pellet the beads by centrifugation at 16,000 × g for 2 min at 4°C, carefully remove the supernatant, and repeat the wash twice.
- Store the far-red fluorescent dye decorated beads or myosin-decorated beads in 1 mg/mL BSA prepared in M buffer on ice. Supplement the myosin-decorated beads with 1–5 µM calmodulin and protect all decorated beads from light by covering the tubes with aluminum foil. Use the far-red fluorescent dye–decorated beads within one week and the myosin-decorated beads within 2–3 days.
NOTE: Use 500 nM – 1 µM biotinylated myosin for bead decoration. Select the working concentration according to the desired myosin surface ratio and the activity of the myosin preparation. For standard bead motility experiments, use 1 µM biotinylated myosin to promote robust myosin decoration under the coating conditions described above. Lower concentrations, such as 500 nM, may be used when reducing myosin surface density or when testing new protein preparations. Verify the final myosin surface density by SDS-PAGE (See section 2.3), fluorescence-based measurements, or comparison with previously calibrated coating conditions when adapting the assay. Include calmodulin in molar excess over myosin to maintain myosin-I lever-arm occupancy during bead decoration. For standard experiments, use 1–5 µM calmodulin together with 500 nM – 1 µM myosin. Use the higher end of this range when using higher myosin concentrations. The optimal calmodulin concentration may need to be adjusted for different myosin-I isoforms or protein preparations. The usable storage time of myosin-decorated beads may vary depending on the retained activity of the immobilized myosin molecules. Best performance is usually obtained when the beads are used immediately after coating. Store decorated beads on ice, protected from light, until use. Before using stored decorated beads, gently resuspend the bead suspension by pipetting up and down 5–7 times and inspect a small aliquot by light or fluorescence microscopy. Suitable bead preparations should remain well dispersed, show minimal aggregation, and retain detectable, relatively uniform fluorescence when fluorescent labels are present. Small clusters containing three to five beads are acceptable; however, preparations showing extensive aggregation, poor resuspension, weak fluorescence, obvious bead loss, or excessive bead adhesion to the tube should not be used. For myosin-decorated beads, verify assay performance by comparison with a previously validated bead preparation because storage can reduce the activity of immobilized myosin molecules. Bead preparations that no longer show the expected differences between myosin-coated and control beads should not be used.
- Exchange the storage X buffer with M buffer before myosin coating.
- Determination of myosin-to-NPF coating ratio
- Transfer 20 µL of bead slurry from each bead type (control and myosin beads) into separate microcentrifuge tubes. Pellet the beads by centrifugation at 16,000 × g for 2 min at 4°C and carefully remove the supernatant. Wash the beads with 25 µL of M buffer. Pellet the beads by centrifugation at 16,000 × g for 2 min at 4°C, carefully remove the supernatant, and repeat the wash once to remove BSA from the storage buffer.
NOTE: Adequate removal of BSA is achieved by performing two sequential washes with M buffer and carefully removing the supernatant after each centrifugation step without disturbing the bead pellet. If residual BSA contamination is suspected, perform an additional M buffer wash before adding SDS sample buffer. Avoid bead preparations with poor pellet recovery or excessive bead loss, as inconsistent bead recovery can affect the accuracy of the myosin coating ratio determined by SDS-PAGE. - Resuspend the washed beads in 20 µL of 1× Laemmli sample buffer. Boil the samples for 5 min. Pellet the beads by centrifugation for 15 s in a benchtop microcentrifuge. Store the samples at −20°C until gel electrophoresis.
NOTE: Store the prepared bead samples at −20°C until ready for electrophoresis. - Prepare the BSA standard series by mixing 5 µL of 2 mg/mL BSA standard with 5 µL of 2× sample buffer. Boil the mixture for 5 min. Dilute the mixture 20-fold with 1× sample buffer to obtain a final concentration of 50 ng/µL.
- Load 1 µL of the diluted BSA standard to obtain 50 ng of total protein.
- Load 2 µL of the diluted BSA standard to obtain 100 ng of total protein.
- Load 5 µL of the diluted BSA standard to obtain 250 ng of total protein.
- Load 10 µL of the diluted BSA standard to obtain 500 ng of total protein.
- Load 20 µL of the diluted BSA standard to obtain 1,000 ng of total protein.
- Prepare the neutravidin, GST-VCA, and myosin standards by mixing 5 µL of each 1 mg/mL protein solution with 5 µL of 2× sample buffer to obtain a final concentration of 0.5 mg/mL. Boil the samples for 5 min and load 2 µL of each sample to obtain 1 µg of protein per lane.
- Load the samples onto a 4%–20% gradient polyacrylamide gel.
- Load 5 µL of the prestained protein ladder.
- Load 2 µL of the 0.5 mg/mL neutravidin standard.
- Load 2 µL of the 0.5 mg/mL GST-VCA standard.
- Load 2 µL of the 0.5 mg/mL myosin standard.
- Load 20 µL of each bead sample into separate lanes.
- Load the BSA standards prepared in Steps 2.3.3.1–2.3.3.5.
- Run the gel in 1× SDS-PAGE running buffer at 110 V for 30 min.
CAUTION: Methanol and acetic acid used in the destaining solution are flammable and corrosive. Handle these reagents using appropriate personal protective equipment and institutional laboratory safety procedures. - Stain the gel with Coomassie Brilliant Blue for 10 min with gentle rocking. Destain the gel overnight in a solution containing 10% methanol and 7.5% acetic acid. Acquire gel images using a gel imaging system.
NOTE: For densitometric analysis, acquire images using exposure settings that keep all protein bands within the linear detection range. Avoid overexposed images in which the myosin, NPF, or standard protein bands appear saturated. When possible, use an automatic exposure mode optimized to avoid saturation, or acquire multiple exposure times and use the shortest exposure that clearly resolves all relevant bands without saturated pixels. Use the same imaging settings for all gels that will be quantitatively compared. - Quantify band intensities using image analysis software (Fiji/ImageJ) and the Gel Analysis tool.
- Open the gel image in Fiji. If necessary, convert the image to 8-bit grayscale by selecting Image > Type > 8-bit.
- If necessary, invert the image so that protein bands appear as peaks by selecting Edit > Invert.
- Use the rectangular selection tool to draw a region of interest (ROI) around the first lane, ensuring that the ROI includes the full vertical region containing the relevant bands. Select Analyze > Gels > Select First Lane.
- Move the same rectangular ROI to the next lane and select Analyze > Gels > Select Next Lane. Repeat this procedure for all BSA standards, purified protein standards, and bead samples using the same ROI size.
- After all lanes have been selected, generate intensity profiles by selecting Analyze > Gels > Plot Lanes.
- Use the straight-line tool to define the baseline for each peak, then use the wand tool to select the peak area corresponding to each band of interest. Record the integrated peak area for each band.
- Perform background correction by drawing the baseline consistently for each lane using the local background immediately adjacent to the peak while avoiding neighboring bands or uneven gel regions. Apply the same baseline and peak-selection criteria to all standards and bead samples.
- Generate a standard curve using the BSA standards corresponding to 50, 100, 250, 500, and 1,000 ng of total protein per lane.
- Plot the background-corrected integrated peak area versus total BSA mass and perform linear regression using spreadsheet or graphing software.
- Verify that the standard curve shows strong linearity (R2 > 0.98) without obvious saturation or plateauing of the highest-intensity bands.
- If the standard curve is nonlinear or if any quantified bands are saturated, reacquire the gel image using a shorter exposure or repeat the gel using a lower sample load.
- Use the calibration curve to determine the myosin-to-NPF coating ratio.
- Determine the total protein amount in the bead samples and purified protein standards by interpolation within the linear range of detection.
- Calculate the corresponding myosin-to-NPF coating ratio for each bead type.
- When establishing new coating conditions or modifying the protocol, perform measurements using replicate bead preparations or replicate gels.
- For routine experiments, compare the measured coating ratio with previously validated preparations.
- Repeat the coating or quantification if the measured ratio falls outside the expected range or if replicate measurements are inconsistent.
- Transfer 20 µL of bead slurry from each bead type (control and myosin beads) into separate microcentrifuge tubes. Pellet the beads by centrifugation at 16,000 × g for 2 min at 4°C and carefully remove the supernatant. Wash the beads with 25 µL of M buffer. Pellet the beads by centrifugation at 16,000 × g for 2 min at 4°C, carefully remove the supernatant, and repeat the wash once to remove BSA from the storage buffer.
3. Actin comet-tail bead motility assay
- Standard bead motility assay
- Prepare actin from rabbit skeletal muscle acetone powder according to the published purification protocol41. Purify monomeric globular actin (G-actin) by size-exclusion chromatography using a Sephacryl S-300 column equilibrated with G-buffer containing 2 mM Tris-HCl (pH 8.0), 0.2 mM ATP, 0.1 mM CaCl₂, 1 mM NaN₃, and 0.5 mM DTT. Store the purified G-actin on ice at 4°C and use it within 2–3 weeks.
- Purify the Arp2/3 complex from bovine brain according to the published protocol42. Divide the purified protein into single-use aliquots, flash-freeze the aliquots, and store at −80°C.
- Express and purify human CapZ according to the published protocol43. Divide the purified protein into single-use aliquots, flash-freeze the aliquots, and store at −80°C.
- Purify calmodulin according to the published protocol44. Aliquot the purified protein and store the aliquots at −20°C.
NOTE: Assess the quality of purified Arp2/3 complex, CP (CapZ), and calmodulin before use. Evaluate protein purity by Coomassie-stained SDS-PAGE. Acceptable preparations should exhibit the expected major protein bands with minimal degradation or contaminating bands. Determine protein concentration by measuring the absorbance at 280 nm or by using a standard colorimetric protein assay (e.g., Bradford assay) with freshly thawed aliquots. Do not use protein aliquots showing visible precipitation, repeated freeze–thaw cycles, or substantial degradation on SDS-PAGE. For activity assessment, Arp2/3 complex activity can be verified by its ability to promote NPF-dependent actin assembly in a pyrene-actin polymerization assay or by robust branched actin comet-tail formation in the bead motility assay. CapZ activity can be assessed by its ability to modulate actin filament growth and comet-tail morphology in the bead assay, or by a barbed-end capping assay when needed. Calmodulin quality is assessed by SDS-PAGE and by its ability to support myosin-I activity in motility assays. When using a new protein preparation, compare assay performance with a previously validated preparation before using it for quantitative experiments. - Prepare a 50 µL motility mixture containing 4 µM G-actin (including 5%–10% fluorescently labeled G-actin), 200 nM Arp2/3 complex, 6.5–200 nM CP, 2 µM calmodulin, and 3 µL bead slurry (1.5 µL myosin-coated beads and 1.5 µL control beads) in a final buffer containing 20 mM HEPES (pH 7.5), 100 mM KCl, 1 mM MgCl₂, 1 mM EGTA, 1 mM MgATP, 40 mM DTT, 10 mg/mL BSA, and 0.2% methylcellulose.
- Add 25 µL of 2× motility buffer.
- Add 6 µL of double-distilled water.
- Add 2 µL of 1 M DTT.
- Add 1 µL of 50 mM ATP.
- Add 1 µL of 50 mM MgCl₂.
- Add 5 µL of 100 mg/mL BSA.
- Add 1 µL of 100 µM calmodulin.
- Add 1 µL of 10 µM Arp2/3 complex.
- Add 1 µL of 325 nM–10 µM CP.
- Add 3 µL of bead slurry containing 1.5 µL myosin-coated beads and 1.5 µL control beads.
NOTE: Mix the motility mixture gently by slowly pipetting up and down 3–5 times. Avoid vortexing, rapid pipetting, or introducing bubbles, as these can disrupt protein complexes and affect actin polymerization. - Initiate the reaction by adding 4 µL of 50 µM G-actin containing 5%–10% fluorescently labeled G-actin. Mix immediately and designate this time point as t = 0.
NOTE: After G-actin addition and mixing, load the reaction chamber and begin image acquisition as quickly as possible. For reproducible kinetic measurements, start imaging within 1–2 min after t = 0 and no later than 3 min after reaction initiation. Record the actual delay between G-actin addition and the start of imaging and account for this delay when plotting time-dependent comet-tail growth.
- Chamber preparation
- Clean glass slides and coverslips with 70% ethanol followed by deionized water. Plasma-clean the glass surfaces with ambient air plasma for 10 min.
- Immediately after preparing the motility mixture, apply 2.3 µL of the reaction mixture to a glass slide. Place a 22 mm × 22 mm coverslip over the sample to form a squeeze chamber with an approximate chamber height of 4.3 µm. Seal the chamber with vacuum grease and begin imaging immediately.
NOTE: Chamber height is controlled by using a fixed sample volume and a 22 mm × 22 mm coverslip, which produce a reproducible thin chamber when the sample spreads evenly across the coverslip area. The approximate chamber height can be estimated from the sample volume divided by the coverslip area and may also be verified empirically by measuring the z-distance between the slide and coverslip surfaces using fluorescent beads or surface-bound fluorescent markers. Use the same sample volume, coverslip size, and chamber assembly procedure for all experiments to maintain consistent chamber geometry. Before imaging, inspect the chamber visually and under the microscope. The sample should fill the central imaging region evenly without large air bubbles, incomplete spreading, or obvious leakage. Do not image regions near air bubbles, vacuum grease edges, or areas where the coverslip appears unevenly seated. Prepare a new chamber if the sample does not spread evenly, contains large air bubbles, or shows substantial drift caused by leakage or poor sealing.
CAUTION: Handle plasma-cleaning equipment according to institutional laboratory safety procedures. Follow appropriate precautions when handling glass slides and coverslips to minimize the risk of injury.
- Bead motility assay with disrupted myosin power stroke
- Pre-incubate G-actin stored in G-buffer containing 2 mM Tris-Cl (pH 8.0), 0.2 mM ATP, 0.5 mM DTT, 0.1 mM CaCl₂, and 1 mM NaN₃ with 200 µM EGTA and 50 µM MgCl₂ for 5 min on ice to convert G-actin to Mg-G-actin before use.
- Prepare a 50 µL motility mixture for calcium experiments by replacing calmodulin with 1.1 mM CaCl₂ to disrupt the myosin power stroke.
- Add 25 µL of 2× motility buffer.
- Add 6 µL of double-distilled water.
- Add 2 µL of 1 M DTT.
- Add 1 µL of 50 mM ATP.
- Add 1 µL of 50 mM MgCl₂.
- Add 5 µL of 100 mg/mL BSA.
- Add 1 µL of 55 mM CaCl₂.
- Add 1 µL of 10 µM Arp2/3 complex.
- Add 1 µL of 325 nM–10 µM CP.
- Add 3 µL of bead slurry containing 1.5 µL myosin-coated beads and 1.5 µL control beads.
NOTE: Mix the reaction gently until all components are evenly distributed before initiating actin polymerization.
NOTE: The final reaction contains 1.1 mM total CaCl2 and approximately 1.0 mM EGTA, yielding an estimated free Ca2+ concentration on the order of 10−4 M. Based on the excess CaCl2 over EGTA, the free Ca2+ concentration is approximately 100 µM. More precise calcium-buffer calculations using MaxChelator or a similar tool that accounts for EGTA, Mg2+, ATP, pH, and temperature estimate the free Ca2+ concentration to be approximately 80–100 µM. - Initiate the reaction by adding 4 µL of 50 µM Mg-G-actin containing 5–10% fluorescently labeled G-actin. Mix immediately and designate this time point as t = 0.
- Prepare the imaging chamber as described in Step 3.1.6.
- Microscope imaging
- Acquire fluorescence images at 25°C using an epifluorescence microscope equipped with a 100× oil-immersion objective (numerical aperture 1.4), an external metal-halide light source, a charge-coupled device (CCD) camera, and image acquisition software.
- Image fluorescent actin using a rhodamine/TRITC filter set and image far-red fluorescent dye–labeled beads using a Cy5/far-red fluorescence filter set.
- Acquire images in 16-bit mode using 1 × 1 or 2 × 2 camera binning. Keep the camera gain, illumination intensity, exposure time, and filter set identical for all samples that will be quantitatively compared.
NOTE: Before collecting quantitative data, adjust the illumination intensity and exposure time using a representative field of view so that the actin comet-tail signal is clearly detectable but not saturated. Check the image histogram to confirm that the maximum pixel intensity remains below the saturation limit of the camera. Use the lowest illumination intensity and shortest exposure time that provide a sufficient signal-to-noise ratio. Do not compare fluorescence intensities across samples acquired with different exposure times, camera gain, binning, or illumination settings.
- Begin image acquisition immediately after reaction initiation. Acquire time-lapse image sequences from fields containing both myosin-coated and control beads. Identify the control beads using the far-red fluorescence channel.
- Acquire images every 5–15 s for 20 min using an exposure time of 100–200 ms per frame. Compare the comet-tail growth kinetics of myosin-coated and control beads within the same field of view.
NOTE: In most experiments, comet tails elongate at an approximately constant velocity during the first ~10 min after symmetry breaking. Elongation slows as reagents become depleted and typically ceases approximately 30 min after reaction initiation18. - To assess comet-tail morphology independently of early growth dynamics, incubate the motility mixture in a microcentrifuge tube for 15–20 min at room temperature to allow comet tails to develop.
- Apply 2.3 µL of the reaction mixture to a glass slide and assemble a squeeze chamber as described in Step 3.1.6. Image the entire chamber area and acquire representative images containing both myosin-coated and control beads. Identify the control beads using the far-red fluorescence channel and compare comet-tail morphology within the same field of view.
NOTE: For direct comparison, select imaging fields that contain both myosin-coated and control beads, are evenly illuminated, in focus, and are located away from chamber edges, vacuum grease, large air bubbles, or regions with incomplete filling. Exclude beads that are aggregated, overlap with neighboring beads, lie partially outside the field of view, or cannot be reliably segmented because of imaging artifacts or poor focus. Use the same acquisition settings for all fields within an experiment. Before sampling, gently stir the reaction mixture with a clean pipette tip 5–7 times to maintain an even bead distribution. Do not mix by pipetting because vigorous aspiration and dispensing may disrupt the actin comet-tail network or detach the bead from the comet tail. If stabilization of the actin network is required, add phalloidin before sampling15,18. For reactions containing 4 µM actin, add phalloidin to a final concentration of 4 µM, corresponding to an approximately equimolar ratio with actin. Incubate the reaction on ice for 3–5 min, protected from light, before sampling.
- Acquire fluorescence images at 25°C using an epifluorescence microscope equipped with a 100× oil-immersion objective (numerical aperture 1.4), an external metal-halide light source, a charge-coupled device (CCD) camera, and image acquisition software.
4. Quantification analysis of actin comet-tail growth kinetics and network density
NOTE: Analyze and quantify all images using Fiji, an open-source image processing platform based on ImageJ (version 2.16.0/1.54p; https://imagej.net/software/fiji/)45.
- Actin comet-tail growth rate
- Measure the actin comet-tail length at each time point using the Segmented Line tool in Fiji. Manually trace the comet tail from the distal end of the tail to the center of the bead for each image and convert the measured length to micrometers.
- Plot comet-tail length as a function of time. Fit the first 7–10 time points, corresponding to the initial linear growth phase, using linear regression. Determine the comet-tail growth rate from the slope of the fitted line and report the value in µm/s or µm/min.
NOTE: Select the regression window from the early phase in which comet-tail length increases approximately linearly with time. In most experiments, this corresponds to the first 7–10 time points after symmetry breaking or after clear comet-tail elongation begins. Use the same selection criterion for all beads within the same experiment. If growth begins at slightly different times for different beads, define the first point of the regression window as the first time point at which a polarized comet tail is clearly visible and elongating. Include only consecutive time points that show monotonic or near-monotonic tail extension and fit the data by linear regression. The selected regression window should show strong linearity, with no obvious plateau, stall, or abrupt change in growth behavior. Exclude beads from growth-rate analysis if they do not form a clear polarized comet tail, exhibit stalled or highly non-linear growth during the initial measurement window, detach from the comet tail, leave the field of view, overlap with neighboring beads or comet tails, or are affected by poor focus or saturated fluorescence.
- Actin comet-tail network density
- Define the comet-tail ROI using the actin fluorescence channel in Fiji. Apply an intensity threshold that separates comet-tail fluorescence from the local background using Image > Adjust > Threshold. Apply the same thresholding criteria to all control and myosin-coated beads acquired within the same field of view using identical imaging settings. Inspect the thresholded ROI manually and exclude beads for which the comet-tail boundary cannot be clearly distinguished from the background. Measure the mean fluorescence intensity within the comet-tail ROI and designate this value as Icomet.
- Reposition the same ROI to a nearby region lacking comet-tail fluorescence. Measure the mean background intensity and designate this value as Ibackground.
- Calculate the corrected comet-tail intensity (Icorr,comet) using:

- Use Icorr,comet as a proxy for actin network density.
NOTE: Because the comet tail grows and changes shape over time, the comet-tail ROI does not need to have identical dimensions at each time point. Define the ROI using the same thresholding method throughout each experiment, such as the Triangle or Yen auto-threshold method or a manually selected threshold range. For background subtraction, reposition an identical copy of the comet-tail ROI to a nearby region lacking comet-tail fluorescence while avoiding neighboring beads, actin networks, air bubbles, or uneven illumination. Apply the same thresholding method, ROI selection procedure, and background-selection criteria consistently to all samples acquired under identical imaging conditions.
- Actin comet fluorescent assembly rate
- Measure the total integrated fluorescence intensity of the comet-tail ROI at each time point using the same ROI selection procedure described in Step 4.2. Perform background subtraction using an adjacent region lacking comet-tail fluorescence.
- Plot the corrected total integrated fluorescence intensity as a function of time. Fit the first 7–10 time points using linear regression and use the initial slope as the actin fluorescent assembly rate.
NOTE: Under the imaging conditions described above, noticeable photobleaching is typically not observed during time-lapse acquisition, and no photobleaching correction is routinely applied. However, if substantial photobleaching is observed, estimate the bleaching rate from a stable fluorescent reference region or control sample acquired under the same imaging conditions. Normalize the comet-tail fluorescence intensity using the reference decay curve before fitting the initial actin fluorescence assembly rate.
- Actin comet growth efficiency
- Calculate the actin comet growth efficiency by dividing the comet-tail growth rate by the actin fluorescent assembly rate:

- Use this parameter to estimate the distance traveled by the bead per unit of actin assembly as an indicator of how efficiently actin assembly is converted into bead advancement.
NOTE: Calculate growth efficiency for each bead individually before averaging across beads. For each bead, determine the tail growth rate and fluorescence assembly rate from the same initial linear growth window, then calculate the growth efficiency for that bead. Average the individual bead values within each experimental condition, such as control beads and myosin-coated beads. For paired comparisons, compare control and myosin-coated beads acquired within the same field of view because they experience identical reaction and imaging conditions, thereby minimizing field-to-field variability. For quantitative analysis, analyze at least 10–20 beads per condition from each independent experiment when sufficient analyzable beads are available. Repeat the assay using at least three independent bead preparations or experimental days when establishing or comparing assay conditions. Perform image measurements using identical image analysis settings, thresholding criteria, ROI selection procedures, and background-subtraction methods throughout each experiment. The analyses described in Steps 4.1–4.4 were performed manually using the standard image analysis tools without custom macros.
- Calculate the actin comet growth efficiency by dividing the comet-tail growth rate by the actin fluorescent assembly rate:
Results
The actin comet-tail bead motility assay was used to investigate the effect of myosin-I activity on Arp2/3 complex-mediated branched actin assembly at the cell leading edge, recapitulating scenarios in which membrane-associated myosin-I coordinates with actin polymerization to drive membrane protrusion7,8,9,10,11,12,13. To mimic the colocalization of myosin-I and NPFs at the membrane–actin interface, both proteins were co-coated onto the surface of microscale beads, thereby reconstituting their spatial proximity in a controlled in vitro system (Figure 1A,B).
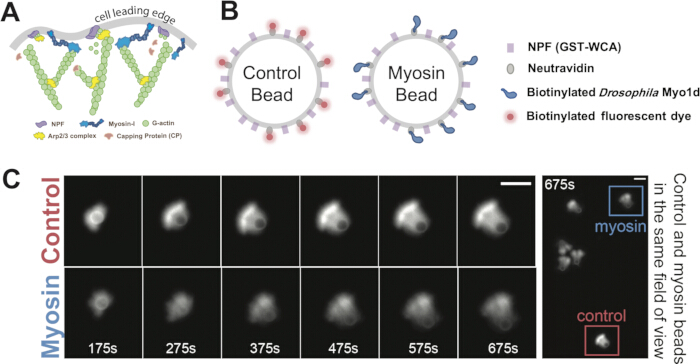
Figure 1. Reconstitution of myosin-I-mediated branched actin assembly on microscale beads. (A) Schematic showing interactions among myosin-I, nucleation-promoting factors (NPFs), the actin-related protein 2/3 (Arp2/3) complex, capping protein (CP), and globular actin (G-actin) at the cell leading edge. (B) Schematic of bead functionalization. Control beads and myosin-coated beads were coated with NPF and neutravidin. Neutravidin was conjugated to either biotinylated far-red fluorescent dye for control beads or biotinylated Drosophila Myo1d for myosin-coated beads. (C) Representative time series showing actin comet-tail growth from symmetry breaking to polarized comet-tail formation for a control bead and a myosin-coated bead. The final panel shows both beads in the same field of view. Scale bar, 5 µm. Panels B and C are reproduced/modified from Xu et al., Science Advances, DOI: 10.1126/sciadv.ado5788 (2024), AAAS, with permission. Please click here to view a larger version of this figure.
To better assess the specific contribution of myosin-I to actin assembly, a corresponding control bead was also constructed. The control beads were identical to the myosin-coated beads except that myosin-I was replaced with a biotinylated far-red fluorescent dye conjugated to neutravidin (Figure 1B). Mixing both bead types within the same reaction chamber and imaging them in the same field of view enabled direct comparison of branched actin assembly in the presence and absence of myosin-I under identical experimental conditions (Figure 1C). Furthermore, by varying the myosin-to-NPF ratio on the bead surface, the effect of myosin-I across different surface densities could be systematically examined (Figure 2A,B). In addition, the actin network density could be tuned by adjusting the concentration of CP, generating networks ranging from densely packed, symmetry-breaking-resistant structures to loosely organized, fracture-prone architectures15,19,24. This approach allowed investigation of how myosin-I influences branched actin assembly across networks of varying density and structural integrity (Figure 2A,B).
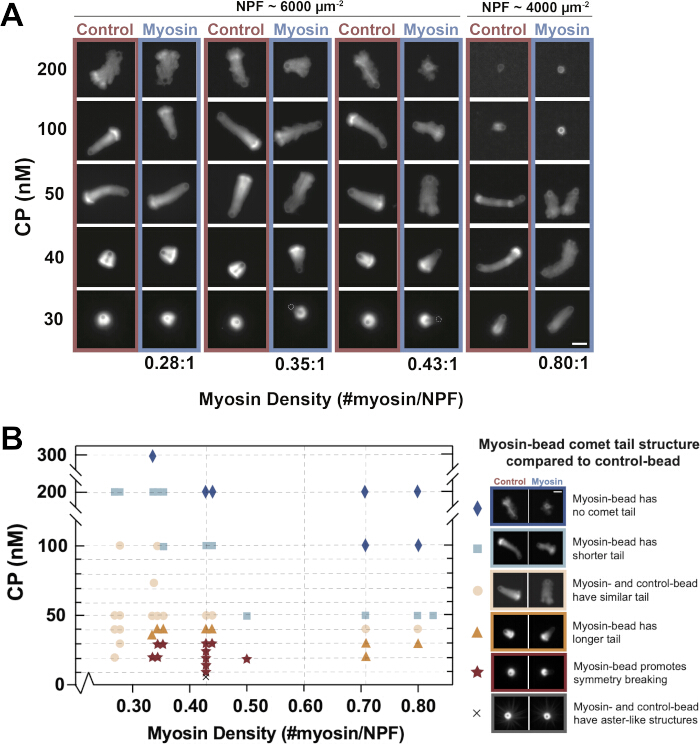
Figure 2. Actin comet-tail morphology across myosin surface densities and capping protein concentrations. (A) Representative fluorescence images of 2-µm-diameter beads coated with different myosin surface densities and assembled in reactions containing 30–200 nM capping protein (CP), 4 µM actin with 5% rhodamine-labeled actin, and 200 nM Arp2/3 complex. For each condition, control beads and myosin-coated beads were imaged in the same field of view. Myosin and nucleation-promoting factor (NPF) surface densities were determined by sodium dodecyl sulfate–polyacrylamide gel electrophoresis, as described in Step 2.3. Images were acquired 20–35 min after reaction initiation. Brightness and contrast were adjusted linearly and identically within each control–myosin bead pair but were scaled independently between conditions for better visualization. Scale bar, 5 µm. (B) Qualitative assay map summarizing comet-tail outcomes across CP concentrations and myosin surface densities. Each data point represents a matched control–myosin bead pair under the indicated condition. Symbols indicate observed outcomes, including myosin-coated beads promoting symmetry breaking, longer tails, similar tails, shorter tails, no comet-tail formation, or aster-like structures. Data were collected from more than 20 independent experiments, with more than 10 bead pairs analyzed for each condition. This figure is reproduced/modified from Xu et al., Science Advances, DOI: 10.1126/sciadv.ado5788 (2024), AAAS, with permission. Please click here to view a larger version of this figure.
Upon mixing the assay components, surface-bound NPFs stimulated Arp2/3 complex-mediated branched actin assembly around the bead surface. In a typical successful reaction, actin first appeared as a sparse shell surrounding the bead. As polymerization proceeded, the shell expanded and the network became more densely entangled. Continued actin assembly at the bead surface drove outward network growth, which could lead to symmetry breaking and the formation of a polarized comet tail. Once a comet tail was established, ongoing actin nucleation and polymerization at the bead surface supported sustained bead movement (Figure 1C). These sequential features of actin shell formation, symmetry breaking, comet-tail extension, and bead propulsion served as visual indicators that the assay was functioning properly.
As reported in our original study18 and illustrated in Figure 2A,B, comet-tail morphology was sensitive to both CP concentration and myosin surface density. Under standard assay conditions (200 nM Arp2/3 complex, 50 nM CP, myosin:NPF ratio = 0.43:1), myosin-coated beads typically produced sparser or more diffuse actin comet tails than control beads (Figure 2A). At low CP concentrations (<30 nM), actin assembled into dense, fracture-resistant shells. Under these conditions, control beads often remained encapsulated and failed to undergo symmetry breaking, whereas myosin-coated beads were more likely to break symmetry and escape from the surrounding actin shell (Figure 2A,B). At high CP concentrations (>200 nM), network cohesion was reduced, and the presence of myosin further destabilized the actin network, promoted actin shedding, and prevented the formation of stable comet tails (Figure 2A,B). These condition-dependent outcomes provide useful benchmarks that researchers can use to identify appropriate assay regimes and troubleshoot assay performance.
The effect of myosin-I on actin comet-tail morphology can be assessed by measuring the mean fluorescence intensity of the comet tail. The comet-tail region was defined using an intensity threshold, as described in Step 4.2, and the mean fluorescence intensity within this region was then measured (Figure 3A). Under matched imaging conditions, in which control and myosin-coated beads were imaged in the same field of view, this value served as a relative, uncalibrated proxy for actin network density, with lower mean intensity indicating a sparser network. Under standard assay conditions, myosin-coated beads typically generated comet tails with lower mean fluorescence intensity than control beads, consistent with reduced apparent network density (Figure 3C).
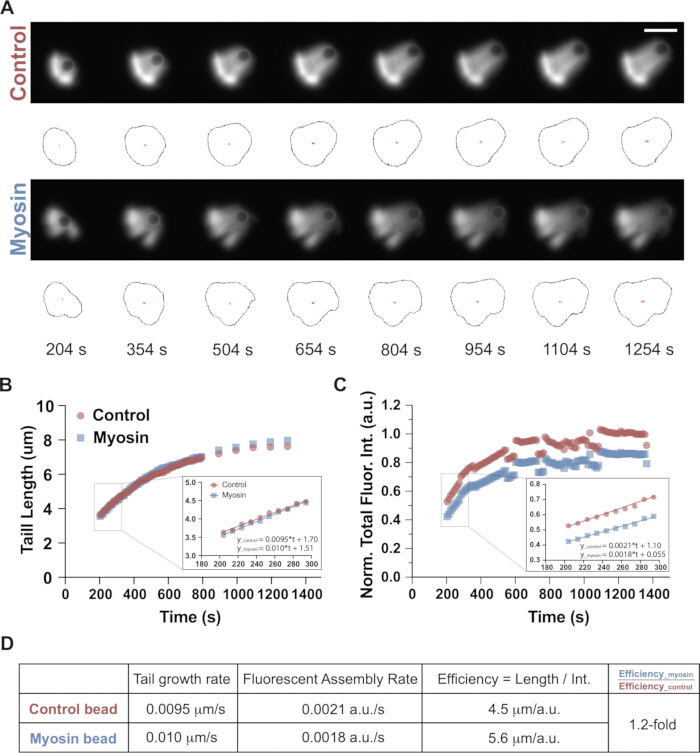
Figure 3. Quantification workflow for actin comet-tail growth kinetics and assembly efficiency. (A) Representative time series of comet-tail growth from a control bead and a 0.43:1 myosin-coated bead in the presence of 50 nM capping protein (CP). Black outlines indicate comet-tail regions of interest (ROIs) identified using Fiji for fluorescence intensity measurements. Reaction conditions: 4 µM actin with 5% rhodamine-labeled actin, 200 nM actin-related protein 2/3 (Arp2/3) complex, and 50 nM CP. Scale bar, 5 µm. (B) Comet-tail length plotted as a function of time for the representative control–myosin bead pair shown in panel (A). The inset shows the time window used for linear fitting, and tail growth rates were determined from the slopes of the fitted lines. (C) Normalized total comet-tail fluorescence intensity plotted as a function of time for the representative control–myosin bead pair shown in panel (A). Control and myosin beads were normalized to the average fluorescence intensity of the control beads between 1100 and 1300 s. The inset shows the time window used for linear fitting, and fluorescence assembly rates were calculated from the slopes of the fitted lines. (D) Summary table showing the tail growth rate, fluorescence assembly rate, and growth efficiency for the representative control–myosin bead pair shown in panel (A). Please click here to view a larger version of this figure.
The effect of myosin-I on comet-tail growth kinetics can be quantified by measuring both comet-tail elongation and actin fluorescence accumulation over time. In most experiments, comet tails grew at an approximately constant velocity during the first ~10 min following symmetry breaking. As polymerization components became depleted, elongation progressively slowed and typically ceased approximately 30 min after reaction initiation. To quantify growth kinetics, comet-tail length and total fluorescence intensity were plotted as functions of time (Figure 3B,C). The first 7–10 data points, corresponding to the initial linear phase, were fitted using linear regression (Figure 3B,C, insets). The slopes of these fits represented the initial tail growth rate and actin fluorescence assembly rate, respectively. Growth efficiency was defined as the comet-tail growth rate divided by the actin fluorescence assembly rate, quantifying how effectively actin polymerization was converted into productive bead displacement (Figure 3D). In the representative example shown in Figure 3A–D, the myosin-coated bead exhibited a tail growth rate of 0.60 µm/min (0.010 µm/s), compared with 0.57 µm/min (0.0095 µm/s) for the control bead (Figure 3B,D). The corresponding growth efficiencies were 5.6 and 4.5 µm/intensity unit, respectively, representing an approximately 1.2-fold higher value for the myosin-coated bead (Figure 3D). Under standard conditions, myosin-coated beads typically exhibited growth rates comparable to those of control beads (myosin: 0.69 ± 0.10 µm/min; control: 0.66 ± 0.20 µm/min), together with a lower actin fluorescence assembly rate (approximately 0.76-fold of control) and an approximately 1.4-fold higher growth efficiency, as reported previously in our original study18. These values are reported as mean ± SD from 11 bead pairs per condition obtained across five independent experiments. Statistical analysis was performed using a two-tailed paired t-test, as described in the original study18.
To assess the contribution of the myosin power stroke and rule out the possibility that the observed effects arose from steric hindrance due to myosin surface occupancy, the bead motility assay can be performed under conditions that disrupt myosin-I power-stroke activity. In this protocol, myosin-I motor activity was inhibited by adding 1.1 mM Ca2+ to the reaction mixture. Elevated Ca2+ promoted dissociation of calmodulin from the myosin-I lever arm, reducing lever-arm rigidity and impairing its ability to generate force46,47,48. Under these conditions, myosin-I remained dynamically associated with actin but did not support actin gliding (Figure 4A,B), providing a useful control for evaluating motor activity-dependent effects18.
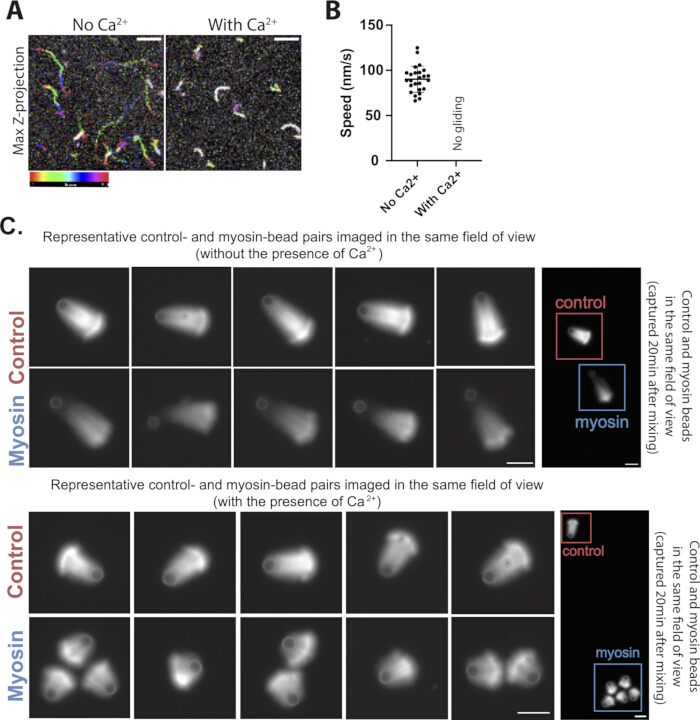
Figure 4. Calcium-based control for assessing Myo1d motor activity in the bead motility assay. (A) Time-collapsed images of actin filaments moving on a Myo1d-coated surface in the absence of elevated calcium or forming nonproductive swirling patterns in the presence of 100 µM free calcium. The rainbow color bar indicates time progression over 61 frames acquired at 5 s intervals. Scale bar, 5 µm. (B) Quantification of actin gliding speed in the absence and presence of 100 µM free calcium (N = 2 independent experiments; n = 25 filaments). No productive actin gliding was observed in the presence of 100 µM free calcium under these conditions. Error bars represent SD. (C) Representative control and myosin-coated bead pairs assembled in the absence or presence of 100 µM free calcium. Five representative bead pairs are shown for each condition. Within each pair, the control bead and myosin-coated bead were imaged in the same field of view. Images were acquired approximately 15–20 min after reaction initiation. Brightness and contrast were adjusted linearly and identically within each control–myosin bead pair but were scaled independently between conditions. Reaction conditions: 4 µM actin with 5% rhodamine-labeled actin, 200 nM actin-related protein 2/3 (Arp2/3) complex, and 50 nM capping protein (CP). Scale bars, 5 µm. Panels A and B are reproduced/modified from Xu et al., Science Advances, DOI: 10.1126/sciadv.ado5788 (2024), AAAS, with permission. Please click here to view a larger version of this figure.
When the assay was performed correctly, myosin-coated beads assayed under elevated Ca2+ conditions generated shorter actin comet tails with network densities comparable to those of control beads (Figure 4C). Five representative control- and myosin-coated bead pairs from two independent experiments are shown. This qualitative outcome was consistently observed across repeated assay preparations and is supported by the quantitative analysis reported in the original study18. This expected outcome indicates that the network differences observed under standard conditions depend on an active myosin power stroke rather than myosin surface occupancy alone. Thus, the elevated Ca2+ condition serves as a key control for assessing whether changes in branched actin network organization arise from myosin motor activity.
Discussion
The actin comet-tail bead motility assay is a well-established in vitro reconstitution system for investigating Arp2/3 complex-mediated branched actin assembly and its role in generating protrusive forces14,15,16,17. This system has been broadly applied to dissect the biochemical regulation of branched actin assembly14,15,26,27,31,49,50,51 and force generation20,21,22,23,52, while also providing a framework for quantitative studies of the emergent active matter properties of actin networks19,35,36,53. By incorporating myosin, particularly myosin-I18, into this reconstituted system, the modified assay enables investigation of how myosin–actin coupling modulates actin assembly and force production at the membrane interface, an area that remains relatively underexplored. Notably, myosin-I in this system can be readily replaced by other myosin motors to examine their respective roles in actin network remodeling and force generation. For example, myosin V (cargo transport)54, myosin VI (endocytic trafficking and membrane dynamics)55,56, myosin VII and XV (stereocilia and microvillar organization)57,58,59, myosin X (filopodia formation)60,61, and myosin XIX (mitochondrial dynamics)62 could be incorporated to investigate how different classes of myosin contribute to actin organization and their associated physiological processes.
The assay is highly reproducible provided that several critical parameters are carefully controlled. First, high-quality monomeric G-actin is essential for robust comet-tail formation. We recommend purifying G-actin from rabbit skeletal muscle acetone powder using established protocols41. After 2–3 days of dialysis, monomeric actin should be further purified by gel filtration on Sephacryl S-300 in G-buffer (2 mM Tris-HCl, pH 8.0; 0.2 mM ATP; 0.1 mM CaCl2; 1 mM NaN3; and 0.5 mM DTT). Fractions collected immediately following the elution peak should be used. Purified G-actin typically retains strong polymerization activity for 2–3 weeks when stored on ice at 4°C and may remain usable into the fourth week, although performance generally declines thereafter. Reduced comet-tail robustness, characterized by sparse, brittle actin networks and inconsistent tail growth, often indicates compromised actin quality. Second, NPF activity critically determines comet-tail formation. Commercial GST-tagged WCA domain from human neuronal Wiskott–Aldrich syndrome protein (N-WASP) (GST-VCA) provides robust and sustained nucleation activity, and GST dimerization further enhances this activity63. We recommend validating any NPF construct using a pyrene-actin polymerization assay before bead coating. The activity of the commercial GST-VCA can serve as a reference standard. Notably, the commercial GST-VCA used here lacks a polyproline region and therefore does not interact with profilin–actin complexes26. Third, reliable visualization of comet-tail growth requires careful slide and coverslip preparation. We recommend thoroughly cleaning slides and coverslips with water and ethanol, followed by plasma cleaning immediately before use. When available, polyethylene glycol–silanized coverslips26 are preferred because they minimize nonspecific protein adsorption and improve reproducibility. Including an adequate concentration of BSA in the motility mixture can further reduce nonspecific surface interactions and promote consistent assay performance. Fourth, the volume of sample applied to the chamber is critical for reliable measurements15,16,17. Excessive sample volume results in drifting beads, preventing accurate tracking of comet-tail elongation. In contrast, insufficient sample volume compresses beads between the slide and coverslip, increasing friction and immobilizing the beads. This mechanical constraint can distort comet-tail morphology and alter measured growth kinetics. Therefore, optimizing both chamber height and sample volume is essential for reproducible results. We recommend empirically optimizing the sample volume for each experimental setup. When using a 22 mm × 22 mm coverslip as described here, applying 2.1–2.3 µL of the motility mixture produces a chamber height of approximately 4.3 µm, yielding stable positioning of 2.0-µm-diameter beads without excessive drift or compression. When a coverslip of a different size is used, the sample volume should be adjusted accordingly to achieve even chamber filling, stable bead positioning, and minimal sample drift.
If comet tails fail to form, verify actin polymerization competence and NPF activity. If symmetry breaking does not occur, adjust CP concentration to modulate network density. Excessively dense networks resist fracture, whereas overly sparse networks lack structural integrity. If myosin-coated beads show no difference from control beads, confirm myosin surface density and motor activity. For quality control, the acceptance criterion is functional rather than based on an absolute numerical cutoff. A new preparation is considered acceptable if, it reproduces the comet-tail formation and growth observed with a previously validated preparation ( as shown in Figure 3). In addition, each new preparation of myosin, Arp2/3 complex, NPF, CapZ, or actin should be evaluated using the appropriate quality-control assays and compared with a previously validated preparation before use to ensure consistency across quantitative experiments (see Protocol section 3.1).
Several limitations of this assay should be considered when interpreting the results. First, fluorescence intensity is used as a relative, uncalibrated proxy for actin network density; therefore, comparisons should be made only across samples imaged under identical acquisition settings and analyzed using the same thresholding workflow. Second, bead motility, comet-tail growth, and growth efficiency provide indirect readouts of force-generating network behavior but do not constitute direct measurements of force. Direct mechanical measurements, such as optical trapping or force-calibrated membrane deformation assays64,65, are required to quantify forces produced by the network. Third, this assay does not directly resolve actin network ultrastructure, e.g. filament orientation, branch density, or local myosin organization. Complementary approaches such as electron microscopy or super-resolution imaging may be required for nanoscale structure characterization. Finally, the use of rigid micron-sized beads provides a simplified and experimentally tractable interface but does not capture the deformability, curvature heterogeneity, lipid mobility, or molecular complexity of cellular membranes. Future development of more physiologically relevant interfaces will therefore be important for investigating how cytoskeletal components coordinate at the cell leading edge.
Overall, this reconstitution approach provides precise control over protein composition and concentration, allowing individual components to be dissected mechanistically in ways that are difficult to achieve in cellular systems. It provides a versatile platform for studying how molecular motors remodel branched actin networks and shape force generation at membrane-like interfaces. With appropriate validation, the assay can be extended to examine how different myosin classes, mutant or disease-associated motor variants, and force-sensitive actin-binding proteins regulate mechanical feedback within dynamic actin networks. More broadly, this system helps connect molecular-scale motor activity to mesoscale cytoskeletal organization and mechanical function, with implications for cell motility, endocytosis, and membrane remodeling.
Disclosures
The authors declare that they have no competing financial interests or conflicts of interest.
Acknowledgements
We thank Dr. Daniel Safer and Rick Wike for excellent technical assistance with protein purification. We thank Dr. Roberto Dominguez, especially Dr. Malgorzata Boczkowska and Dr. Grzegorz Rebowski, for generously providing the Arp2/3 complex and CapZ proteins. We also thank Dr. Luther Pollard, Dr. Faviolla A. Báez-Cruz, and all members of the Ostap and Dominguez laboratories for their valuable input throughout the project. This work was supported by National Institutes of Health grant R37 GM057247 (to E.M.O.). E.M.O. and M.X. were partially supported by the National Science Foundation (CMMI-1548571). ChatGPT was used to assist with language editing during manuscript revision. The authors reviewed and edited all AI-assisted content and take full responsibility for the final manuscript.
Materials
| Name | Company | Catalog Number | Comments |
|---|---|---|---|
| Adenosine 5′-triphosphate disodium salt hydrate | Sigma | A26209 | Used to prepare ATP-containing buffers; aliquot and store at −20°C. |
| Arp2/3 complex | Prepared in-house | N/A | Used to nucleate branched actin networks; purified according to Ref. 42. |
| Biotin-CF640 fluorescent dye | Biotium | 80032 | Used to fluorescently label control beads; protect from light and store at −80°C. |
| Biotinylated Myo1d | Prepared in-house | N/A | Motor protein used to decorate myosin-coated beads; prepared as described in Refs. 18 and 38–40. |
| Bovine serum albumin | Sigma | A7906 | Used for bead blocking and bead storage buffers; prepare a filtered stock solution. |
| Calcium chloride | Sigma | C7902 | Buffer component used in X buffer and calcium-disruption experiments. |
| Calmodulin | Prepared in-house | N/A | Added to myosin-containing reactions and bead storage buffer; purified according to Ref. 44. |
| Carboxylate polystyrene beads (2.0 µm diameter) | Polysciences | 18327-10 | Used as the solid support for NPF, NeutrAvidin, fluorescent dye, and myosin coating; store at 4°C. |
| CCD camera | Teledyne | 01-RET-R6-R-M-14-C-OC | Used for fluorescence image acquisition during time-lapse microscopy. |
| Coomassie Brilliant Blue stain | Sigma | B7920 | Used to stain SDS-PAGE gels before densitometric analysis. |
| Coverslips, 22 mm × 22 mm, #1.5 | Globe | 1404-15 | Used with microscope slides to assemble squeeze chambers. |
| Dithiothreitol (DTT) | GoldBio | DTT10 | Reducing agent used in buffers and motility mixtures; store at −20°C. |
| Dry scroll vacuum pump | Agilent Technologies | IDP3B01 | Used to operate the plasma-cleaning system. |
| EGTA | GoldBio | E-217-100 | Calcium chelator used in M buffer, motility buffer, and actin pretreatment. |
| External light source | Leica | EL6000 | Metal-halide light source for fluorescence microscopy. |
| Fiji (ImageJ) | Open source | N/A | Used for comet-tail length, fluorescence intensity, and network density analysis (version 2.16.0/1.54p). |
| Fluorescence microscope | Leica | DMIRB | Inverted epifluorescence microscope used for imaging actin comet tails. |
| Glacial acetic acid | Fisher Chemical | BP2401-212 | Component of the SDS-PAGE gel destaining solution; corrosive, handle with appropriate precautions. |
| GST-VCA | Cytoskeleton | VCG03-A | Nucleation-promoting factor used for Arp2/3-mediated actin assembly; aliquot and store at −80°C. |
| HEPES | GoldBio | H-400-1 | Buffering reagent used in X buffer, M buffer, and motility buffer. |
| Human CapZ | Prepared in-house | N/A | Capping protein used to regulate actin network density; purified according to Ref. 43. |
| Magnesium chloride | Spectrum Chemical | M1035 | Buffer component used in reaction buffers and actin pretreatment. |
| MetaMorph imaging software | Molecular Devices | N/A | Used for microscope control and image acquisition (version 7.10.4.459). |
| Methanol | Sigma | MX0485-3 | Component of the SDS-PAGE gel destaining solution; flammable, handle according to institutional safety procedures. |
| Methylcellulose | Sigma | M0387 | Added to the motility buffer to increase solution viscosity (1500 cP). |
| Microscope slides | Corning | 2947-75X25 | Used to assemble squeeze chambers for microscopy. |
| NeutrAvidin protein | Thermo Fisher Scientific | 31000 | Used for immobilization of biotinylated proteins on bead surfaces; aliquot and store at −80°C. |
| PageRuler Plus Prestained Protein Ladder | Thermo Scientific | 26619 | Molecular weight marker used for SDS-PAGE analysis; store at −20°C. |
| Plasma cleaner | Harrick Plasma | PDC-32G | Used to plasma-clean microscope slides and coverslips before chamber assembly. |
| Polyethersulfone syringe filter, 0.22 µm | Sigma | SLGPR33RS | Used to filter the bovine serum albumin stock solution before aliquoting. |
| Potassium chloride | Fisher BioReagents | BP366-1 | Salt used to maintain ionic strength in assay buffers. |
| Rabbit skeletal muscle actin | Prepared in-house | N/A | Purified according to Ref. 41 and used as G-actin for actin comet-tail assembly assays. |
| Refrigerated microcentrifuge | Eppendorf | EP-5415R | Used for bead pelleting during bead preparation and washing steps. |
| Rotating tube mixer (benchtop rotator) | Cole-Parmer | EW-04397-40 | Used during bead-coating incubations to maintain the bead suspension. |
| Tris/Glycine/SDS running buffer (10×) | Bio-Rad | 1610732 | Dilute to 1× before SDS-PAGE electrophoresis. |
| Vacuum grease | High Vac Depot | 408524 | Used to seal squeeze chambers before fluorescence imaging. |
| 4%–20% gradient SDS-polyacrylamide gel | Thermo Fisher Scientific | XP04205BOX | Used for SDS-PAGE analysis of bead-associated proteins; store at 4°C. |
References
- Blanchoin L, Boujemaa-Paterski R, Sykes C, Plastino J. Actin dynamics, architecture, and mechanics in cell motility. Physiol Rev. 2014;94(1):235-63.
- Svitkina T. The actin cytoskeleton and actin-based motility. Cold Spring Harb Perspect Biol. 2018;10(1).
- Papalazarou V, Machesky LM. The cell pushes back: The Arp2/3 complex is a key orchestrator of cellular responses to environmental forces. Curr Opin Cell Biol. 2021;68:37-44.
- Krendel M, Gauthier NC. Building the phagocytic cup on an actin scaffold. Curr Opin Cell Biol. 2022;77:102112.
- Yang C, et al. Actin polymerization promotes invagination of flat clathrin-coated lattices in mammalian cells by pushing at lattice edges. Nat Commun. 2022;13(1):6127.
- Clarke DN, Martin AC. Actin-based force generation and cell adhesion in tissue morphogenesis. Curr Biol. 2021;31(10):R667-R80.
- McConnell RE, Tyska MJ. Leveraging the membrane-cytoskeleton interface with myosin-1. Trends Cell Biol. 2010;20(7):418-26.
- Almeida CG, et al. Myosin 1b promotes the formation of post-Golgi carriers by regulating actin assembly and membrane remodelling at the trans-Golgi network. Nat Cell Biol. 2011;13(7):779-89.
- McIntosh BB, Ostap EM. Myosin-I molecular motors at a glance. J Cell Sci. 2016;129(14):2689-95.
- Pedersen RTA, Drubin DG. Type I myosins anchor actin assembly to the plasma membrane during clathrin-mediated endocytosis. J Cell Biol. 2019;218(4):1138-47.
- Barger SR, et al. Membrane-cytoskeletal crosstalk mediated by myosin-I regulates adhesion turnover during phagocytosis. Nat Commun. 2019;10(1):1249.
- Manenschijn HE, et al. Type-I myosins promote actin polymerization to drive membrane bending in endocytosis. eLife. 2019;8.
- Smith SL, et al. Class-I myosin responds to changes in membrane tension during clathrin-mediated endocytosis in human induced pluripotent stem cells. Proc Natl Acad Sci U S A. 2026;123(9):e2532817123.
- Loisel TP, Boujemaa R, Pantaloni D, Carlier MF. Reconstitution of actin-based motility of Listeria and Shigella using pure proteins. Nature. 1999;401(6753):613-6.
- Akin O, Mullins RD. Capping protein increases the rate of actin-based motility by promoting filament nucleation by the Arp2/3 complex. Cell. 2008;133(5):841-51.
- Boujemaa-Paterski R, et al. Directed actin assembly and motility. Methods Enzymol. 2014;540:283-300.
- Sykes C, Plastino J. Reconstitution of actin-based motility with commercially available proteins. J Vis Exp. 2022;(188).
- Xu M, et al. Myosin-I synergizes with Arp2/3 complex to enhance the pushing forces of branched actin networks. Sci Adv. 2024;10(37):eado5788.
- Kawska A, et al. How actin network dynamics control the onset of actin-based motility. Proc Natl Acad Sci U S A. 2012;109(36):14440-5.
- Cameron LA, Footer MJ, van Oudenaarden A, Theriot JA. Motility of ActA protein-coated microspheres driven by actin polymerization. Proc Natl Acad Sci U S A. 1999;96(9):4908-13.
- Bernheim-Groswasser A, et al. The dynamics of actin-based motility depend on surface parameters. Nature. 2002;417(6886):308-11.
- van der Gucht J, Paluch E, Plastino J, Sykes C. Stress release drives symmetry breaking for actin-based movement. Proc Natl Acad Sci U S A. 2005;102(22):7847-52.
- Achard V, et al. A "primer"-based mechanism underlies branched actin filament network formation and motility. Curr Biol. 2010;20(5):423-8.
- Noireaux V, et al. Growing an actin gel on spherical surfaces. Biophys J. 2000;78(3):1643-54.
- Theriot JA, Mitchison TJ, Tilney LG, Portnoy DA. The rate of actin-based motility of intracellular Listeria monocytogenes equals the rate of actin polymerization. Nature. 1992;357(6375):257-60.
- Bieling P, et al. WH2 and proline-rich domains of WASP-family proteins collaborate to accelerate actin filament elongation. EMBO J. 2018;37(1):102-21.
- Funk J, et al. A barbed end interference mechanism reveals how capping protein promotes nucleation in branched actin networks. Nat Commun. 2021;12(1):5329.
- Gautreau AM, Fregoso FE, Simanov G, Dominguez R. Nucleation, stabilization, and disassembly of branched actin networks. Trends Cell Biol. 2022;32(5):421-32.
- Nakamura F, Osborn E, Janmey PA, Stossel TP. Comparison of filamin A-induced cross-linking and Arp2/3 complex-mediated branching on the mechanics of actin filaments. J Biol Chem. 2002;277(11):9148-54.
- Colin A, et al. Friction patterns guide actin network contraction. Proc Natl Acad Sci U S A. 2023;120(39):e2300416120.
- Colin A, et al. Recycling of the actin monomer pool limits the lifetime of network turnover. EMBO J. 2023;42(9):e112717.
- Suarez C, et al. Reconstitution of the transition from a lamellipodia- to filopodia-like actin network with purified proteins. Eur J Cell Biol. 2023;102(4):151367.
- Pollard LW, Boczkowska M, Dominguez R, Ostap EM. Myosin-1C differentially displaces tropomyosin isoforms altering their inhibition of motility. J Biol Chem. 2024;300(8):107539.
- Thompson CP, et al. Non-muscle tropomyosins inhibit myosin-19 and dynamically localize to mitochondrially associated actin filaments. J Biol Chem. 2026;302(5):111377.
- Bussonnier M, et al. Mechanical detection of a long-range actin network emanating from a biomimetic cortex. Biophys J. 2014;107(4):854-62.
- Paluch E, van der Gucht J, Joanny JF, Sykes C. Deformations in actin comets from rocketing beads. Biophys J. 2006;91(8):3113-22.
- Lewis JH, Lin T, Hokanson DE, Ostap EM. Temperature dependence of nucleotide association and kinetic characterization of Myo1b. Biochemistry. 2006;45(38):11589-97.
- Baez-Cruz FA, Ostap EM. Drosophila class-I myosins that can impact left-right asymmetry have distinct ATPase kinetics. J Biol Chem. 2023;299(8):104961.
- Lin T, Tang N, Ostap EM. Biochemical and motile properties of Myo1b splice isoforms. J Biol Chem. 2005;280(50):41562-7.
- Lebreton G, et al. Molecular to organismal chirality is induced by the conserved myosin 1D. Science. 2018;362(6417):949-52.
- Spudich JA, Watt S. The regulation of rabbit skeletal muscle contraction. I. Biochemical studies of the interaction of the tropomyosin-troponin complex with actin and the proteolytic fragments of myosin. J Biol Chem. 1971;246(15):4866-71.
- Boczkowska M, et al. X-ray scattering study of activated Arp2/3 complex with bound actin-WCA. Structure. 2008;16(5):695-704.
- Rao JN, Madasu Y, Dominguez R. Mechanism of actin filament pointed-end capping by tropomodulin. Science. 2014;345(6195):463-7.
- Putkey JA, Slaughter GR, Means AR. Bacterial expression and characterization of proteins derived from the chicken calmodulin cDNA and a calmodulin processed gene. J Biol Chem. 1985;260(8):4704-12.
- Schindelin J, et al. Fiji: an open-source platform for biological-image analysis. Nat Methods. 2012;9(7):676-82.
- Greenberg MJ, Ostap EM. Regulation and control of myosin-I by the motor and light chain-binding domains. Trends Cell Biol. 2013;23(2):81-9.
- Lewis JH, et al. Calcium regulation of myosin-I tension sensing. Biophys J. 2012;102(12):2799-807.
- Manceva S, et al. Calcium regulation of calmodulin binding to and dissociation from the Myo1c regulatory domain. Biochemistry. 2007;46(42):11718-26.
- Mullins RD, Bieling P, Fletcher DA. From solution to surface to filament: actin flux into branched networks. Biophys Rev. 2018;10(6):1537-51.
- Mooren OL, et al. Reconstitution of Arp2/3-nucleated actin assembly with proteins CP, V-1, and CARMIL. Curr Biol. 2024;34(22):5173-86.e4.
- Pollard LW, et al. Genetically inspired in vitro reconstitution of Saccharomyces cerevisiae actin cables from seven purified proteins. Mol Biol Cell. 2020;31(5):335-47.
- Marcy Y, Prost J, Carlier MF, Sykes C. Forces generated during actin-based propulsion: a direct measurement by micromanipulation. Proc Natl Acad Sci U S A. 2004;101(16):5992-7.
- Dayel MJ, et al. In silico reconstitution of actin-based symmetry breaking and motility. PLoS Biol. 2009;7(9):e1000201.
- Hammer JA 3rd, Sellers JR. Walking to work: roles for class V myosins as cargo transporters. Nat Rev Mol Cell Biol. 2011;13(1):13-26.
- Buss F, Kendrick-Jones J. How are the cellular functions of myosin VI regulated within the cell. Biochem Biophys Res Commun. 2008;369(1):165-75.
- Spudich JA, Sivaramakrishnan S. Myosin VI: an innovative motor that challenged the swinging lever arm hypothesis. Nat Rev Mol Cell Biol. 2010;11(2):128-37.
- Self T, et al. Shaker-1 mutations reveal roles for myosin VIIA in both development and function of cochlear hair cells. Development. 1998;125(4):557-66.
- Crawley SW, et al. Intestinal brush border assembly driven by protocadherin-based intermicrovillar adhesion. Cell. 2014;157(2):433-46.
- Houdusse A, Titus MA. The many roles of myosins in filopodia, microvilli and stereocilia. Curr Biol. 2021;31(10):R586-R602.
- Bohil AB, Robertson BW, Cheney RE. Myosin-X is a molecular motor that functions in filopodia formation. Proc Natl Acad Sci U S A. 2006;103(33):12411-6.
- Fitz GN, et al. Protrusion growth driven by myosin-generated force. Dev Cell. 2023;58(1):18-33.
- Quintero OA, et al. Human Myo19 is a novel myosin that associates with mitochondria. Curr Biol. 2009;19(23):2008-13.
- Zimmet A, et al. Cryo-EM structure of NPF-bound human Arp2/3 complex and activation mechanism. Sci Adv. 2020;6(23):eaaz7651.
- Giardini PA, Fletcher DA, Theriot JA. Compression forces generated by actin comet tails on lipid vesicles. Proc Natl Acad Sci U S A. 2003;100(11):6493-8.
- Upadhyaya A, Chabot JR, Andreeva A, Samadani A, van Oudenaarden A. Probing polymerization forces by using actin-propelled lipid vesicles. Proc Natl Acad Sci U S A. 2003;100(8):4521-6.
Reprints and Permissions
This article has been published
Video Coming Soon