Here, we present a protocol for cohort assembly, laboratory harmonization, penalized model development, validation, and bedside score construction for early risk stratification of multiple organ dysfunction syndrome in acute pancreatitis.
Research Article
A Reproducible Admission Biochemical-Coagulation Scoring Protocol for Multiple Organ Dysfunction Syndrome in Acute Pancreatitis
In This Article
Summary
Abstract
Early recognition of multiple organ dysfunction syndrome in acute pancreatitis remains difficult because organ deterioration may occur before conventional severity assessments are complete. This article describes a reproducible protocol for developing, validating, and applying an admission biochemical-coagulation composite score based on routine laboratory tests obtained within 24 h of hospital admission. Multiple organ dysfunction syndrome was selected as the primary endpoint because it reflects clinically consequential dysfunction across more than one organ system and directly informs early monitoring intensity, escalation planning, and critical care resource allocation. The protocol covers multicenter cohort assembly, eligibility screening, endpoint adjudication, laboratory unit harmonization, missing-data processing, predictor scaling, penalized regression model development, hold-out validation, score construction, benchmarking against established severity scores, and sensitivity analyses. Continuous laboratory variables are retained during model development to reduce information loss, whereas clinically interpretable categories are used only when translating the final model into a practical bedside score. Procedural checkpoints include confirmation of cohort assembly, missingness thresholds, locked preprocessing rules, model-selection outputs, validation outputs, and final score interpretation. Using this workflow, routinely measured biochemical and coagulation markers can be integrated into a structured admission risk-stratification tool for acute pancreatitis-associated multiple organ dysfunction syndrome. The score is intended to support closer observation, repeated laboratory assessment, and preparation for organ-support pathways, but it should complement rather than replace clinical judgment or established severity frameworks.
Introduction
Acute pancreatitis is a common digestive emergency with a clinical course that ranges from mild, self-limiting inflammation to rapidly progressive disease complicated by organ dysfunction. Current severity assessment is usually guided by the revised Atlanta classification, which defines disease severity according to local complications, systemic complications, and the presence and duration of organ failure1. Bedside scoring systems are also used during early hospitalization to support risk assessment and escalation decisions. The Bedside Index for Severity in Acute Pancreatitis uses five variables available within the first 24 h and was developed to estimate the risk of in-hospital mortality2. Recent clinical guidelines continue to emphasize early recognition of severe disease, repeated reassessment, appropriate fluid resuscitation, organ-support planning, and timely escalation of care3.
Early risk assessment remains difficult in routine practice. The inflammatory response in acute pancreatitis changes rapidly, and some traditional scoring systems require repeated measurements, physiologic variables that evolve after admission, or imaging findings that may not be available at the first clinical encounter4. As a result, risk classification may vary with sampling time, local workflow, and treatment pathway. These uncertainties can lead to unnecessary intensive monitoring or intervention in low-risk patients, while patients who deteriorate quickly may experience delayed escalation. A recent review of severity prediction in acute pancreatitis noted that the performance of clinical scores and individual biomarkers varies across patient populations, disease severity distributions, and assessment windows5.
Most recent prediction studies have attempted to use variables collected within 24 h of admission, often with persistent organ failure or severe acute pancreatitis as the target outcome. This approach is clinically useful, but many published models remain limited by single-center design, incomplete validation, and insufficient reporting of preprocessing and missing-data methods6. Transparent reporting is particularly important for prediction models because eligibility criteria, predictor definitions, sample size, missing-data handling, model-building decisions, and validation procedures directly affect reproducibility and clinical interpretation7. For an admission-based method to be usable across institutions, it should rely on routinely available tests, define unit conversion procedures, explain how laboratory values are harmonized, and specify how incomplete predictor values are handled before model fitting.
Biochemical and coagulation abnormalities are both relevant to early deterioration in acute pancreatitis. Inflammatory activation, endothelial injury, hemoconcentration, renal hypoperfusion, and microcirculatory disturbance may occur early and contribute to organ dysfunction. Coagulation activation is closely linked with inflammation, and acute pancreatitis-associated coagulopathy has been described as part of the progression toward persistent organ failure and adverse outcomes8. D-dimer has also been reported as an admission marker associated with organ failure, local complications, intensive care admission, and mortality in acute pancreatitis9. However, coagulation indicators are often interpreted separately rather than combined with routine biochemical variables in a structured admission workflow.
Multiple organ dysfunction syndrome was selected as the primary endpoint in this protocol because it represents clinically consequential dysfunction across more than one organ system. Persistent organ failure remains central to acute pancreatitis severity classification, but multiple organ dysfunction syndrome is closer to the practical admission question: whether a patient is likely to require closer surveillance, repeated laboratory reassessment, organ-support preparation, or intensive care resources. This endpoint also allows biochemical and coagulation signals to be evaluated in relation to a broader pattern of systemic deterioration rather than a single organ-based outcome.
This method's article describes a reproducible admission biochemical-coagulation scoring protocol for early risk stratification of multiple organ dysfunction syndrome in acute pancreatitis. The protocol uses routine laboratory variables obtained within 24 h of admission, standardizes unit harmonization and missing-data handling, applies penalized model development, and translates the final model into a clinically interpretable composite score. The goal is not to replace clinical judgment or established severity frameworks, but to provide a transparent, replicable workflow that helps institutions organize admission laboratory data into actionable risk information.
Protocol
The study protocol was approved by the Ethics Committee of Biomedical Research Involving Humans of The First People’s Hospital of Jiashan, Jiashan Hospital Affiliated to Jiaxing University (approval no. 2026 Research Approval No. 005; acceptance no. LW2026004; approval date: January 13, 2026). The requirement for individual informed consent was waived because this retrospective study used de-identified clinical data. Before analysis, direct identifiers, including name, hospital identification number, telephone number, address, and national identification number, were removed. Data handling followed institutional data-protection requirements and the Declaration of Helsinki10.
Study design and multicenter cohort assembly
This retrospective multicenter cohort study used admission biochemical and coagulation data to construct a reproducible scoring workflow for early risk stratification of multiple organ dysfunction syndrome (MODS) in acute pancreatitis (AP). AP was defined by at least two of the following criteria: typical abdominal pain, serum amylase or lipase at least three times the upper limit of normal, or imaging findings consistent with AP. The baseline window was defined as the first 24 h after hospital admission. For each laboratory predictor, the earliest eligible value within this window was used. Values obtained after the first documented onset of MODS were not used for predictor construction.
Consecutive AP hospitalizations from the participating centers from January 1, 2023, through December 20, 2025, were screened using a unified screening log, eligibility checklist, data dictionary, and endpoint adjudication form. The screening log recorded total screened admissions, duplicate admissions, exclusions for unconfirmed AP, age younger than 18 years, chronic pancreatitis, pancreatic malignancy-associated pancreatitis, unreliable admission time, unavailable 24 h laboratory data, incomplete endpoint records, and the final analytic cohort. The locked screening log was used to generate Figure 1. The patient counts in Figure 1 were checked against the final analytic dataset before analysis.
After the analytic cohort was locked, patients were assigned to a development cohort and a hold-out validation cohort at a 7:3 ratio. The split was performed in R version 4.3.2 using the caret package version 6.0-94, with the random seed fixed at 20260420. Stratified sampling was performed by MODS status and center. If the center distribution differed by more than 5 percentage points between cohorts, center-MODS combined strata were used. Cohort allocation was saved before model fitting and was not modified afterward. Preprocessing rules, imputation settings, model tuning, coefficient estimation, score construction, and cutoff selection were derived solely from the development cohort. The hold-out validation cohort was used only for locked-model evaluation.
Eligibility criteria and enrollment procedures
Eligible patients were adults aged 18 years or older with confirmed AP, traceable hospital admission time, at least one biochemical or coagulation laboratory panel within 24 h after admission, and complete in-hospital records for endpoint adjudication. Patients were excluded if AP could not be confirmed, if chronic pancreatitis or pancreatic malignancy-associated pancreatitis was present, or if the time of the first hospital admission could not be reliably reconstructed. Transfer cases were excluded when the first admission time, the first laboratory sampling time, or the early organ dysfunction status were not traceable across institutions. For repeated admissions by the same patient during the study period, only the first eligible hospitalization was retained. One primary exclusion reason was recorded for each excluded case.
Outcomes and endpoint adjudication
The primary outcome was in-hospital MODS, defined as dysfunction of two or more organ systems during hospitalization. Organ dysfunction was assessed from respiratory, cardiovascular, renal, hepatic, coagulation, and neurological records in the electronic medical record. The same prespecified organ-system criteria were applied across centers before model development, and the operational criteria used for endpoint adjudication are summarized in Supplementary Table 1.
Two trained reviewers independently assessed each de-identified record using admission notes, progress notes, intensive care unit records, procedure records, laboratory reports, vital-sign records, and discharge summaries. The adjudication form recorded patient study code, involved organ system, source record, onset date and time, supporting laboratory or physiological value, reviewer decision, and final adjudication status. Agreement between reviewers was accepted as final. Disagreements were resolved by a third senior reviewer. Secondary outcomes included intensive care unit admission, invasive or non-invasive mechanical ventilation, renal replacement therapy, in-hospital mortality, infected necrosis or drainage procedure, and length of hospital stay. Length of stay was calculated as the discharge date minus the admission date plus 1 day.
Candidate predictors at admission
Candidate predictors were restricted to routine variables available within 24 h after admission. For repeated tests within the 24 h window, the earliest eligible value was retained. Biochemical variables included white blood cell count, C-reactive protein, procalcitonin when available, lactate, glucose, total calcium, blood urea nitrogen, creatinine, alanine aminotransferase, total bilirubin, albumin, and lactate dehydrogenase. Coagulation variables included platelet count, prothrombin time, prothrombin time-international normalized ratio, activated partial thromboplastin time, fibrinogen, and D-dimer.
Baseline clinical variables were collected for case-mix description and benchmark-score calculation. These variables included age, sex, body mass index, time from symptom onset to admission, AP etiology, smoking status, previous pancreatitis, comorbidities, admission heart rate, mean arterial pressure, systemic inflammatory response syndrome status, Bedside Index for Severity in Acute Pancreatitis score, Acute Physiology and Chronic Health Evaluation II score, and Sequential Organ Failure Assessment score. When both prothrombin time and prothrombin time-international normalized ratio were available, prothrombin time-international normalized ratio was used for modeling, and prothrombin time was retained for descriptive reporting. The extraction file contained one row per hospitalization and retained center code, patient study code, admission time, sampling time, raw value, raw unit, harmonized value, harmonized unit, source table, and missingness flag.
Laboratory harmonization across centers
All laboratory variables were converted to prespecified target units before analysis: white blood cell count and platelet count, 109/L; C-reactive protein, mg/L; procalcitonin, ng/mL; lactate, glucose, total calcium, and blood urea nitrogen, mmol/L; creatinine and total bilirubin, µmol/L; alanine aminotransferase and lactate dehydrogenase, U/L; albumin and fibrinogen, g/L; prothrombin time and activated partial thromboplastin time, seconds; prothrombin time-international normalized ratio, unitless ratio; and D-dimer, mg/L fibrinogen-equivalent units. D-dimer values reported as µg/mL fibrinogen-equivalent units were converted to mg/L fibrinogen-equivalent units using a 1:1 numeric conversion. D-dimer values reported as D-dimer units were converted only when the local laboratory provided a validated conversion factor. Values without a validated conversion factor were treated as missing for modeling.
Each center’s reporting units, reference ranges, assay records, and analyzer notes were reviewed before pooling. The harmonization file retained the original unit, target unit, conversion rule, and reviewer responsible for checking the conversion. Laboratory values were not normalized by center-specific reference ranges in the primary analysis because the score was intended to use absolute clinical values. Center code was retained during imputation and sensitivity analysis. Negative values for non-negative tests, incompatible units, timestamps outside the 24 h window, and values unsupported by source records were flagged. A value was corrected only when the source record confirmed a transcription or unit-conversion error; otherwise, it was set to missing.
Data preprocessing and missing-data handling
Missingness was summarized by variable, center, and MODS status before model fitting. Candidate predictors were excluded from model development if overall missingness exceeded 30% or if missingness exceeded 50% in any single center. Patients were excluded from the modeling dataset if more than 40% of candidate predictors were missing or if the primary outcome could not be adjudicated.
Continuous predictors were winsorized at the 1st and 99th percentiles estimated in the development cohort. The same thresholds were applied to the hold-out validation cohort. Thresholds were not re-estimated in validation data. Variables with skewness greater than 2 after winsorization were transformed using the natural logarithm; log(x + 0.01) was used for variables that could contain zero. Continuous predictors were standardized using the development-cohort mean and standard deviation, and the same parameters were applied to validation data.
Multiple imputation was performed using chained equations in R with the mice package version 3.16.0. Twenty imputed datasets were generated with 20 iterations per dataset. Predictive mean matching was used for continuous variables, logistic regression for binary variables, and polytomous logistic regression for nominal categorical variables. The imputation model included candidate predictors, center code, cohort indicator, and MODS status for model development. Validation outcomes were not used to modify preprocessing rules, variable eligibility, or thresholds. Regression estimates were pooled using Rubin’s rules when reported. Prediction metrics were calculated within each imputed dataset and summarized as pooled or median estimates with ranges. Two sensitivity analyses were prespecified: complete-case analysis using patients without missing final-model predictors, and baseline-value analysis using the worst eligible laboratory value within 24 h instead of the earliest value.
Statistical analysis and model development
Baseline characteristics were summarized separately in the development and hold-out validation cohorts. Continuous variables were reported as mean ± standard deviation or median with interquartile range, and categorical variables as n (%). Admission biochemical and coagulation variables were compared between patients with and without MODS. Student’s t-test or Wilcoxon rank-sum test was used for continuous variables, and chi-square or Fisher’s exact test was used for categorical variables. These P values were descriptive and were not used alone for predictor selection.
Model development was restricted to the development cohort. Penalized logistic regression was used as the primary model to reduce overfitting in the presence of limited event counts and correlated laboratory predictors. The model was fitted in R version 4.3.2 using the glmnet package version 4.1-8 with a binomial family, standardized predictors, and least absolute shrinkage and selection operator (LASSO) penalization, specified by alpha = 1. Ten-fold cross-validation repeated 10 times was used for penalty tuning, with the random seed fixed at 20260420. The penalty parameter was selected using the one-standard-error rule. The coefficient path, cross-validation error values, selected penalty parameter, and retained predictors were saved. The analysis workflow is shown in Figure 2. The software, statistical packages, database systems, and laboratory platforms used in the protocol are listed in the Table of Materials.
Unpenalized logistic regression was not used as the primary inferential model after penalized selection. If odds ratios were reported for clinical interpretation, they were labeled as descriptive post-selection estimates. Discrimination was estimated using the area under the receiver operating characteristic curve, with 95% confidence intervals calculated using the DeLong method in the pROC package version 1.18.5. Calibration was assessed using calibration intercept, calibration slope, Brier score, and calibration plots. Bootstrap resampling with 1,000 repetitions was used in the development cohort to estimate optimism-corrected performance. Decision-curve analysis was not retained in the revised analysis set; therefore, clinical net-benefit claims were removed from the manuscript.
Score derivation and interpretation
The point-based admission biochemical-coagulation composite score was derived from the locked penalized model coefficients. Continuous variables were used during model fitting. Categorized thresholds were introduced only after model finalization to support bedside calculation. Thresholds were selected according to established clinical reference ranges, commonly used laboratory abnormality thresholds, or coefficient-based cut points defined in the development cohort before validation. Thresholds were not optimized in the validation cohort.
Integer points were assigned according to the direction and relative magnitude of the locked coefficients. Higher points indicated more adverse laboratory profiles. The total score was calculated by summing points across retained components. Prespecified risk categories were used solely for risk stratification; they were not used to define MODS. The score was intended to identify patients who may need closer observation, repeated laboratory assessment, or preparation for organ-support pathways. It was not used as a standalone diagnostic rule, an anticoagulation trigger, or a substitute for clinician reassessment.
Hold-out validation and benchmarking
The locked preprocessing rules, imputation structure, winsorization thresholds, standardization parameters, model coefficients, score rules, and prespecified cutoffs were applied to the hold-out validation cohort. No further predictor screening, model refitting, coefficient recalibration, or threshold optimization was performed. Validation performance was summarized using discrimination, calibration, Brier score, sensitivity, specificity, positive predictive value, and negative predictive value.
Established severity tools were calculated from the same admission window when data were available, including the Bedside Index for Severity in Acute Pancreatitis, Acute Physiology and Chronic Health Evaluation II score, Sequential Organ Failure Assessment score, Ranson score, Harmless Acute Pancreatitis Score, and systemic inflammatory response syndrome criteria. Comparisons used the same endpoint, analysis population, and validation framework. Paired area-under-curve comparisons were performed using DeLong tests.
All validation plots and score-stratified plots were generated from the locked analytic dataset. The sample size in each figure panel was checked against the final analytic cohort, the development cohort, the hold-out validation cohort, or the prespecified score stratum before figure preparation. Visual methods designed for high-dimensional omics, ecological count data, or differential-abundance analysis were not used for routine clinical laboratory data.
Results
Cohort characteristics and baseline comparability
A total of 300 patients with acute pancreatitis were included in the final analytic cohort. According to the prespecified 7:3 stratified hold-out split, 210 patients were allocated to the development cohort and 90 patients to the hold-out validation cohort. All included patients had eligible biochemical and coagulation measurements within 24 h after hospital admission.
Baseline characteristics are shown in Table 1. The development and hold-out validation cohorts were similar in age (54.0 years ± 16.4 years vs 55.3 years ± 15.2 years, P = 0.486), sex distribution (male: 61.9% vs 61.1%, P = 0.898), body mass index (25.0 [22.6–27.9] kg/m2 vs 24.7 [22.2–27.5] kg/m2, P = 0.293), time from symptom onset to admission (13.2 [7.1–22.6] h vs 12.8 [6.8–21.7] h, P = 0.612), and acute pancreatitis etiology (P = 0.931). Comorbidities, admission vital signs, systemic inflammatory response syndrome status, Bedside Index for Severity in Acute Pancreatitis score, Sequential Organ Failure Assessment score, and listed admission biochemical and coagulation variables were also balanced between the two cohorts. These comparisons confirmed that the hold-out split did not introduce a clinically meaningful baseline imbalance.
Admission biochemical and coagulation profiles by MODS status
Among the 300 patients, 50 developed multiple organ dysfunction syndrome (MODS) during hospitalization, and 250 did not. Admission biochemical and coagulation profiles by MODS status are summarized in Table 2. Compared with patients without MODS, patients who developed MODS had higher white blood cell count (14.4 × 10⁹/L ± 5.2 × 10⁹/L vs 12.3 × 10⁹/L ± 4.6 ×10⁹/L, P = 0.008), neutrophil-to-lymphocyte ratio (13.4 [9.1–21.3] vs 9.0 [5.9–14.2], P < 0.001), C-reactive protein (138.6 [86.9–226.7] mg/L vs 61.4 [29.2–123.8] mg/L, P < 0.001), procalcitonin (1.25 [0.56–3.28] ng/mL vs 0.43 [0.18–1.02] ng/mL, P < 0.001), lactate (2.7 [2.0–4.0] mmol/L vs 1.7 [1.2–2.4] mmol/L, P = 0.004), and glucose (11.2 [8.9–15.1] mmol/L vs 8.9 [7.3–11.4] mmol/L, P = 0.010).
The MODS group also showed lower calcium (1.96 mmol/L ± 0.21 mmol/L vs 2.06 mmol/L ± 0.17 mmol/L, P = 0.013) and albumin (32.5 g/L ± 5.6 g/L vs 35.9 g/L ± 4.8 g/L, P < 0.001), together with higher blood urea nitrogen (9.4 [7.4–13.2] mmol/L vs 6.6 [5.1–8.9] mmol/L, P < 0.001), creatinine (108.9 [84.7–163.4] µmol/L vs 77.1 [62.4–97.6] µmol/L, P < 0.001), total bilirubin (22.1 [14.2–38.9] µmol/L vs 18.6 [12.3–31.7] µmol/L, P = 0.038), and lactate dehydrogenase (372.4 [289.8–512.3] U/L vs 254.6 [203.2–329.1] U/L, P < 0.001). Prothrombin time, prothrombin time-international normalized ratio, activated partial thromboplastin time, and D-dimer were also higher in the MODS group. Platelet count (P = 0.096) and fibrinogen (P = 0.268) were not significantly different between groups. These comparisons were descriptive and were not used alone for predictor selection.
Early outcome patterns and score-related trends
Crude clinical outcomes according to multiple organ dysfunction syndrome status are presented in Figure 3. Patients who developed multiple organ dysfunction syndrome had a longer hospital stay than those who did not develop multiple organ dysfunction syndrome (Figure 3A). They also had higher rates of intensive care unit admission (Figure 3B), mechanical ventilation (Figure 3C), renal replacement therapy (Figure 3D), infected necrosis or drainage procedures (Figure 3E), and in-hospital mortality (Figure 3F). All panels were generated from the locked 300-patient analytic cohort.
Observed clinical outcomes across the prespecified point-based composite-score strata are presented in Figure 4. The incidence of multiple organ dysfunction syndrome increased progressively across the low-, intermediate-, high-, and very-high-risk groups (Figure 4A). Similar ordered increases were observed for intensive care unit admission (Figure 4B), in-hospital mortality (Figure 4C), and infected necrosis or drainage procedures (Figure 4D). Length of hospital stay also increased across the four score strata (Figure 4E). The gradients were most pronounced for multiple organ dysfunction syndrome incidence and intensive care unit admission. All panels were generated from the locked analytic dataset using the prespecified score categories.
The distribution of the point-based composite score across the revised Atlanta severity categories is shown in Figure 5. Median composite scores increased progressively across mild, moderately severe, and severe acute pancreatitis, indicating concordance between the admission biochemical–coagulation score and established clinical severity categories. Figure 5 was generated from the same locked 300-patient analytic cohort. No ordination, differential-abundance, volcano-plot, q-value, Bray–Curtis distance, or principal coordinate analysis visualization was used.
Penalized model development and retained predictors
Penalized model development was performed exclusively in the development cohort. The coefficient trajectories of the candidate admission predictors are shown in Figure 6A, and the repeated 10-fold cross-validation curve used to select the penalty parameter is shown in Figure 6B. At the penalty parameter selected using the one-standard-error rule, least absolute shrinkage and selection operator penalization retained nine admission predictors: albumin, blood urea nitrogen, creatinine, calcium, lactate dehydrogenase, prothrombin time–international normalized ratio, D-dimer, platelet count, and glucose.
The retained predictors and descriptive post-selection estimates are shown in Table 3. These estimates were reported to aid clinical interpretation and were not treated as confirmatory inference after penalized selection. The direction of association was clinically coherent: lower albumin, higher blood urea nitrogen, higher creatinine, lower calcium, higher lactate dehydrogenase, higher prothrombin time-international normalized ratio, higher D-dimer, lower platelet count, and higher glucose were associated with increased MODS risk. Descriptive post-selection estimates were as follows: albumin per 5 g/L decrease, odds ratio 1.29 (95% confidence interval 1.13–1.47); blood urea nitrogen per 1 mmol/L increase, odds ratio 1.12 (1.06–1.18); creatinine per 10 µmol/L increase, odds ratio 1.05 (1.02–1.09); calcium per 0.1 mmol/L decrease, odds ratio 1.18 (1.07–1.30); lactate dehydrogenase per 100 U/L increase, odds ratio 1.21 (1.07–1.37); prothrombin time-international normalized ratio per 0.1 increase, odds ratio 1.14 (1.05–1.25); D-dimer per 1.0 mg/L fibrinogen-equivalent units increase, odds ratio 1.09 (1.02–1.17); platelet count per 50 × 109/L decrease, odds ratio 1.16 (1.01–1.34); and glucose per 1 mmol/L increase, odds ratio 1.05 (1.00–1.10).
Construction of the point-based composite score
The rules used to construct the point-based admission biochemical–coagulation composite score are presented in Table 4. The score was derived from the coefficients of the locked penalized model and translated into clinically interpretable categories for bedside calculation. Eight variables-albumin, blood urea nitrogen, creatinine, calcium, lactate dehydrogenase, prothrombin time, international normalized ratio, D-dimer, and platelet count—were included as core score components. Glucose was retained as an optional modifier because its contribution was smaller than that of the core biochemical and coagulation variables, although its direction of association with multiple organ dysfunction syndrome remained consistent with the locked model.
A nomogram incorporating all nine predictors retained by the locked penalized model is presented in Figure 7. The nomogram provides an individualized estimate of the probability of multiple organ dysfunction syndrome based on admission albumin, blood urea nitrogen, creatinine, calcium, lactate dehydrogenase, prothrombin time-international normalized ratio, D-dimer, platelet count, and glucose values. It was included as an interpretive aid, whereas the point-based composite score remained the primary practical bedside tool because it can be calculated directly from routinely available admission laboratory measurements.
Model performance and internal validation
Model performance in the development and hold-out validation cohorts is shown in Table 5. The penalized logistic model with a penalty term achieved an area under the receiver operating characteristic curve of 0.873 (95% confidence interval 0.820–0.926) in the development cohort and 0.836 (0.751–0.921) in the hold-out validation cohort. The Brier score was 0.117 in the development cohort and 0.139 in the hold-out validation cohort. Calibration intercept and slope were 0.04 (−0.08–0.16) and 0.97 (0.79–1.18) in the development cohort, and 0.08 (−0.14–0.30) and 0.91 (0.68–1.15) in the hold-out validation cohort.
At the prespecified predicted-risk cutoff of 0.18, the model showed sensitivity and specificity of 0.82 and 0.77 in the development cohort and 0.75 and 0.74 in the hold-out validation cohort. Positive and negative predictive values were 0.39 and 0.96 in the development cohort and 0.39 and 0.93 in the hold-out validation cohort. The point-based composite score showed lower discrimination than the locked penalized model but retained useful screening performance, with area under the receiver operating characteristic curve values of 0.823 in the development cohort and 0.783 in the hold-out validation cohort. At the prespecified cutoff of ≥8 points, the score showed negative predictive values of 0.93 and 0.91 in the development and hold-out validation cohorts, respectively.
Benchmarking against established severity scores
Benchmark comparisons against established severity tools are shown in Table 6. The locked admission biochemical-coagulation model had higher discrimination than the Ranson score, Harmless Acute Pancreatitis Score, and systemic inflammatory response syndrome criteria in both cohorts. In the development cohort, the model did not differ significantly from Sequential Organ Failure Assessment score by DeLong testing (P = 0.12), but it showed higher discrimination than Acute Physiology and Chronic Health Evaluation II score (P = 0.03), Bedside Index for Severity in Acute Pancreatitis score (P = 0.01), Ranson score (P < 0.001), Harmless Acute Pancreatitis Score (P < 0.001), and systemic inflammatory response syndrome criteria (P < 0.001). In the hold-out validation cohort, differences were not significant versus Sequential Organ Failure Assessment score (P = 0.34), Acute Physiology and Chronic Health Evaluation II score (P = 0.08), or Bedside Index for Severity in Acute Pancreatitis score (P = 0.05), but remained significant versus Ranson score (P = 0.02), Harmless Acute Pancreatitis Score (P = 0.01), and systemic inflammatory response syndrome criteria (P = 0.02).
Risk stratification by point-based score
Risk stratification results are shown in Table 7. Patients were categorized into low (0–4 points), intermediate (5–8 points), high (9–12 points), and very high (≥13 points) score groups. MODS incidence increased from 3.5% (4/115) in the low-risk group to 8.9% (9/101), 33.3% (20/60), and 70.8% (17/24) in the intermediate-, high-, and very-high-risk groups, respectively. Intensive care unit admission increased from 8.7% to 23.8%, 60.0%, and 83.3% across the four groups. In-hospital mortality increased from 0.9% to 2.0%, 10.0%, and 25.0%, and infected necrosis or drainage increased from 2.6% to 8.9%, 23.3%, and 33.3%. Median length of stay increased from 7.6 (5.2–10.4) days in the low-risk group to 11.4 (8.0–16.5), 18.6 (13.0–26.8), and 24.9 (17.5–37.2) days in the higher-risk groups.
Sensitivity analyses
Sensitivity analyses are summarized in Supplementary Table 2. These analyses assessed whether the main findings depended on missing-data handling or baseline-value assignment. In the complete-case analysis, the retained predictors and direction of association were consistent with the primary imputed analysis. Discrimination changed only modestly, with areas under the receiver operating characteristic curves of 0.861 in the development cohort and 0.821 in the hold-out validation cohort. In the baseline-value sensitivity analysis using the worst eligible laboratory value within the first 24 h instead of the earliest value, the model showed area under the receiver operating characteristic curve values of 0.879 in the development cohort and 0.829 in the hold-out validation cohort. Score-stratified MODS incidence remained ordered across low, intermediate, high, and very-high-risk groups in both sensitivity analyses. These results indicate that the admission biochemical-coagulation workflow was not materially altered by the prespecified preprocessing alternatives.
DATA AVAILABILITY:
The de-identified dataset used to reproduce the main analyses, together with the data dictionary, unit-conversion table, and analysis scripts, has been deposited in Figshare with the unique data identifier https://doi.org/10.6084/m9.figshare.32565768.v1. Direct patient identifiers were removed prior to data deposition, and center identifiers were coded in accordance with institutional data-protection requirements. The repository contains the files required to reproduce the cohort description, predictor preprocessing, model development, score construction, hold-out validation, benchmarking analyses, sensitivity analyses, and figure-level outputs reported in this manuscript.
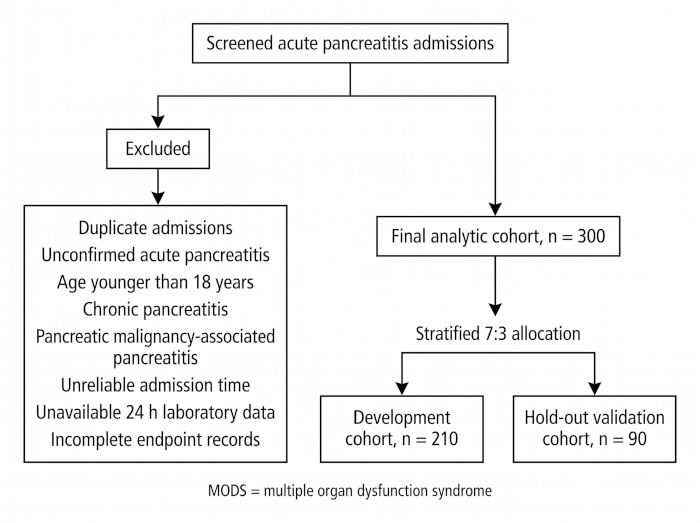
Figure 1: Patient screening and cohort allocation. The flowchart shows consecutive acute pancreatitis admissions screened across the participating centers, reasons for exclusion, the final analytic cohort, and stratified 7:3 allocation into the development and hold-out validation cohorts. The development cohort comprised 210 patients, and the hold-out validation cohort comprised 90 patients. MODS denotes multiple organ dysfunction syndrome. Please click here to view a larger version of this figure.
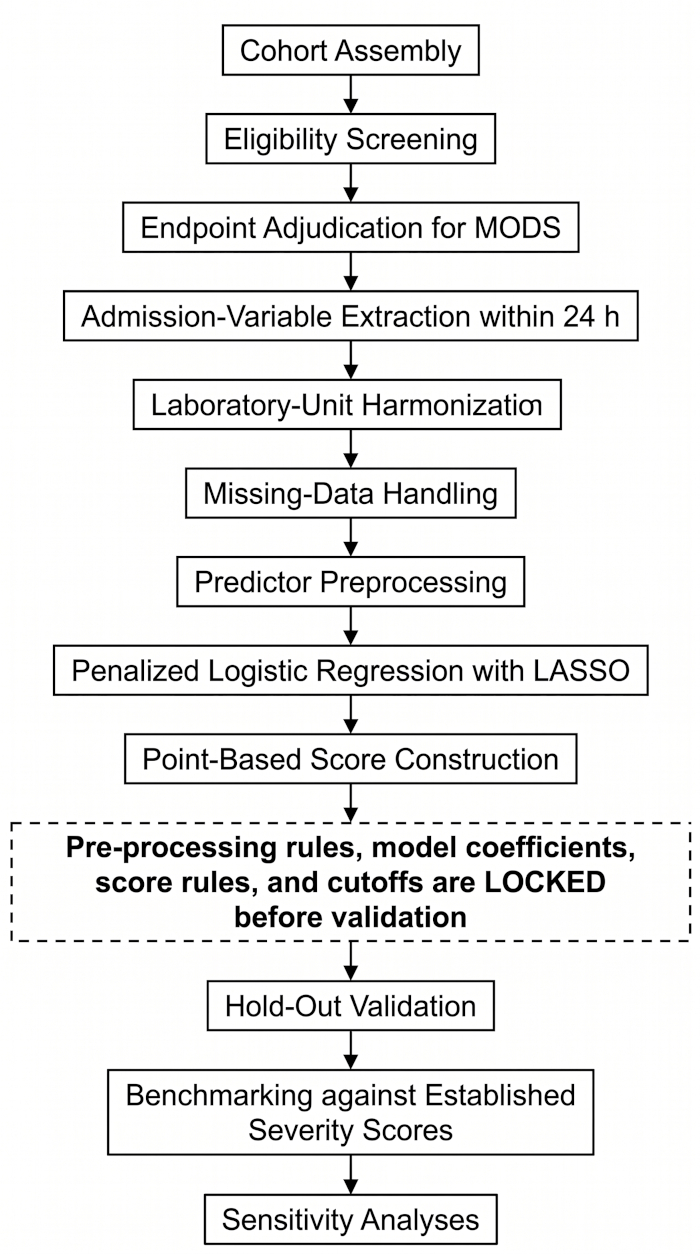
Figure 2: Reproducible analytical workflow for admission biochemical–coagulation score development. The schematic summarizes cohort assembly, eligibility screening, endpoint adjudication, admission-variable extraction, laboratory-unit harmonization, missing-data handling, predictor preprocessing, penalized model development, point-based score construction, and locked hold-out validation. All preprocessing rules, model coefficients, score-construction procedures, and cutoff definitions were established in the development cohort before evaluation in the hold-out validation cohort. Please click here to view a larger version of this figure.
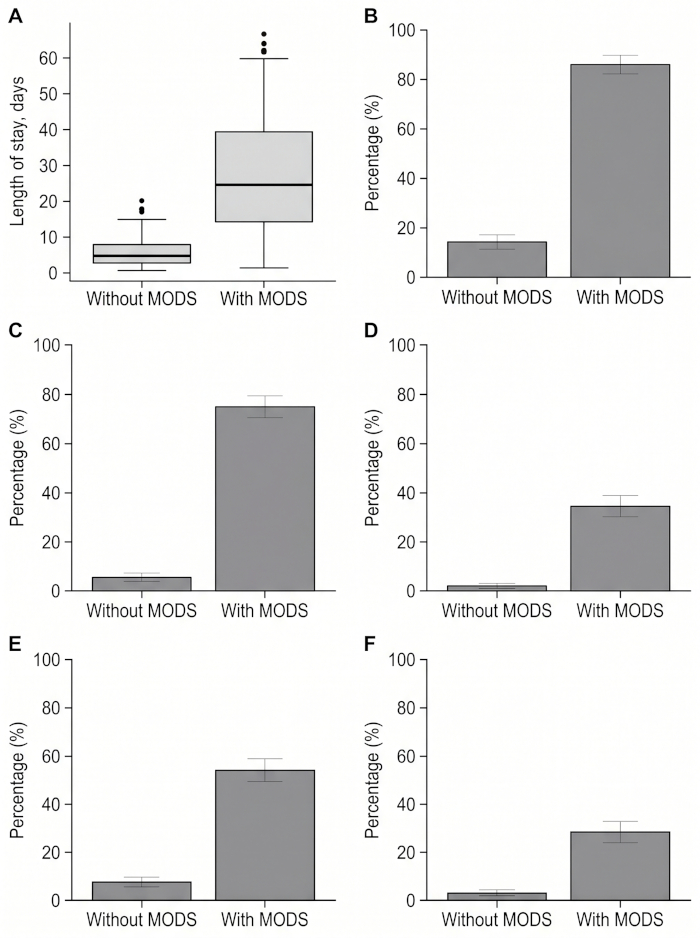
Figure 3: Crude clinical outcomes according to multiple organ dysfunction syndrome status. (A) Length of hospital stay in patients without and with multiple organ dysfunction syndrome. (B) Intensive care unit admission rates according to multiple organ dysfunction syndrome status. (C) Mechanical ventilation rates according to multiple organ dysfunction syndrome status. (D) Renal replacement therapy rates according to multiple organ dysfunction syndrome status. (E) Rates of infected necrosis or drainage procedures according to multiple organ dysfunction syndrome status. (F) In-hospital mortality rates according to multiple organ dysfunction syndrome status. All panels were generated from the locked 300-patient analytic cohort. MODS denotes multiple organ dysfunction syndrome; ICU, intensive care unit. Please click here to view a larger version of this figure.
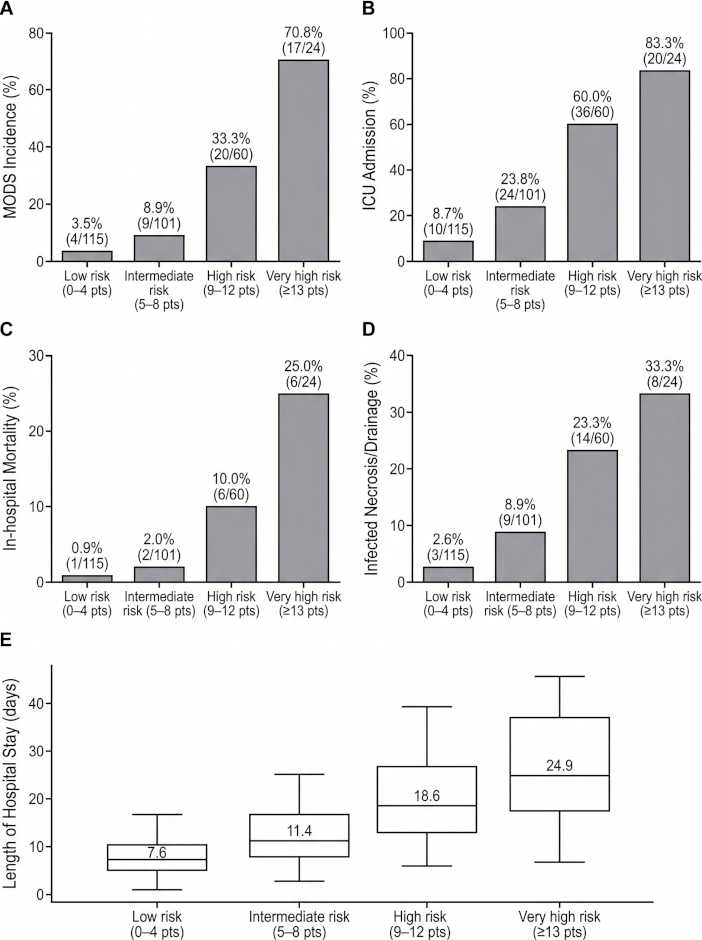
Figure 4: Observed outcome rates across point-based composite score strata. (A) Incidence of multiple organ dysfunction syndrome across the low-, intermediate-, high-, and very-high-risk groups. (B) Intensive care unit admission rates across the four score strata. (C) In-hospital mortality rates across the four score strata. (D) Rates of infected necrosis or drainage procedures across the four score strata. (E) Length of hospital stay across the four score strata. All panels were generated from the locked analytic dataset using the prespecified score categories of low risk (0–4 points), intermediate risk (5–8 points), high risk (9–12 points), and very high risk (≥13 points). MODS denotes multiple organ dysfunction syndrome; ICU, intensive care unit. Please click here to view a larger version of this figure.
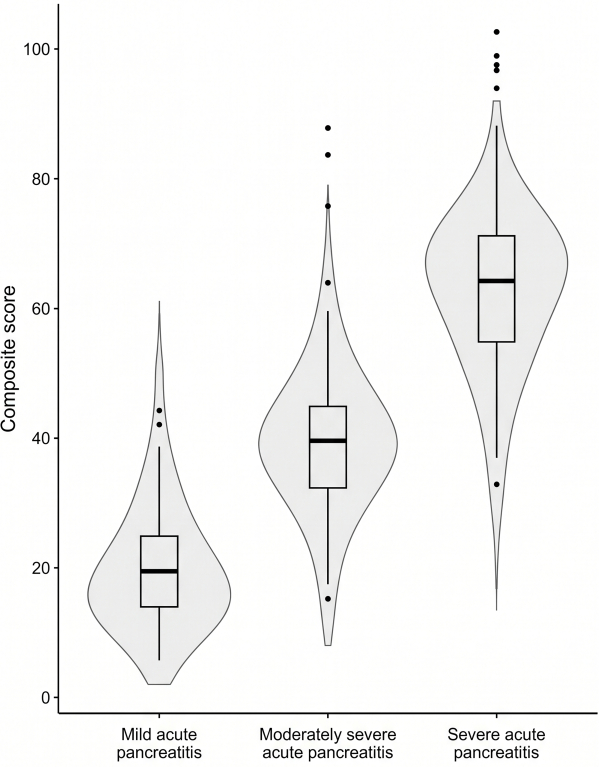
Figure 5: Distribution of the point-based composite score across revised Atlanta severity categories. The distribution of composite scores is shown for patients with mild, moderately severe, and severe acute pancreatitis. Composite scores shifted progressively upward across the three severity categories, indicating concordance between the admission biochemical–coagulation score and the revised Atlanta severity classification. The figure was generated from the locked 300-patient analytic cohort. AP denotes acute pancreatitis. Please click here to view a larger version of this figure.
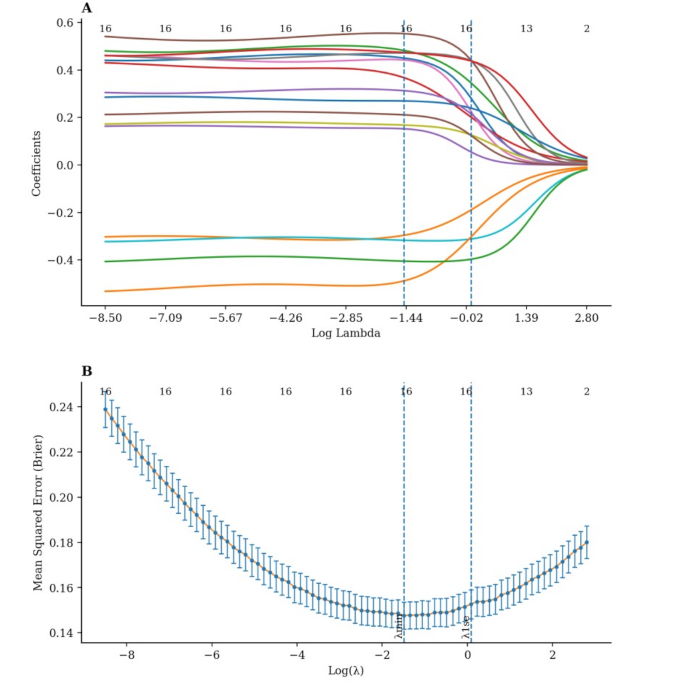
Figure 6: Penalized model development in the development cohort. (A) Least absolute shrinkage and selection operator coefficient trajectories for the candidate admission biochemical and coagulation predictors. (B) Repeated 10-fold cross-validation results were used to select the penalty parameter. The one-standard-error rule was applied to obtain a parsimonious locked model for score construction and hold-out validation. LASSO denotes least absolute shrinkage and selection operator; PT-INR, prothrombin time-international normalized ratio. Please click here to view a larger version of this figure.
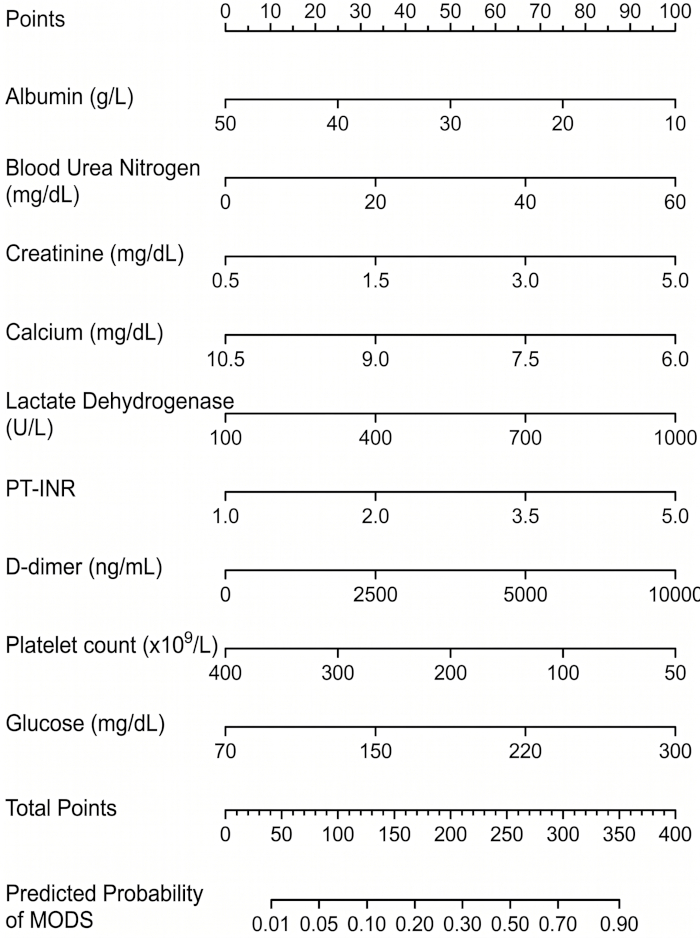
Figure 7: Nomogram based on the locked prediction model for individualized risk estimation. The nomogram incorporates the nine admission predictors retained by the locked penalized model: albumin, blood urea nitrogen, creatinine, calcium, lactate dehydrogenase, prothrombin time–international normalized ratio, D-dimer, platelet count, and glucose. Each predictor contributes points to a total score that corresponds to the estimated probability of multiple organ dysfunction syndrome. The nomogram was included as an interpretive aid, whereas the point-based composite score remained the primary practical bedside tool. MODS denotes multiple organ dysfunction syndrome; PT-INR, prothrombin time-international normalized ratio; FEU, fibrinogen-equivalent units. Please click here to view a larger version of this figure.
| Variable | Development cohort n=210 | Hold-out validation cohort n=90 | P value |
| Age, years | 54.0 ± 16.4 | 55.3 ± 15.2 | 0.486 |
| Male sex, n (%) | 130 (61.9) | 55 (61.1) | 0.898 |
| Body mass index, kg/m² | 25.0 (22.6–27.9) | 24.7 (22.2–27.5) | 0.293 |
| Time from symptom onset to admission, h | 13.2 (7.1–22.6) | 12.8 (6.8–21.7) | 0.612 |
| Etiology, n (%) | 0.931 | ||
| Biliary | 89 (42.4) | 38 (42.2) | |
| Hypertriglyceridemia | 65 (31.0) | 29 (32.2) | |
| Alcohol-related | 19 (9.0) | 8 (8.9) | |
| Idiopathic | 25 (11.9) | 11 (12.2) | |
| Other | 12 (5.7) | 4 (4.4) | |
| Previous pancreatitis, n (%) | 31 (14.8) | 12 (13.3) | 0.742 |
| Smoking history, n (%) | 58 (27.6) | 24 (26.7) | 0.868 |
| Diabetes mellitus, n (%) | 37 (17.6) | 17 (18.9) | 0.795 |
| Hypertension, n (%) | 62 (29.5) | 28 (31.1) | 0.784 |
| Chronic kidney disease, n (%) | 8 (3.8) | 4 (4.4) | 0.797 |
| Admission heart rate, beats/min | 92.4 ± 15.8 | 93.1 ± 16.2 | 0.726 |
| Mean arterial pressure, mmHg | 88.6 ± 12.4 | 87.9 ± 11.8 | 0.65 |
| Systemic inflammatory response syndrome, n (%) | 72 (34.3) | 30 (33.3) | 0.871 |
| Bedside Index for Severity in Acute Pancreatitis score | 1.0 (0.0–2.0) | 1.0 (0.0–2.0) | 0.842 |
| Sequential Organ Failure Assessment score | 1.0 (0.0–2.0) | 1.0 (0.0–2.0) | 0.796 |
| Acute Physiology and Chronic Health Evaluation II score | 7.0 (5.0–10.0) | 7.0 (5.0–10.0) | 0.884 |
| Multiple organ dysfunction syndrome, n (%) | 35 (16.7) | 15 (16.7) | 1 |
| White blood cell count, ×10⁹/L | 12.8 ± 4.7 | 12.9 ± 4.9 | 0.865 |
| C-reactive protein, mg/L | 70.6 (32.8–141.5) | 72.4 (35.1–145.9) | 0.778 |
| Glucose, mmol/L | 9.1 (7.4–11.8) | 9.0 (7.2–11.6) | 0.691 |
| Total calcium, mmol/L | 2.05 ± 0.18 | 2.04 ± 0.19 | 0.672 |
| Blood urea nitrogen, mmol/L | 6.9 (5.2–9.4) | 7.1 (5.3–9.6) | 0.584 |
| Creatinine, μmol/L | 80.2 (64.5–104.8) | 81.1 (65.1–106.2) | 0.731 |
| Albumin, g/L | 35.2 ± 5.1 | 35.0 ± 5.0 | 0.754 |
| Lactate dehydrogenase, U/L | 270.8 (212.5–356.7) | 275.6 (216.2–361.4) | 0.637 |
| Prothrombin time-international normalized ratio | 1.09 (1.02–1.18) | 1.10 (1.03–1.19) | 0.694 |
| D-dimer, mg/L fibrinogen-equivalent units | 1.84 (0.92–3.82) | 1.91 (0.95–3.96) | 0.744 |
| Platelet count, ×10⁹/L | 203.6 ± 68.4 | 201.8 ± 66.9 | 0.836 |
Table 1: Baseline characteristics of patients in the development and hold-out validation cohorts. Baseline demographic, clinical, severity score, biochemical, and coagulation variables are compared between the development and hold-out validation cohorts. Continuous variables are presented as mean ± standard deviation or median (interquartile range), and categorical variables as n (%). P values are used for descriptive comparisons between cohorts.
| Variable | Non-MODS group n = 250 | MODS group n = 50 | P value |
| White blood cell count, ×10⁹/L | 12.3 ± 4.6 | 14.4 ± 5.2 | 0.008 |
| Neutrophil-to-lymphocyte ratio | 9.0 (5.9–14.2) | 13.4 (9.1–21.3) | <0.001 |
| C-reactive protein, mg/L | 61.4 (29.2–123.8) | 138.6 (86.9–226.7) | <0.001 |
| Procalcitonin, ng/mL | 0.43 (0.18–1.02) | 1.25 (0.56–3.28) | <0.001 |
| Lactate, mmol/L | 1.7 (1.2–2.4) | 2.7 (2.0–4.0) | 0.004 |
| Glucose, mmol/L | 8.9 (7.3–11.4) | 11.2 (8.9–15.1) | 0.01 |
| Total calcium, mmol/L | 2.06 ± 0.17 | 1.96 ± 0.21 | 0.013 |
| Blood urea nitrogen, mmol/L | 6.6 (5.1–8.9) | 9.4 (7.4–13.2) | <0.001 |
| Creatinine, μmol/L | 77.1 (62.4–97.6) | 108.9 (84.7–163.4) | <0.001 |
| Alanine aminotransferase, U/L | 46.2 (25.6–93.8) | 58.7 (31.5–119.4) | 0.084 |
| Total bilirubin, μmol/L | 18.6 (12.3–31.7) | 22.1 (14.2–38.9) | 0.038 |
| Albumin, g/L | 35.9 ± 4.8 | 32.5 ± 5.6 | <0.001 |
| Lactate dehydrogenase, U/L | 254.6 (203.2–329.1) | 372.4 (289.8–512.3) | <0.001 |
| Platelet count, ×10⁹/L | 207.4 ± 67.2 | 190.3 ± 72.5 | 0.096 |
| Prothrombin time, s | 12.7 (11.8–13.9) | 14.1 (12.9–15.7) | 0.002 |
| Prothrombin time-international normalized ratio | 1.08 (1.02–1.16) | 1.22 (1.10–1.38) | 0.002 |
| Activated partial thromboplastin time, s | 31.8 (28.4–36.5) | 36.9 (31.7–42.8) | 0.006 |
| Fibrinogen, g/L | 4.12 ± 1.18 | 4.31 ± 1.29 | 0.268 |
| D-dimer, mg/L fibrinogen-equivalent units | 1.48 (0.78–3.16) | 4.62 (2.10–8.95) | <0.001 |
Table 2: Admission biochemical and coagulation profiles according to multiple organ dysfunction syndrome status. Laboratory indices represent the earliest eligible measurement obtained within 24 h after hospital admission. Continuous variables are presented as mean ± standard deviation or median (interquartile range). P values are descriptive comparisons between patients who developed multiple organ dysfunction syndrome and those who did not. These comparisons were used to characterize admission differences and were not used alone for predictor selection.
| Predictor retained in locked model | Direction associated with higher MODS risk | Scaled unit for interpretation | Descriptive odds ratio | 95% confidence interval | Modeling role |
| Albumin | Lower value | Per 5 g/L decrease | 1.29 | 1.13–1.47 | Core score component |
| Blood urea nitrogen | Higher value | Per 1 mmol/L increase | 1.12 | 1.06–1.18 | Core score component |
| Creatinine | Higher value | Per 10 μmol/L increase | 1.05 | 1.02–1.09 | Core score component |
| Total calcium | Lower value | Per 0.1 mmol/L decrease | 1.18 | 1.07–1.30 | Core score component |
| Lactate dehydrogenase | Higher value | Per 100 U/L increase | 1.21 | 1.07–1.37 | Core score component |
| Prothrombin time-international normalized ratio | Higher value | Per 0.1 increase | 1.14 | 1.05–1.25 | Core score component |
| D-dimer | Higher value | Per 1.0 mg/L fibrinogen-equivalent units increase | 1.09 | 1.02–1.17 | Core score component |
| Platelet count | Lower value | Per 50 × 10⁹/L decrease | 1.16 | 1.01–1.34 | Core score component |
| Glucose | Higher value | Per 1 mmol/L increase | 1.05 | 1.00–1.10 | Optional modifier |
Table 3: Retained predictors from the locked penalized model and descriptive post-selection estimates. The table shows predictors retained by the locked least absolute shrinkage and selection operator penalized logistic model and descriptive post-selection estimates for clinical interpretation. Odds ratios are presented for the indicated scaled units. These estimates are not treated as confirmatory inference after penalized selection.
| Score Component | Category | Points Assigned |
| Albumin, g/L | ≥38 | 0 |
| 34–37.9 | 1 | |
| 30–33.9 | 2 | |
| <30 | 3 | |
| Blood urea nitrogen, mmol/L | <6.5 | 0 |
| 6.5–8.9 | 1 | |
| 9.0–12.9 | 2 | |
| ≥13.0 | 3 | |
| Creatinine, μmol/L | <80 | 0 |
| 80–109 | 1 | |
| 110–169 | 2 | |
| ≥170 | 3 | |
| Total calcium, mmol/L | ≥2.10 | 0 |
| 2.00–2.09 | 1 | |
| 1.90–1.99 | 2 | |
| <1.90 | 3 | |
| Lactate dehydrogenase, U/L | <250 | 0 |
| 250–349 | 1 | |
| 350–499 | 2 | |
| ≥500 | 3 | |
| Prothrombin time-international normalized ratio | <1.10 | 0 |
| 1.10–1.19 | 1 | |
| 1.20–1.39 | 2 | |
| ≥1.40 | 3 | |
| D-dimer, mg/L fibrinogen-equivalent units | <1.0 | 0 |
| 1.0–2.9 | 1 | |
| 3.0–5.9 | 2 | |
| ≥6.0 | 3 | |
| Platelet count, ×10⁹/L | ≥200 | 0 |
| 150–199 | 1 | |
| 100–149 | 2 | |
| <100 | 3 | |
| Glucose, mmol/L | <10.0 | 0 |
| ≥10.0 | 1 |
Table 4: Construction of the admission biochemical–coagulation composite score.
The point-based composite score was derived from the locked penalized model and translated into clinically interpretable bedside categories. Points were assigned according to the direction and relative contribution of retained predictors. Total points are calculated by summing all retained score components. Glucose was retained as an optional modifier because its association was weaker than that of the core biochemical–coagulation components, but remained directionally consistent with increased risk.
| Tool | Cohort | AUC | Brier score | Calibration intercept | Calibration slope | Cutoff | Sensitivity | Specificity | PPV | NPV |
| (95% CI) | (95% CI) | (95% CI) | ||||||||
| Locked penalized model | Development cohort | 0.873 (0.820–0.926) | 0.117 | 0.04 (−0.08 to 0.16) | 0.97 (0.79–1.18) | Predicted risk ≥0.18 | 0.82 | 0.77 | 0.39 | 0.96 |
| Locked penalized model | Hold-out validation cohort | 0.836 (0.751–0.921) | 0.139 | 0.08 (−0.14 to 0.30) | 0.91 (0.68–1.15) | Predicted risk ≥0.18 | 0.75 | 0.74 | 0.39 | 0.93 |
| Point-based composite score | Development cohort | 0.823 (0.758–0.888) | 0.132 | Not applicable | Not applicable | ≥8 points | 0.76 | 0.72 | 0.35 | 0.93 |
| Point-based composite score | Hold-out validation cohort | 0.783 (0.684–0.882) | 0.151 | Not applicable | Not applicable | ≥8 points | 0.7 | 0.69 | 0.31 | 0.91 |
Table 5: Performance of the locked penalized model and point-based composite score. Discrimination, calibration, and threshold-based performance are shown for the development and hold-out validation cohorts. Discrimination is reported as the area under the receiver operating characteristic curve with 95% confidence interval. Calibration is summarized by the Brier score, calibration intercept, and calibration slope. Threshold metrics are reported at prespecified cutoffs: predicted risk ≥0.18 for the locked penalized model and score ≥8 points for the point-based composite score.
| Prediction Tool | Development AUC | DeLong P value vs locked model | Hold-out Validation AUC | DeLong P value vs locked model |
| (95% CI) | (Development) | (95% CI) | (Validation) | |
| Locked biochemical–coagulation model | 0.873 (0.820–0.926) | Reference | 0.836 (0.751–0.921) | Reference |
| Sequential Organ Failure Assessment score | 0.842 (0.780–0.904) | 0.12 | 0.810 (0.712–0.908) | 0.34 |
| Acute Physiology and Chronic Health Evaluation II score | 0.812 (0.744–0.880) | 0.03 | 0.790 (0.682–0.898) | 0.08 |
| Bedside Index for Severity in Acute Pancreatitis score | 0.795 (0.724–0.866) | 0.01 | 0.765 (0.648–0.882) | 0.05 |
| Ranson score | 0.742 (0.661–0.823) | <0.001 | 0.701 (0.577–0.825) | 0.02 |
| Harmless Acute Pancreatitis Score | 0.701 (0.618–0.784) | <0.001 | 0.688 (0.560–0.816) | 0.01 |
| Systemic inflammatory response syndrome criteria | 0.684 (0.598–0.770) | <0.001 | 0.672 (0.541–0.803) | 0.02 |
Table 6: Benchmark comparison with established severity tools. The locked admission biochemical–coagulation model is compared with established acute pancreatitis severity or organ dysfunction tools calculated from the same admission window when data were available. Area under the receiver operating characteristic curve values with 95% confidence intervals are shown for the development and hold-out validation cohorts. Paired DeLong tests compare each benchmark tool with the locked biochemical–coagulation model within each cohort.
| Risk category | Score range | Patients, n | MODS incidence, n (%) | ICU admission, n | Mechanical ventilation, n (%) | Renal replacement therapy, n (%) | In-hospital mortality, n (%) | Infected necrosis or drainage, n (%) | Length of stay, days |
| (%) | |||||||||
| Low risk | 0–4 | 115 | 4 (3.5) | 10 (8.7) | 3 (2.6) | 1 (0.9) | 1 (0.9) | 3 (2.6) | 7.6 (5.2–10.4) |
| Intermediate risk | 5–8 | 101 | 9 (8.9) | 24 (23.8) | 9 (8.9) | 4 (4.0) | 2 (2.0) | 9 (8.9) | 11.4 (8.0–16.5) |
| High risk | 9–12 | 60 | 20 (33.3) | 36 (60.0) | 18 (30.0) | 10 (16.7) | 6 (10.0) | 14 (23.3) | 18.6 (13.0–26.8) |
| Very high risk | ≥13 | 24 | 17 (70.8) | 20 (83.3) | 13 (54.2) | 7 (29.2) | 6 (25.0) | 8 (33.3) | 24.9 (17.5–37.2) |
Table 7: Risk stratification by point-based composite score. Patients are categorized into low-, intermediate-, high-, and very high-risk groups based on total score points. Observed multiple organ dysfunction syndrome incidence and key clinical outcomes are reported across score strata. Categorical outcomes are presented as n (%), and length of stay is presented as median (interquartile range).
Supplementary Table 1: Operational criteria for endpoint adjudication of multiple organ dysfunction syndrome. The table defines the prespecified organ-system criteria used to adjudicate respiratory, cardiovascular, renal, hepatic, coagulation, and neurological dysfunction. The final endpoint was assigned when dysfunction of two or more organ systems occurred during hospitalization. Two trained reviewers independently assessed each case, and disagreements were resolved by a third senior reviewer.Please click here to download this file.
Supplementary Table 2: Sensitivity analyses for missing-data handling and baseline-value assignment. The table summarizes the primary imputed analysis and prespecified sensitivity analyses, including complete-case analysis, worst-value baseline assignment within the first 24 h, and center-adjusted performance checking. The analyses evaluate whether model discrimination, Brier score, retained predictor pattern, and score-stratified risk gradients were materially altered by preprocessing alternatives.Please click here to download this file.
Discussion
Acute pancreatitis-associated multiple organ dysfunction syndrome (MODS) may evolve within a short period after hospital admission, particularly in patients with early systemic inflammation, endothelial injury, impaired tissue perfusion, and metabolic instability. The present protocol was designed around this admission window because the first 24 h often determine whether a patient remains under routine ward observation or requires closer reassessment, increased monitoring, or preparation for organ-support pathways. The findings showed that routinely available biochemical and coagulation variables, when processed through a locked and reproducible modeling workflow, could be organized into an interpretable score for early MODS risk stratification in acute pancreatitis11. This approach is consistent with the clinical reality that single biomarkers or delayed severity classifications may not fully capture the early systemic deterioration pattern seen in high-risk acute pancreatitis12.
The biological rationale for combining biochemical and coagulation variables is clinically plausible. Severe acute pancreatitis is not driven by a single isolated pathway; systemic inflammation, endothelial activation, capillary leakage, renal hypoperfusion, coagulation activation, and microcirculatory disturbance may reinforce one another during early deterioration. The retained biochemical predictors reflected this multi-axis process. Lower albumin may indicate inflammation-related vascular leakage and reduced physiological reserve, while higher blood urea nitrogen and creatinine are consistent with hypovolemia, renal hypoperfusion, or early kidney injury. Lower calcium, higher lactate dehydrogenase, and higher glucose may reflect metabolic stress, tissue injury, and more severe systemic inflammatory derangement13. The coagulation predictors added a complementary signal: prolonged prothrombin time-international normalized ratio, elevated D-dimer, and lower platelet count may indicate coagulation activation, fibrin turnover, platelet consumption, and microcirculatory impairment before overt organ dysfunction is fully established14. The stepwise increase in MODS incidence and secondary outcomes across score strata therefore suggests that the score captured a clinically coherent pattern of early systemic deterioration rather than isolated laboratory abnormalities.
A key methodological contribution of this study is the emphasis on reproducibility. The revised protocol fixed the admission window, used the earliest eligible laboratory value within 24 h, applied explicit unit-harmonization rules, defined missingness thresholds, standardized preprocessing, and restricted model tuning to the development cohort. These steps directly affect whether the score can be reproduced across institutions. For example, D-dimer reporting varies across laboratories, and fibrinogen-equivalent units cannot be assumed when local reports use D-dimer units without a validated conversion factor. Similarly, missing laboratory values may reflect local testing pathways rather than a random absence of data15. Several protocol steps are therefore critical: the 24 h baseline rule must be applied consistently, post-MODS laboratory values must not be used for predictor construction, endpoint adjudication should follow prespecified organ-system criteria, laboratory values must be converted to common target units before pooling, and the hold-out validation cohort must not be used for feature selection, coefficient recalibration, or cutoff tuning16.
The workflow can be modified for different institutional settings, but such modifications should remain prespecified. If a candidate variable has excessive missingness because it is not routinely measured at admission, it should be excluded from model development rather than imputed beyond a defensible threshold. If D-dimer units cannot be harmonized to fibrinogen-equivalent units, the value should be treated as non-harmonizable rather than converted using an unsupported assumption. If local laboratories use different assay platforms, the primary analysis may retain absolute clinical values, while sensitivity analyses include center code or assay platform as adjustment factors. If the number of MODS events is smaller than expected, the modeling strategy should favor stronger shrinkage, fewer retained predictors, or a simpler score structure rather than expanding the model to fit unstable signals17. Practical troubleshooting should also include checking whether coagulation tests are routinely ordered at admission, whether predictor distributions differ unexpectedly across centers, whether validation thresholds were inadvertently retuned, and whether every figure panel matches the locked analytic dataset18.
The findings should be interpreted with several limitations. The hold-out validation cohort was derived from the same retrospective multicenter dataset and therefore represents internal hold-out validation rather than independent external validation. The event count was limited, increasing the risk of unstable predictor retention even under penalized modeling. Descriptive post-selection odds ratios were included only to support clinical interpretation and should not be treated as confirmatory inference. Some endpoint components depended on the quality of documentation in electronic medical records, and unmeasured center-level differences in clinical practice may have influenced organ-support decisions. Decision-curve analysis was not retained in the revised analysis set; therefore, the manuscript does not claim clinical net benefit across threshold probabilities19. The score should also not replace established severity assessment, repeated clinical examination, imaging when indicated, or clinician judgment. Low scores may support routine observation and standard reassessment, but they do not exclude later deterioration; higher scores should be interpreted as prompts for closer monitoring, repeated laboratory assessment, and earlier preparation for organ-support pathways rather than as fixed treatment mandates20.
Overall, this study presents a reproducible admission biochemical–coagulation scoring workflow for early risk stratification of MODS in acute pancreatitis. The locked penalized model and point-based score showed consistent discrimination and ordered risk gradients in the development and hold-out validation cohorts, while sensitivity analyses suggested that the main findings were not materially altered by prespecified missing-data or baseline-value alternatives. The main value of the approach lies in organizing routinely available admission laboratory data into an interpretable early risk signal that may support triage, adjust monitoring intensity, and prepare for organ-support pathways21. Future work should prioritize prospective external validation across hospitals with different laboratory platforms, assessment of real-time calibration, comparison with electronic risk calculators derived from the same locked model, and evaluation of whether score-guided monitoring pathways reduce delayed escalation without increasing unnecessary intensive care use22.
Disclosures
The authors declare that they have no conflicts of interest relevant to this study.
Acknowledgements
The authors would like to thank all clinicians and laboratory staff involved in the diagnosis, treatment, and data collection of patients with acute pancreatitis. We are also grateful to the patients whose clinical data enabled this study. Their contribution is sincerely appreciated.
Materials
| Name | Company | Catalog Number | Comments |
|---|---|---|---|
| Name | Company Name | Catalog Number / URL | Comments |
| R statistical software | R Foundation for Statistical Computing | Version 4.3.2 https://www.r-project.org/ | Statistical computing environment used for data preprocessing, model development, validation, and figure generation. |
| caret R package | CRAN / Max Kuhn | Version 6.0-94 https://cran.r-project.org/package=caret | Used for the stratified 7:3 development and hold-out validation split with createDataPartition. |
| glmnet R package | CRAN / glmnet authors | Version 4.1-8 https://cran.r-project.org/package=glmnet | Used for LASSO penalized logistic regression with binomial family and alpha = 1. |
| mice R package | CRAN / amices project | Version 3.16.0 https://cran.r-project.org/package=mice | Used for multiple imputation by chained equations with 20 imputed datasets and 20 iterations. |
| pROC R package | CRAN / pROC authors | Version 1.18.5 https://cran.r-project.org/package=pROC | Used for ROC analysis, AUC estimation, confidence intervals, and DeLong comparisons. |
| cobas 8000 modular analyzer series | Roche Diagnostics | 05641446001 / SYS_128 https://diagnostics.roche.com/global/en/products/systems/cobas-8000-analyzer-series-sys-128.html | Biochemical and immunochemical assays. Verify the analyzer model and catalog information against the participating laboratory records before submission. |
| XN-1000 Automated Hematology Analyzer | Sysmex Corporation | Model XN-1000 https://www.sysmex.com/en-us/lab-solutions/hematology/xn-series/xn-1000 | Complete blood count variables, including white blood cell and platelet counts. Verify against the participating laboratory records before submission. |
| CS-5100 Automated Blood Coagulation Analyzer | Sysmex Corporation | Model CS-5100 https://www.sysmex.com/en-us/lab-solutions/hemostasis/sysmex-cs-5100 | Coagulation variables, including PT, APTT, fibrinogen, and D-dimer. Verify against the participating laboratory records before submission. |
| ABL90 FLEX PLUS blood gas analyzer | Radiometer Medical ApS | Model ABL90 FLEX PLUS https://www.radiometer.com/en/products/blood-gas-testing/abl90-flex-plus-blood-gas-analyzer | Lactate measurement, if this platform was used. Verify against the participating laboratory records before submission. |
| Electronic medical record system | Participating hospitals | Institution-specific; not applicable | Used to retrieve admission notes, progress notes, ICU records, procedures, vital signs, and discharge records. Replace with the actual vendor and system name when available. |
| Laboratory information system | Participating hospitals | Institution-specific; not applicable | Used to retrieve laboratory timestamps, raw values, units, and harmonized data. Replace with the actual vendor and system name when available. |
| Endpoint adjudication form | Study team | Custom study document; not applicable | Standardized form used by two reviewers and a third senior reviewer to adjudicate MODS status and onset. |
| Data dictionary and unit-conversion table | Study team | Custom study document; not applicable | Defines variable names, target units, conversion rules, missingness flags, center codes, and analysis-ready formats. |
References
- Banks PA, et al. Classification of acute pancreatitis-2012: revision of the Atlanta classification and definitions by international consensus. Gut. 2013;62(1):102-111.
- Wu BU, et al. The early prediction of mortality in acute pancreatitis: a large population-based study. Gut. 2008;57(12):1698-1703.
- Tenner S, et al. American College of Gastroenterology Guidelines: Management of Acute Pancreatitis. Am J Gastroenterol. 2024;119(3):419-437.
- Lee DW, Cho CM. Predicting severity of acute pancreatitis. Medicina (Kaunas). 2022;58(6):787.
- Metri A, Bush N, Singh VK. Predicting the severity of acute pancreatitis: current approaches and future directions. Surg Open Sci. 2024;19:109-117.
- Efthimiou O, et al. Developing clinical prediction models: a step-by-step guide. BMJ. 2024;386.
- Collins GS, Reitsma JB, Altman DG, Moons KGM. Transparent reporting of a multivariable prediction model for individual prognosis or diagnosis: the TRIPOD statement. Ann Intern Med. 2015;162(1):55-63.
- Li L, et al. Coagulopathy and acute pancreatitis: pathophysiology and clinical treatment. Front Immunol. 2024;15:1477160.
- Wan J, et al. Serum D-dimer levels at admission for prediction of outcomes in acute pancreatitis. BMC Gastroenterol. 2019;19:67.
- World Medical Association. World Medical Association Declaration of Helsinki: ethical principles for medical research involving human subjects. JAMA. 2013;310(20):2191-2194.
- Garg PK, Singh VP. Organ failure due to systemic injury in acute pancreatitis. Gastroenterology. 2019;156(7):2008-2023.
- Wu BU. Prognosis in acute pancreatitis. CMAJ. 2011;183(6):673-677.
- Wang H, et al. Early predictive value of different indicators for persistent organ failure in acute pancreatitis: a systematic review and network meta-analysis. J Clin Gastroenterol. 2024;58(3):307-314.
- Dumnicka P, et al. The interplay between inflammation, coagulation and endothelial injury in the early phase of acute pancreatitis: clinical implications. Int J Mol Sci. 2017;18(2):354.
- Favaloro EJ, Dean E. Variability in D-dimer reporting revisited. Pathology. 2021;53(4):538-540.
- Wolff RF, et al. PROBAST: A tool to assess the risk of bias and applicability of prediction model studies. Ann Intern Med. 2019;170(1):51-58.
- Riley RD, et al. Calculating the sample size required for developing a clinical prediction model. BMJ. 2020;368.
- Collins GS, et al. Evaluation of clinical prediction models (part 1): from development to external validation. BMJ. 2024;384.
- Vickers AJ, Elkin EB. Decision curve analysis: a novel method for evaluating prediction models. Med Decis Making. 2006;26(6):565-574.
- Riley RD, van der Windt D, Croft P, Moons KGM, editors. Prognosis Research in Healthcare: Concepts, Methods, and Impact. Oxford University Press; Oxford; 2019.
- Wu H, Li J, Zhao J, Li S. A new scoring system can be applied to predict the organ failure related events in acute pancreatitis accurately and rapidly. Pancreatology. 2020;20(4):622-628.
- Riley RD, et al. Evaluation of clinical prediction models (part 2): how to undertake an external validation study. BMJ. 2024;384.