The delivery of genome editors as RNAs is a particularly potent means of modifying the genomes of primary mammalian cells and cell lines. The goal of this protocol is to deliver genome editors as mRNA into primary mammalian cells and cell lines, followed by targeted Illumina sequencing and analysis to quantify editing outcomes.
Method Article
Genome Editing in Primary Mammalian Cells via Electroporation of Editor RNA
In This Article
Summary
Abstract
CRISPR editors including nucleases, base editors, and prime editors can efficiently correct disease-causing genetic variants or disrupt target genes. Editing outcomes are commonly evaluated in cultured primary cells, patient-derived cells, or engineered cell lines to study the impact of genetic variation or as a first step before initiating animal studies or clinical translation. Delivery of editors as mRNA together with synthetic guide RNAs into mammalian cells can improve editing efficiency relative to plasmid-based approaches and prevent issues such as DNA integration or off-target editing from sustained expression. This article presents a workflow to prepare genome editor mRNA by in vitro transcription (IVT), including co-transcriptional capping and chemically-modified nucleotides, electroporate editor mRNA and guide RNAs into primary human fibroblasts, induced pluripotent stem cells (iPSCs), or lymphoblastoid cell lines (LCLs), and quantify editing outcomes by targeted amplicon sequencing on an Illumina platform followed by analysis using CRISPResso2. This workflow enables quantitative benchmarking of guide RNAs, electroporation parameters, and editor variants, and supports downstream applications including single-cell cloning, phenotypic assays, preclinical animal studies, and therapeutic development.
Introduction
Efficient genome editing in primary mammalian cells supports the generation of genetic models and the preclinical evaluation of candidate therapeutic strategies. Recent advances in CRISPR-based technologies, including base editing and prime editing, enable precise nucleotide modifications without introducing double-strand DNA breaks, thereby improving the purity of editing outcomes1,2. These technologies have been successfully applied in disease modeling and therapeutic genome editing studies, including strategies to correct variants that lead to sickle cell disease3 and cystic fibrosis4.
A particularly efficient strategy to deliver genome editing components to mammalian cells is electroporation of in vitro transcribed (IVT) mRNA encoding the editing enzyme combined with synthetic guide RNAs (gRNAs). Delivery of mRNA enables transient expression of genome editors, minimizing prolonged nuclease activity and reducing the likelihood of off-target editing events. Advances in IVT technology have improved the efficiency, yield, and quality of mRNA synthesis4,5,6. Plasmid DNA templates and PCR-derived DNA templates are each commonly used for in vitro transcription and each present distinct advantages and limitations. In this protocol, PCR-generated templates are preferred to avoid issues associated with propagating long poly(A) tracts in plasmids, which are prone to recombination and length variability. However, using PCR templates as described in this protocol does require an expensive reverse primer that harbors the 120-nucleotide poly(A) tail, and PCR may be more error prone than bacterial propagation of plasmids for sequences not encoded in the primers. As an alternative, commercial providers such as Elegen and 4basebio can supply high-fidelity DNA templates, offering a reliable, though more costly, option for generating transcription templates.
Careful guide RNA design is another critical component of successful genome editing experiments. Several computational tools have been developed to assist researchers in identifying optimal gRNA sequences based on predicted on-target efficiency and minimal off-target activity. Widely used platforms include CHOPCHOP and CRISPOR, which enable identification of guide sequences compatible with protospacer adjacent motif (PAM) requirements of Cas enzymes and provide scoring metrics to prioritize candidate guides with high predicted activity and specificity7,8. The fundamental principles and best practices for guide RNA design have been extensively described in the CRISPR literature9,10,11,12,13.
Electroporation is commonly used to deliver genome editing reagents to mammalian cells because it can achieve high delivery efficiency in cell types that are typically resistant to lipid-based transfection approaches. Electroporation transiently permeabilizes the cell membrane, allowing exogenous nucleic acids such as mRNA and gRNAs to enter the cytoplasm. Optimized electroporation protocols have been developed for multiple mammalian cell types, including primary cells, fibroblasts, lymphoblastoid cell lines, and induced pluripotent stem cells14. Commercial electroporation platforms such as the Lonza 4D and Amaxa systems provide cell-type-specific programs and reagents designed to improve delivery efficiency while maintaining cell viability. High-throughput electroporation systems such as the Amaxa 96-well Shuttle platform further enable scalable genome editing experiments across multiple experimental conditions. The Neon electroporation system is also commonly used but is not the focus of this protocol.
Following delivery of genome editing components, editing outcomes are typically assessed using targeted next-generation sequencing (NGS) of the genomic region surrounding the editing site. Sequencing libraries are generated by PCR amplification of the target locus, followed by indexing and high-throughput sequencing. The resulting sequencing reads are analyzed using specialized bioinformatic pipelines designed for genome editing experiments. In this protocol, editing outcomes are quantified using CRISPResso2, a widely used computational platform that enables detailed analysis of genome editing outcomes from sequencing data15. CRISPResso2 aligns sequencing reads to a reference sequence and quantifies editing outcomes, including overall editing efficiency, insertion–deletion (indel) frequencies, precise nucleotide substitutions, and editing distributions across the target region. The software also provides graphical visualizations and statistical summaries that facilitate comparison between experimental conditions and optimization of editing parameters.
Together, the integration of high-quality IVT mRNA production, optimized delivery by electroporation, and high-resolution sequencing analysis provides a robust workflow for evaluating genome editing strategies in cultured cells (Figure 1). This approach enables iterative optimization of editing efficiency, specificity, and experimental parameters prior to advancing genome editing strategies toward in vivo studies and potential therapeutic applications.
Protocol
Ethics statement:
All procedures involving human-derived cell lines were performed in accordance with institutional guidelines and approved protocols.
1. Generate linear DNA template using PCR
Caution: Perform all RNA steps using RNase-free consumables and work surfaces. Consider the listed mRNA editors and their different variants when selecting the appropriate editor for the intended genomic modification (Table 1).
- Assemble the PCR reaction on plasmid DNA that was extracted from bacteria using a miniprep or midiprep kit. Use 20 ng of plasmid DNA per 50 µL PCR reaction with the enzyme NEBNext Ultra II Q5 Master Mix, assembling the PCR as described in Table 2.
- Use a forward primer that corrects the inactive T7 promoter on the plasmid, which prevents circular transcription.
- Use a reverse primer that introduces a 120-nt poly(A)₁₂₀ tail to support efficient transcription and mRNA stability.
- Use N1-methyl-pseudouridine in place of uracil and include CleanCap AG to improve mRNA translation and reduce innate immune activation1,2,3,4 (Figure 1).
NOTE: Other nucleotide analogs and capping reagents are available, but these have consistently shown high activity in genome editing mRNAs. Nanoparticle-based delivery is a suitable alternative but is not discussed in this protocol.
- Amplify the editor coding sequence by PCR for 30 cycles using primers that introduce a functional T7 promoter upstream of the coding region and a poly(A) sequence downstream (Table 2 and Table 3).
NOTE: The nucleotide sequence of the IVT template is underlined in table 4. - Verify and purify the PCR product
- Run 5 µL of the PCR product on a 1% agarose gel in TE buffer at 180 V for 30 minutes. Confirm the presence of a single band at approximately 4000-6500 bp (depending on the editor being transcribed) before proceeding to PCR product purification.
- Purify the PCR product using a PCR cleanup kit (Table of Materials).
NOTE: If multiple bands or poor PCR product quality are observed, optimize the thermocycling conditions (Table 5 – Troubleshooting Table). - Quantify the purified DNA using a fluorometric dsDNA assay. For Qubit dsDNA analysis, prepare the buffer-dye master mix by combining 796 µL of the high-sensitivity Qubit working solution with 4 µL of dye, both provided in the kit.
- In separate tubes, mix 198 µL of the buffer-dye master mix with 2 µL of the low concentration standard S1, high concentration standard S2, and the sample. Insert each standard and sample as prompted in the Qubit fluorometer instrument to measure the stock concentration.
NOTE: If samples are above the range of analysis, dilutions may need to be prepared.
2. Transcribe the mRNA
- Prepare the IVT reaction on ice using T7 RNA polymerase, NTPs, a cap analog for co-transcriptional capping, and N1-methyl-pseudouridine triphosphate as the uridine substitute to reduce innate immune activation1˒5˒6.
- Prepare the IVT reaction mixture according to Table 4. Use the annotated template sequence provided in Table 4. Assemble each transcription reaction in a final volume of 40 µL.
- Prepare 5–10 reaction tubes to generate sufficient mRNA for multiple experiments. Each 40 µL reaction generates approximately 100 µg of mRNA. With 1 µg of mRNA used for prime editing electroporation and 3 µg of mRNA used for base editing electroporation, this is enough for ~33–100 electroporations.
- Transcribe the RNA
- Mix the IVT reaction thoroughly by pipetting. Incubate the reaction at 37 °C for 2 h.
- Purify the RNA
- Transfer to a 1.5 mL tube and add 7.5 M lithium chloride (LiCl) solution to the IVT reaction at a volume equal to one-half of the total reaction volume to achieve a final LiCl concentration of 2.5 M. For a 40 µL IVT reaction, add 20 µL of 7.5 M LiCl. Mix thoroughly by gentle pipetting.
- Incubate the reaction at -20 °C for 30 minutes. Centrifuge the sample at 16,000 × g at 4 °C for 15 minutes.
- Remove the supernatant with a pipette and discard it. Wash the pellet with 1mL 70% ethanol at 4 °C. Disturbing the pellet is not necessary. Centrifuge at 16,000 × g at 4 °C for 5 minutes.
- Remove ethanol completely and allow the pellet to air dry for 1-2 minutes in an RNase free biosafety cabinet. Do not over-dry pellet or it can be difficult to resuspend.
- Re-suspend and quantify the RNA
- Resuspend the RNA in nuclease-free water. Initially resuspend each reaction in 50 µL of nuclease-free water and dilute further after measuring the RNA concentration. Quantify the RNA using a fluorometric RNA assay such as the nanodrop.
Pause point: After RNA quantification and aliquoting, store the mRNA aliquots at -80 °C until electroporation. Avoid repeated freeze-thaw cycles; thaw each aliquot only once before use. - Confirm that the purified mRNA yield is approximately 100-400 µg per 40 µL IVT reaction. Dilute the mRNA to 2 µg·µL-1 with nuclease-free water before aliquoting. Store the aliquots at −80 °C.
NOTE: Avoid repeated freeze-thaw cycles. Prepare single-use aliquots and discard unused thawed material. Prepare 12.5 µL aliquots in PCR strips for 8–20 electroporations per aliquot.
- Resuspend the RNA in nuclease-free water. Initially resuspend each reaction in 50 µL of nuclease-free water and dilute further after measuring the RNA concentration. Quantify the RNA using a fluorometric RNA assay such as the nanodrop.
- Assess RNA integrity
- Assess RNA size and integrity by agarose gel electrophoresis or automated electrophoresis (Figure 2)
- Prepare a 0.8% agarose gel containing 10,000x diluted SYBR Gold. Use a single-stranded RNA ladder, such as the NEB ssRNA Marker.
- Denature the mRNA using 2x RNA Gel Loading Dye and heating samples to 65 °C for 10 minutes before loading the samples onto the gel.
- Confirm that the mRNA appears as a predominant band at approximately 4000-6500 nt, depending on the editor being transcribed, with minimal smearing or low-molecular-weight products. Discard RNA samples that show substantial degradation, smearing, or multiple unexpected bands.
3. Design and preparation of guide RNAs
NOTE: Identify protospacer adjacent motif (PAM) sequences within the target genomic locus and select guide RNAs that are compatible with the chosen editor and intended genomic modification. Guide RNA design platforms such as CHOPCHOP, CRISPOR, CRISPRware, IDT Cas9 Checker, Benchling, and VectorBuilder can be used to prioritize guide RNAs with favorable predicted activity and specificity6,7,8,9,10,11,12,13.
- Identify PAM sites within the target genomic locus that are compatible with the selected nuclease variant, including NGN-compatible variants, using guide RNA design tools.
- Select guide RNAs with high predicted on-target activity and low predicted off-target activity. Confirm the editing window for the guide RNA.
- For base editing or prime editing applications, select guide RNAs that position the intended edit within the optimal activity window of the selected editor.
- Order sgRNA or pegRNA containing 2’-O-Methyl base analogs for the first 3 and last 3 nucleotides, as well as 3’ phosphorothioate linkage between the first 3 and last 2 bases of the guides.
- Resuspend the guide RNAs in nuclease-free water or TE buffer (100µM). Prepare 5 µL aliquots and store the aliquots at −80 °C. At the time of use, thaw and dilute in electroporation buffer before electroporation.
4. Cell culture preparation
NOTE: Assess cell integrity by microscopy and viability assays before electroporation.
- Culture primary fibroblasts or HEK293T cells in DMEM supplemented with 10% FBS, 4.5 g·L-1 glucose, GlutaMAX, and 110 mg·L-1 sodium pyruvate. Plate the cells on sterile T75 flasks (TC surface) at 20% confluency per flask. Maintain the cells between passages 1-20. Split cells at 80% confluency and use cells at 70-80% confluency for electroporation.
- Culture pluripotent stem cells in mTeSR Plus media. Plate the cells on sterile T75 flasks coated with Geltrex at 20% confluency per flask. Change media daily and maintain the cells between passages 1-20. Add CEPT cocktail to media for the 24 h following each passage. Split cells at 80% confluency and use cells at 70-80% confluency for electroporation.
- Maintain the cells at 37 °C in 5% CO₂ until the cells reach the appropriate density for electroporation, typically 70%–80% confluency.
- Remove media when cells are at an appropriate number and confluency for electroporation.
- Add TrypLE Express Enzyme to the cells (1mL for a T75 flask) and incubate at 37 °C for 5 min. Gently pipet the cells against the flask to obtain a single-cell suspension. Stop dissociation by adding 3 mL of cell culture media, and confirm the absence of large cell clumps before counting.
- Pellet the cells at 1,000 × g for 5 min, wash the cells once with 15 mL Dulbecco’s phosphate-buffered saline (DPBS), and centrifuge the cells again.
- Assess cell concentration and viability using an automated viability assay such as the Nucleocounter NC-3000 with Solution 13. Combine 11.4 µL of cells with 0.6 µL of Solution 13 before measurement on the Nucleocounter. Proceed with electroporation only when the cell viability is at least 85%, and discard or re-prepare samples below this threshold.
- Resuspend the cells at a density of approximately 0.5 × 10⁶–2 × 10⁶ cells·mL-1 in DPBS. Count the cells and assess viability using a hemocytometer or cell counter.
- Proceed only if the cell viability is ≥ 85%.
- Resuspend the cells in electroporation buffer. Resuspend 2 × 10⁵ cells in 5 µL of cold electroporation buffer per reaction.
- Prepare the electroporation buffer with the supplement solution according to the manufacturer’s instructions immediately before use and maintain the buffer on ice.
- Keep the cells cold and proceed promptly. Maintain the cells on ice and proceed immediately to electroporation setup.
5. Electroporation
NOTE: Prepare editing cargo in PCR strip tubes to facilitate multichannel pipetting. After electroporation, resuspend the cells in medium supplemented with CEPT cocktail to enhance cell survival12.
- Prepare the RNA cargo.
- Prepare the RNA cargo on ice by combining the editor mRNA and guide RNA(s) in electroporation buffer.
- For base editors and nucleases, prepare a final electroporation solution containing 1.5 µL (3 µg) of mRNA, 0.5 µL (50 pmol) of guide RNA, and 15 µL of electroporation buffer per sample.
- For prime editors, prepare a final electroporation solution containing 0.5 µL (1 µg) of mRNA, 1.5 µL (150 pmol) of guide RNAs, and 15 µL of electroporation buffer per sample.
- Prepare the RNA cargo solutions as a 1.2× master mix to compensate for volume loss during transfer and sample handling. Optimize the reagent volumes and ratios for each target site and editor variant as needed.
- Dispense the cells, cargo, and electroporate.
- Add 5 µL of the cell suspension to each electroporation well.
- Add 17 µL of RNA cargo in electroporation buffer to 5 µL of cells. Mix the suspension by pipetting twice.
Caution: Proceed rapidly after combining the cells and RNA cargo because RNases secreted by the cells can rapidly degrade the editor mRNA. Complete the electroporation within 2 min after mixing the cells and RNA cargo. - Run the electroporation program optimized for the selected cell type (Table 6; Figure 2; Figure 3).
- For primary human skin fibroblasts or HEK293T cells, use the Lonza 4D electroporation system with buffer SF. Add 200,000 cells per reaction to a 20 µL electroporation cuvette. Run program CM-130. Immediately add 80 µL of pre-warmed DMEM + 10% FBS, 4.5 g·L-1 glucose, 4 mM L-glutamine, and 110 mg·L-1 sodium pyruvate. Recover cells for 10 minutes before diluting into 96- or 24-well plates.
- For pluripotent stem cells, use the Lonza 4D electroporation system with buffer P3. Add 200,000 cells per reaction to a 20 µL electroporation cuvette. Run program DN-100. Immediately add 80 µL of pre-warmed mTeSR Plus media. Recover cells for 10 minutes before diluting into 24-well plates.
- Examine the cells daily after plating to monitor cell health and recovery.
6. Genomic DNA extraction
NOTE: Ensure that genomic DNA is of sufficient quality and free of inhibitors prior to PCR amplification, as DNA quality can affect sequencing library preparation and accurate quantification of genome editing outcomes9,10,11.
- Wash and harvest the cells.
- Collect the cells 2-3 days after electroporation. Wash the cells once with DPBS and proceed immediately to genomic DNA extraction.
- Prepare incomplete lysis buffer by combining 10 mL of 1 M Tris-HCl (pH 8.0), 5 mL of 10% (wt/vol) sodium dodecyl sulfate (SDS) solution, and nuclease-free water to a final volume of 1 L. Store the incomplete lysis buffer at room temperature for up to 6 months.
- Freshly prepare complete lysis buffer by adding proteinase K at a 1:1,000 (vol/vol) dilution to an aliquot of incomplete lysis buffer. Add the complete lysis buffer to the cells to initiate lysis. Add 40 µL of complete lysis buffer to each well containing approximately 80,000 cells in a 96 well plate. Do not pipet up and down as this could cause sample loss.
- Digest the samples.
- Incubate the samples at 37 °C for 60 min to complete cell lysis and proteinase K digestion.
- Inactivate proteinase K.
- Transfer the lysates to PCR tubes or a 96-well PCR plate. Incubate the samples at 80 °C for 30 min to inactivate the proteinase K.
- Store the lysates.
Pause Point: Store the lysates at −20 °C until PCR amplification.
7. Targeted amplicon sequencing for editing analysis
NOTE: Pool PCR products in equimolar amounts prior to sequencing. Approximately 10,000 sequencing reads per sample are generally sufficient for quantification of bulk genome editing outcomes.
- Design locus-specific primers to generate approximately 300 bp amplicons spanning at least 25 bp upstream and 25 bp downstream of the edit site (Table 7).
- Amplify the target genomic locus by performing PCR1 according to the conditions provided in Table 8, Table 9.
- Add unique sample indices by PCR using the PCR1 product as the template, such as with primers shown in Table 7 “Example PCR indexing primers” tab. Use PCR conditions as shown on tab 2 of Table 8 and Table 9.
- Run the PCR1 and PCR2 products on a 1.5% agarose gel to confirm the presence of single bands at the expected sizes.
- Pool the PCR2 products in equimolar amounts. Clean the pooled PCR2 library using AMPure XP bead-to-sample ratio of 0.65:1 according to the manufacturer’s instructions. Elute the purified library in 30 µL of nuclease-free water and confirm removal of adapter dimers by gel electrophoresis before sequencing.
- Quantify the final pooled library using a fluorometric dsDNA assay. Assess the fragment size distribution by capillary electrophoresis.
- Sequence the libraries using single-end 300-cycle reads on an Illumina MiSeq instrument. Dilute the final pooled library to 4 nM. Combine 5 µL the pooled 4 nM library with 5 µL of 0.1 M NaOH and pipet to mix. Incubate for 5 minutes at room temperature to denature, then add 990 µL of chilled HT buffer provided with the MiSeq kit to neutralize the solution and dilute to 20 pM. Spike in 15% PhiX control. Load the library onto a Illumina MiSeq cartridge and run single-end 300-cycle sequencing using the manufacturer’s standard run settings Aim to generate approximately 30,000 reads per sample, although 10,000 reads per sample are sufficient for editing analysis12. MiSeq sequencing can be done on a per-sample basis at some companies such as Genewiz or Quintara.
8. Analysis of genome editing outcomes
Note: CRISPResso2 analysis enables quantification of overall editing efficiency, nucleotide conversion frequencies, and insertion/deletion (indel) frequencies, and can be used to characterize editing outcomes across experimental conditions15.
- Demultiplex the sequencing data and organize the FASTQ files according to genomic locus and experimental condition.
- Install CRISPResso2 according to the instructions provided in the Github repository (https://github.com/pinellolab/crispresso2).
- Run CRISPResso2 batch analysis using batch.txt files that specify the input FASTQ files and analysis parameters (examples provided in Table 7). Set the minimum read quality score to 30. Set the “w” window width to 20. If using cytosine base editors, some indels can be centered around the base edited nucleotides in addition to than the nick site. In that case, adjust the “wc” window center to -10 rather than the default center at the nick site to best capture these indels.
- Extract quantitative outputs, such as the nucleotide conversion frequencies, insertion/deletion (indel) frequencies, and (if applicable) HDR or prime editing frequencies from the appropriate summary output files. These are typically found in files named “CRISPRessoBatch_quantification_of_editing_frequency.txt” and “Nucleotide_percentage_summary.txt”, which can be opened in Microsoft Excel or other spreadsheet editing software.
- Export the quantitative editing values for downstream plotting and data interpretation, as in Figures 3-4. Use the “alleles_frequency_table_around_sgRNA.pdf” files (as shown in Figure 5) to assess allelic editing outcomes.
Results
Using an efficient editor with an easily accessed test site in, such as the ABE8e base editor with the HEK3 control site, can often result in editing efficiencies above 90% if the delivery system is well-suited for the cells used in the experiment. Lower editing efficiencies may result if there are problems with the editor mRNA, guide RNA, the target site, or the delivery conditions that make any less well-suited to editing. Using Cas9 variants that access more versatile PAM sequences but bind them less tightly or targeting editors to nucleotides that are outside their ideal editing window, can reduce editing efficiency. Successful IVT-generated editor mRNAs typically appear as a single predominant band with minimal smearing or low-molecular-weight degradation products, indicating high transcript integrity suitable for downstream electroporation (Figure 2).
After electroporation of editor mRNA and synthetic guide RNAs, most cells recover within 24–48 h and maintain their typical morphology with suitable electroporation programs (Figure 3–4). Electroporation conditions should be tailored to the specific cell type, as different buffers can yield markedly different outcomes. The online Lonza Knowledge Center makes recommendations for buffer and electroporation codes for common cell types, and Lonza offers separate optimization kits for cell lines and primary cells. Empirical comparison of buffers can help identify optimal conditions for efficient delivery. Unsuitable programs may lead to no delivery at all or can be highly toxic to cells (losing over 50% or preventing continuation of the cell cycle). Representative optimization experiments demonstrated substantial differences in editing outcomes across electroporation conditions, with some programs yielding high editing efficiencies while others produced minimal editing, highlighting the importance of empirical optimization for each cell type (Figure 3–4).
Across iPSCs, fibroblasts, and LCLs, targeted amplicon sequencing followed by CRISPResso2 analysis is used to quantify editing efficiency and byproducts (Figure 4). Adenine base editing of the HEK3 test locus is shown here (Figure 4), which resulted in the intended nucleotide conversions with low indel frequencies in the analyzed samples. CRISPResso2 analysis enables visualization of edited and unedited alleles at the target locus and facilitates quantification of intended nucleotide conversions, indel frequencies, and other editing byproducts, providing a comprehensive assessment of editing outcomes (Figure 5). Editing efficiency is quantified by measuring the frequency of this precise single-nucleotide substitution at the target site. The HEK3 locus is used as a model locus due to its well-characterized editing profile and reproducibility across experimental systems, enabling robust evaluation of base editing performance under different conditions. We recommend testing this guide as a positive control in human cells when optimizing new editing procedures. Base editing is typically enriched for intended nucleotide conversions with low indel frequencies, whereas prime editing yields a mixture of precise edits and low-frequency byproducts3,12. Editing efficiencies varied across conditions, with clear differences observed between cell types and electroporation programs (Figure 3-4,). These variations likely reflect differences in cellular uptake, viability, and DNA repair activity, as well as the influence of electroporation parameters on delivery efficiency. Collectively, these findings highlight the importance of cell type-specific optimization of electroporation settings to achieve consistent and maximal editing outcomes.
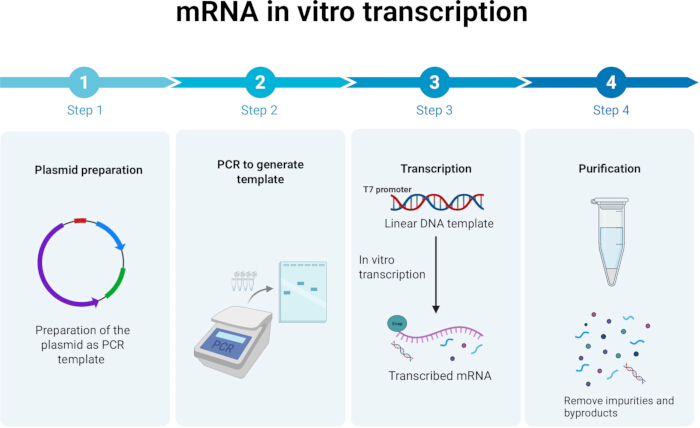
Figure 1. Preparation of editor mRNA by in vitro transcription.
Schematic overview of editor mRNA generation. (Step 1) Preparation of plasmid template containing the editor coding sequence and T7 promoter. (Step 2) PCR amplification to generate a linear DNA template. (Step 3) In vitro transcription using T7 RNA polymerase to synthesize capped mRNA. (Step 4) Purification of mRNA to remove template DNA, enzymes, and free nucleotides. The resulting capped mRNA is suitable for downstream delivery into mammalian cells by electroporation or lipid nanoparticle. Please click here to view a larger version of this figure.
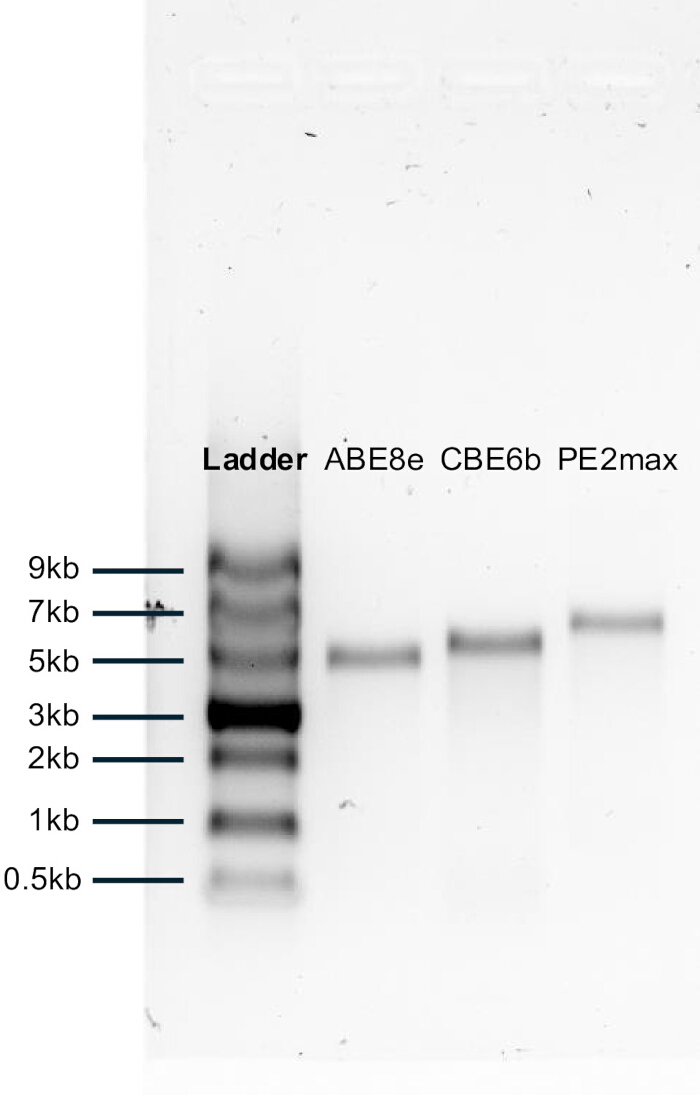
Figure 2. Example image of mRNA gel electrophoresis
Electrophoresis image of three genome editor mRNAs run on a 1% agarose gel using SYBR gold stain. The ssRNA ladder from NEB is shown at left with size markers indicated with their length. The lack of substantial smearing or small bands indicates these mRNAs are of suitable quality. Please click here to view a larger version of this figure.
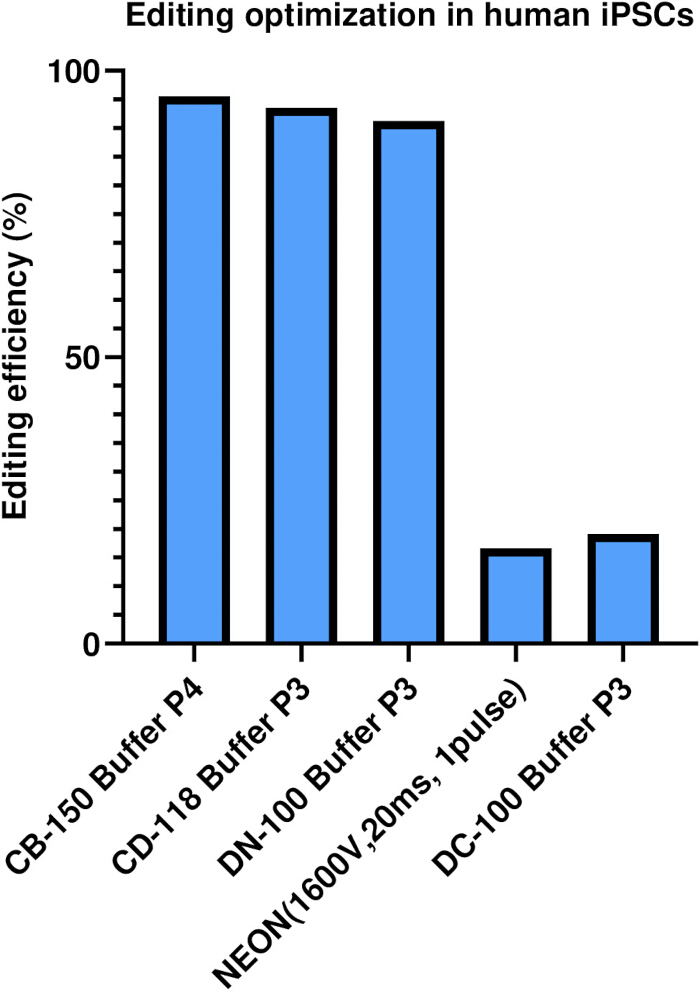
Figure 3. Optimization of electroporation conditions for genome editing in induced pluripotent stem cells (iPSCs).
Editing efficiencies obtained under different electroporation conditions in iPSCs are shown. Cells were electroporated using multiple buffers and program combinations, including CB-150 buffer P4, CD-118 buffer P3, DN-100 buffer P3, DC-100 buffer P3, all on the Lonza 4D Nucleofection device. Editing was assessed using the Neon electroporation device with parameters (1600 V, 20 ms, 1 pulse). Editing efficiency was quantified by targeted sequencing analysis of the edited locus. N=1 per sample. Please click here to view a larger version of this figure.
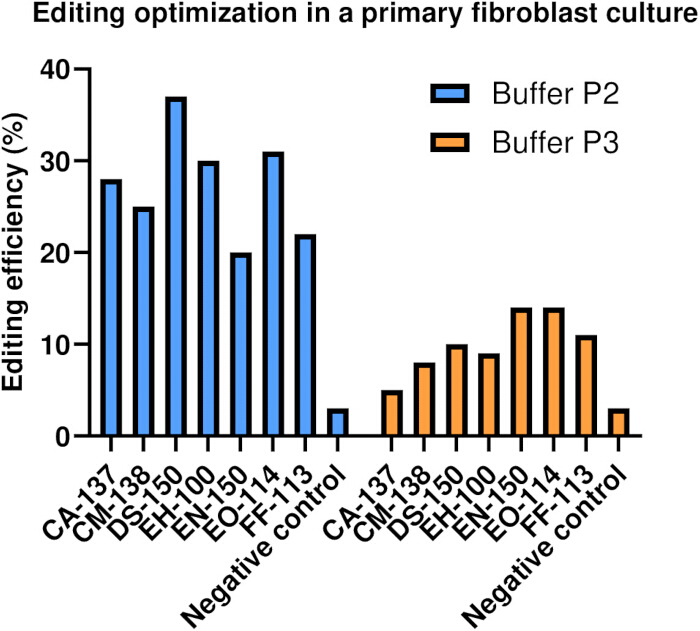
Figure 4. Optimization of electroporation conditions for genome editing in fibroblasts.
Editing efficiency following electroporation using different nucleofection programs. Fibroblasts were electroporated using multiple Lonza Nucleofector programs (CA-137, CM-138, DS-150, EH-100, EN-150, EO-114, and FF-113), and editing outcomes were quantified by targeted sequencing. Results are shown for two replicates (P2, P3). A negative control without editor delivery is included. Comparison of electroporation codes highlights differences in editing efficiency across electroporation settings, enabling identification of optimal parameters for fibroblast genome editing. N=1 per sample. Please click here to view a larger version of this figure.
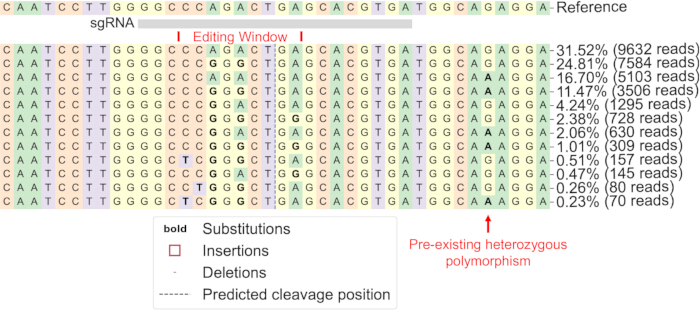
Figure 5. Characterization of genome editing outcomes at the targeted locus.
Allele frequency table output from CRISPResso2, which displays the relative abundance of edited and unedited alleles surrounding the sgRNA target region as determined by high-throughput sequencing analysis after editing. Red annotations indicate the base editing window and the pre-existing heterozygous polymorphism present in the cell line used. The guide RNA spacer sequence is underlined in gray. “Predicted cleavage position” shown by a dotted line is shifted relative to the typical “PAM minus 3” position for SpCas9 due to the modification of the window center “wc” in our analysis Batch File (example in Table 8). This does not actually shift the true predicted cleavage location, but the output is shown in this way to indicate that indels surrounding the dotted line within a window of 20 nucleotides will be assessed, capturing both indels centered at the true nick site as well as those centered at the deaminated nucleotides. Please click here to view a larger version of this figure.
Table 1. Editors and sequences used in this study
Column 1: Genome editors available on AddGene for in vitro transcription. Names and Addgene IDs for plasmids available that are amenable to in vitro transcription as described in this protocol. Column 2: Sequences of guide RNA spacers used in this study. Please click here to download this Table.
Table 2. PCR reagents for amplification of the mRNA plasmid template.
The list of reagents and reaction components used for PCR amplification of the plasmid template to generate linear DNA for downstream applications, as well as the sequence of the forward and reverse transcription primers. Please click here to download this Table.
Table 3. PCR cycling conditions for amplification of the mRNA template.
This table lists the thermocycling conditions used for PCR amplification of the mRNA template from the plasmid DNA prior to downstream applications. Please click here to download this Table.
Table 4. Reagents used for in vitro. transcription (IVT) reactions.
This table lists the reagents and reaction components used for in vitro transcription to synthesize editor mRNA from the linear DNA template. An example template sequence (ABE8e) is shown with color-coded elements. Please click here to download this Table.
Table 5. Troubleshooting guide for key steps in the genome editing workflow.
This table summarizes common technical issues that may arise during editor mRNA preparation by in vitro transcription (IVT), and MiSeq sequencing analysis. For each step of the workflow, potential problems, possible causes, and recommended solutions are provided to assist in optimizing editing efficiency and ensuring accurate detection of editing outcomes. Please click here to download this Table.
Table 6. Optimal electroporation programs for different mammalian cell types.
This table lists the electroporation program codes and buffer conditions used for efficient delivery of editor mRNA and guide RNAs into different mammalian cell types. The listed electroporation parameters were tested to identify conditions that maximize genome editing efficiency while maintaining cell viability. The same program may not work for each cell line or source of primary cells, so testing alternatives from this list is recommended if editing is initially unsuccessful. Please click here to download this Table.
Table 7. CRISPResso2 analysis parameters for quantification of genome editing outcomes.
The first tab lists an example of the HTS1 primer design used for amplification of the target locus. The second tab provides an example of the indexing primers used during library preparation. The third tab illustrates an example of the indexing arrangement used to assign unique indices to each sample during sequencing. The fourth tab contains an example input batch file for CRISPResso2 analysis, and the fifth tab provides an additional example of a CRISPResso2 analysis input Batch File. Note that the window center “wc” is adjusted for base editors to facilitate detection of indels that are centered on the deaminated bases in addition to those centered on the nuclease cut or nick site. Please click here to download this Table.
Table 8. PCR1 (Tab 1) and PCR2 (Tab 2) reagents for MiSeq library preparation.
This table lists the reagents and reaction components used in Tab 1 (PCR1) to amplify the target genomic loci and in Tab 2 (PCR2) to incorporate sample-specific index sequences and Illumina sequencing adapters, generating sequencing-ready libraries for MiSeq analysis. Please click here to download this Table.
Table 9. PCR1 (Tab 1) and PCR2 (Tab 2) cycling conditions for MiSeq library preparation.
This table lists the thermocycling conditions used in Tab 1 (PCR1) to amplify the target genomic regions and in Tab 2 (PCR2) to incorporate sample-specific index sequences and Illumina sequencing adapters, generating sequencing-ready libraries for MiSeq analysis. Please click here to download this Table.
Discussion
This protocol provides a workflow for genome editing in primary mammalian cells using electroporation of editor mRNA and synthetic guide RNAs. Delivery as mRNA tends to yield more efficient editing relative to plasmid delivery, and mRNA tends to be simpler and more consistent between batches relative to editor protein or ribonucleoprotein. When mRNA and ribonucleoprotein forms of base editors have been compared head-to-head in some prior work, mRNA has yielded better editing efficiency3. Compared to plasmid or viral delivery methods, mRNA-based delivery enables transient expression and reduced risk of genomic integration, although it may require optimization for different cell types. In addition to lower editing efficiency, the use of plasmid DNA for genome editing carries a risk of random integration into the genome of target cells and can increase the risk of off-target editing due to prolonged expression of the editor. The combination of targeted amplicon sequencing and CRISPResso2 enables standardized quantification of editing efficiency and characterization of any allelic outcomes3.
Several factors are vital for success. Critical steps in this protocol include maintaining RNA integrity through strict RNase-free handling, selecting optimal guide RNAs, and carefully optimizing electroporation conditions for each cell type. RNA integrity and careful RNase control strongly influence outcomes, and guide RNA selection remains a primary determinant of efficiency and byproduct profiles. Electroporation settings require empirical optimization by cell type and some programs that yield high editing may also cause toxicity. If low editing efficiency is observed, optimization of electroporation parameters, RNA quality, or guide RNA design should be considered. If excessive toxicity occurs, reducing electroporation strength or RNA input may improve cell viability. Additional optimization strategies include testing alternative electroporation buffers and programs tailored to the target cell type or modifying editor or guide RNA concentrations. This workflow provides a practical platform to benchmark editors and produce modified cells before downstream single-cell cloning, phenotyping, in vivo studies, or translational development. This workflow is broadly applicable for evaluating genome editing strategies in primary cells, enabling systematic comparison of editing modalities across genomic contexts and cell types. It supports disease modeling through the introduction or correction of clinically relevant variants, as well as functional interrogation of coding and non-coding regulatory elements. In addition, it provides a platform for optimizing therapeutic editing approaches, including assessment of on-target efficiency, off-target activity, and editing durability. The workflow can also be used to screen and prioritize guide RNAs and editing systems, evaluate delivery strategies, and test patient-specific variants in a precision medicine framework. Collectively, it serves as a versatile bridge between basic genome biology, translational research, and preclinical development. A limitation of this method is that electroporation efficiency and cell viability can vary substantially between cell types, requiring empirical optimization. In addition, editing outcomes may depend on guide RNA design and purity, and the accessibility of the target locus, which may limit reproducibility across different experimental systems. Despite these constraints, careful optimization of experimental parameters and guide design can mitigate variability, enabling reliable and reproducible application of this approach across diverse cellular systems.
Disclosures
N.W. and E.V.B. have filed patent applications on genome editing technologies through Johns Hopkins University. G.A.N. has filed patent applications related to genome editing technologies through the Broad Institute and Johns Hopkins University.
Authors contribution:
M.V., J.N.W., E.V.B, D.M.E., J.D., and G.A.N. each drafted separate sections of the text. M.V. assembled and edited the final text followed by edits from all authors.
Acknowledgements
We thank Beatriz Olalla Sastre for helpful discussions relating to this protocol. This work was supported by the British Heart Foundation’s Big Beat Challenge award to CureHeart (award reference no. BBC/F/21/220106), the Cystic Fibrosis Foundation (award NEWBY23XX0), and the US National Institutes of Health (R00HL163805 and DP2OD038783 to G.A.N.). J.N.W. acknowledges support by NIH Grant No. T32 GM148383.
Materials
| Name | Company | Catalog Number | Comments |
|---|---|---|---|
| 1M Tris-HCl, pH 8.0 | Thermo Fisher Scientific | 15568025 | |
| Agarose | Thermo Fisher Scientific | R0491 | Agarose UltraPure 16500500 ThermoFisher 500g |
| AMPure XP SPRI Beads | Beckman Coulter | B23317 | A63880, AMPure XP Beads for DNA Cleanup, 5 mL, Beckman Coulter |
| ATP (100 mM) | New England Biolabs | N0450 | |
| CEPT Cocktail | Bio-Techne / Tocris | 7200 | |
| CleanCap AG Reagent | TriLink Biotechnologies | N-7113 | CleanCap AG 3′ OMe CleanScript IVT Kit, 125 x 20 µL rxns, |
| CTP (100 mM) | New England Biolabs | N0450 | |
| Custom DNA Primers | Integrated DNA Technologies | Custom | |
| DNA Loading Dye | New England Biolabs | B7024 | |
| DPBS (Dulbecco’s Phosphate Buffered Saline) | Thermo Fisher Scientific | 14190-144 | D8537-100ML |
| Dulbecco’s Modified Eagle Medium (DMEM) | Thermo Fisher Scientific | 11965-092 | DMEM High Glucose [4,500 mg/L] with [4.0 mM] L-Glutamine and [110 mg/L] Sodium Pyruvate, 500 mL |
| Gel Extraction Kit | Qiagen | 28704 | |
| GTP (100 mM) | New England Biolabs | N0450 | |
| Illumina Indexing Primers | Illumina | FC-131-2001 | 10uM stocks |
| Illumina MiSeq Sequencer | Illumina | SY-410-1003 | |
| Lithium Chloride RNA Precipitation Solution | Thermo Fisher Scientific | AM9480 | |
| Lonza 4D Nucleofector System | Lonza | AAF-1002X | |
| ssRNA Ladder NEB | NEB | N0362S | 5ul/ reaction |
| MiSeq Reagent Kit v3 (300 cycles) | Illumina | MS-102-3002 | |
| N1-Methyl-Pseudouridine-5′-Triphosphate | TriLink Biotechnologies | N-1081 | |
| NEBNext Ultra II Q5 Master Mix | New England Biolabs | M0544 | |
| Nuclease-Free Water | Thermo Fisher Scientific | AM9937 | |
| NucleoCounter NC Slide A8 | ChemoMetec | 941-0008 | |
| NucleoCounter NC-3000 | ChemoMetec | NC-3000 | 10ul of cell solution and 0.4167 μL of DAPI solution |
| Solution 15, Hoechst 33342, 1 mL 910-3015 Chemometec | Chemometec | 910-3013 | 500 μg/ml ~ 0.9 mM ~ 0.05% |
| Nucleocuvette Strips | Lonza | V4XP-3032 | |
| P3 Primary Cell Nucleofector Solution | Lonza | V4XP-3032 | 1 x 0.675 mL P3 Primary Cell Nucleofector® Solution |
| Phusion High-Fidelity DNA Polymerase | Thermo Fisher Scientific | F530L | |
| Proteinase K | Thermo Fisher Scientific | EO0491 | Quantity: 1mL, >600 U/mL (~20 mg/mL) |
| Q5 High-Fidelity DNA Polymerase | New England Biolabs | M0491 | 2,000 units/ml 100 units |
| QIAquick PCR Purification Kit | Qiagen | 28104 | |
| Qubit dsDNA High Sensitivity Assay Kit | Thermo Fisher Scientific | Q33230 | |
| Qubit RNA Broad Range Assay Kit | Thermo Fisher Scientific | Q10211 | |
| Qubit™ Assay Tubes | Thermo Fisher Scientific | Q32856 | |
| RNA Gel Loading Dye (2x) | Thermo Fisher Scientific | R0641 | 5ul/ reaction |
| RNA Purification Kit | Zymo Research | R1017 | |
| RNase Away | Thermo Fisher Scientific | 1236B62 | |
| SDS, 10% solution | Thermo Fisher Scientific | 15553027 | |
| SYBR Gold Nucleic Acid Gel Stain | Thermo Fisher Scientific | S11494 | |
| SYBR Safe DNA Gel Stain | Thermo Fisher Scientific | S33102 | |
| Synthetic sgRNA / pegRNA | Synthego / IDT | Custom | 2ug |
| HiScribe T7 High Yield RNA Synthesis Kit, 250 reactions | New England Biolabs | E2040L | |
| TrypLE Express Enzyme | Thermo Fisher Scientific | 12604013 | 100 mL |
| TE buffer (Tris-EDTA) | Thermo Fisher Scientific | AM9849 | TE, pH 8.0, RNase-free Thermo |
| Trypsin-EDTA (0.25%) | Thermo Fisher Scientific | 25200056 | 1X |
| Fetal Bovine Serum (FBS), Premium, 500 mL | Thermo Fisher Scientific | A5670701 | |
| mTSER PLUS | STEM cell Technologies | # 100-0276 | |
| Penicillin/Streptomycin Mixture 10,000 ug/mL, 100 mL, 4-pack | Quality Biological | 120-095-721 |
References
- Gao H, Gao S, Kan G, Valentovich LN, An Y. Research progress of base editing and prime editing tools based on the CRISPR/Cas system. Mol Ther Nucleic Acids. 2025;36.
- Chen PJ, Hussmann JA, Yan J, et al. Enhanced prime editing systems by manipulating cellular determinants of editing outcomes. Cell. 2021;184(22):5635–5652. doi:10.1016/j.cell.2021.09.018.
- Newby GA, Yen JS, Woodard KJ, et al. Base editing of haematopoietic stem cells rescues sickle cell disease in mice. Nature. 2022;595(7866):295-302. doi:10.1038/s41586-021-03609-w.
- Sousa AA, Hemez C, Lei L, et al. Systematic optimization of prime editing for the efficient functional correction of CFTR F508del in human airway epithelial cells. Nat Biomed Eng. 2024;9(1):7. doi:10.1038/s41551-024-01233-3.
- Mayuranathan T, Newby GA, Feng R, et al. Potent and uniform fetal hemoglobin induction via base editing. Nat Genet. 2023;55(7):1210-1217.
- He W, Zhang X, Zou Y, et al. Effective synthesis of high-integrity mRNA using in vitro transcription. Molecules. 2024;29(11).
- Popova PG, Lagace MA, Tang G, Blakney AK. Effect of in vitro transcription conditions on yield of high-quality messenger and self-amplifying RNA. Eur J Pharm Biopharm. 2024;198.
- Zhang F, Wang Y, Wang X, et al. RT-IVT method allows multiplex real-time quantification of in vitro transcriptional mRNA production. Commun Biol. 2023;6(1).
- Montague TG, Cruz JM, Gagnon JA, Church GM, Valen E. CHOPCHOP: a CRISPR/Cas9 and TALEN web tool for genome editing. Nucleic Acids Res. 2014;42(W1)-W407.
- Concordet JP, Haeussler M. CRISPOR: intuitive guide selection for CRISPR/Cas9 genome editing experiments and screens. Nucleic Acids Res. 2018;46(W1)-W245.
- Mohr SE, Hu Y, Ewen-Campen B, Housden BE, Viswanatha R, Perrimon N. CRISPR guide RNA design for research applications. FEBS J. 2016;283(17):3232-3245.
- Huang TP, Newby GA, Liu DR. Precision genome editing using cytosine and adenine base editors in mammalian cells. Nat Protoc. 2021;16(2):1089-1106. doi:10.1038/s41596-020-00450-9.
- Doman JL, Sousa AA, Randolph PB, Chen PJ, Liu DR. Designing and executing prime editing experiments in mammalian cells. Nat Protoc. 2023;18(6):1780-1818. doi:10.1038/s41596-022-00724-4.
- Chicaybam L, Barcelos C, Peixoto B, et al. An efficient electroporation protocol for the genetic modification of mammalian cells. Front Bioeng Biotechnol. 2017;4:99.
- Clement K, Rees H, Canver MC, et al. CRISPResso2 provides accurate and rapid genome editing sequence analysis. Nat Biotechnol. 2019;37(3):224-230.
Reprints and Permissions
