This protocol describes a time-lapse live-cell imaging method to visualize antibody-dependent macrophage phagocytosis of green fluorescent protein–labeled triple-negative breast cancer cells using peripheral blood mononuclear cell–derived macrophages and an automated microscope.
A subscription to JoVE is required to view this content. Sign in or start your free trial.
Method Article
Time-Lapse Imaging of Antibody-Driven Macrophage Phagocytosis of Green Fluorescence Protein–Labeled Triple-Negative Breast Cancer Cells
* These authors contributed equally
In This Article
Summary
Abstract
Antibody-dependent cellular phagocytosis is a key mechanism by which macrophages engulf antibody-opsonized cancer cells. This protocol describes a time-lapse live-cell imaging method to visualize antibody-dependent macrophage phagocytosis of green fluorescent protein–labeled, CD24-expressing triple-negative breast cancer cells. Macrophages are derived from human peripheral blood mononuclear cells, differentiated with macrophage colony–stimulating factor, and polarized using interferon gamma and lipopolysaccharide to generate a pro-inflammatory phenotype. Cancer cells are opsonized with an anti-CD24 monoclonal antibody prior to co-culture with macrophages at a defined effector-to-target ratio. Phagocytic events are recorded over a 16 h period using an automated microscope equipped with environmental control to maintain physiological conditions. Imaging is performed using brightfield and fluorescence channels, allowing identification of cancer cells and monitoring of their internalization by macrophages. Representative time-lapse images demonstrate the progressive engulfment of fluorescent cancer cells over time. To enable quantitative assessment, a parallel endpoint assay is performed under identical co-culture conditions, in which non-internalized cancer cells are removed prior to imaging to allow accurate measurement of phagocytic events. This method provides a standardized and reproducible approach for visualizing antibody-driven macrophage phagocytosis in vitro. Importantly, the integration of time-lapse imaging with endpoint-based quantification enables complementary evaluation of the kinetics and magnitude of phagocytosis. This protocol supports the evaluation of therapeutic antibodies and macrophage-directed cancer immunotherapies in a controlled in vitro setting.
Introduction
Breast cancer is the most frequently diagnosed malignancy among women worldwide, accounting for approximately 2.3 million new cases annually1. The disease is clinically heterogeneous and is classified into at least four major molecular subtypes based on the status of hormone receptors—estrogen receptor (ER) and progesterone receptor (PR)—and the expression of the human epidermal growth factor receptor 2 (HER2) oncogene2. Luminal A tumors express ER and/or PR without HER2 overexpression (ER/PR+ and HER2−); luminal B tumors co-express ER/PR and HER2 (ER/PR+ and HER2+); HER2+ tumors are characterized by high HER2 expression independent of hormone receptor status; and triple-negative breast cancer (TNBC) lacks expression of all three markers (ER−, PR−, and HER2−)2,3. Among these subtypes, TNBC represents the most clinically challenging form and accounts for approximately 15%–20% of all breast cancers. Patients with TNBC exhibit the most aggressive disease course, with the worst prognosis and shortest 5-year overall survival, owing to poor responses to conventional chemotherapy and the absence of effective targeted therapies3,4. Furthermore, TNBC displays a significantly high propensity for visceral metastasis, particularly to the lungs within 5 years of diagnosis, and patients with advanced or metastatic TNBC (mTNBC) have a median survival that rarely exceeds 2 years5,6. These statistics underscore the critical and unmet need for novel therapeutic strategies for TNBC.
The tumor microenvironment (TME) plays a pivotal role in breast cancer progression and immune evasion. Tumor-associated macrophages rank among the most abundant immune cells within the TME and have recently been recognized as critical mediators of innate anti-tumor immunity7,8,9. While TAMs were historically divided into pro-inflammatory “M1” and pro-tumoral “M2” states, this binary model fails to capture the true extent of macrophage heterogeneity. Instead, TAMs occupy a dynamic functional spectrum, evolving in response to the diverse biochemical signals within the TME. Within this complex landscape, cancer cells actively subvert macrophage activity through various immune evasion strategies, notably the overexpression of “don’t eat me” signals. The CD47/SIRPα axis was the first identified innate immune checkpoint in this context6,10, and more recently, CD24 has emerged as a novel and potent antiphagocytic signal11,12. CD24 is a small and heavily glycosylated mucin-type glycoprotein anchored to the cell membrane via a glycosylphosphatidylinositol linkage13. It is expressed on various immune cell lineages under physiological conditions but is frequently overexpressed in solid tumors, including breast, ovarian, pancreatic, and colorectal cancers14. On tumor cells, CD24 engages the inhibitory receptor sialic acid–binding immunoglobulin-like lectin 10 (Siglec-10) expressed on macrophages. This interaction triggers phosphorylation of the immunoreceptor tyrosine-based inhibitory motif domains in the cytoplasmic tail of Siglec-10, activating the SHP-1 and SHP-2 phosphatases that suppress downstream phagocytic signaling11. Blockade of the CD24/Siglec-10 interaction with monoclonal antibody has been shown to robustly augment the phagocytosis of CD24-expressing human tumors by macrophages. Our recent study also showed that knockout of CD24a in breast cancer cells increases their susceptibility to macrophage phagocytosis in a murine triple-negative breast cancer model9.
Antibody-dependent cellular phagocytosis (ADCP) is a pivotal mechanism by which antibodies direct macrophages to phagocytose tumor cells15,16. Upon binding to tumor-expressed antigens, the Fc region of the antibody engages Fcγ receptors (FcγRs) on macrophages, triggering intracellular signaling cascades that culminate in cytoskeletal rearrangement, phagocytic cup formation, and engulfment of the target cell17.
In this study, we developed and validated a time-lapse live-cell imaging protocol for measuring antibody-driven macrophage phagocytosis of breast cancer cells. The method utilizes peripheral blood mononuclear cell (PBMC)-derived macrophages from healthy human donors, differentiated with macrophage colony-stimulating factor (M-CSF) and subsequently stimulated with lipopolysaccharide (LPS) and interferon gamma (IFN-γ). Flow cytometry analysis confirmed upregulation of CD80 within the CD11b⁺ population following stimulation (Figure 1), supporting the classically activated phenotype. This activation state confers robust antibody-mediated phagocytic capacity, making it well suited for evaluating antibody-dependent cellular phagocytosis (ADCP). GFP-tagged CD24-positive breast cancer cells serve as target cells and are opsonized with a therapeutic anti-CD24 monoclonal antibody prior to co-culture. Phagocytic events are recorded over a 16 h period using an automated microscope under controlled environmental conditions. To enable quantitative assessment in parallel with dynamic visualization, a separate endpoint assay is performed under identical co-culture conditions, allowing rigorous measurement of phagocytosis following removal of non-internalized target cells. This protocol provides a standardized, reproducible, and visually informative platform for evaluating ADCP mediated by an anti-CD24 antibody. Importantly, the integration of time-lapse imaging with a complementary endpoint-based quantification strategy enables simultaneous evaluation of phagocytic kinetics and magnitude. The method can be adapted for investigating other macrophage-directed immunotherapeutic targets. This protocol is most suitable for evaluating ADCP mediated by therapeutic monoclonal antibodies against surface antigens on cancer cells. It is well suited for comparative screening of candidate antibodies, dose-response characterization, and mechanistic studies of Fc–FcγR engagement, including the effects of “don’t-eat-me” signal blockade (e.g., CD47–SIRPα). Because the assay uses primary human macrophages, it is also appropriate for translational studies that require assessment of donor-to-donor variability prior to clinical development.
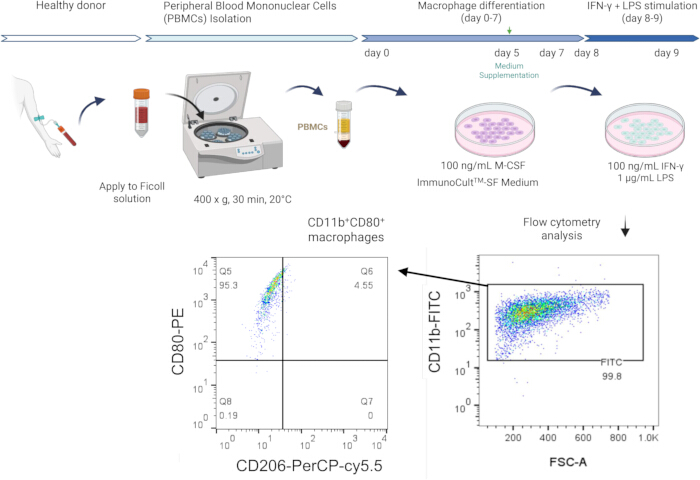
Figure 1. Generation and flow cytometry validation of IFN-γ/LPS-stimulated macrophages derived from peripheral blood mononuclear cells. Upper panel: Peripheral blood mononuclear cells (PBMCs) are isolated from healthy donors by density gradient centrifugation using Ficoll solution at 400 × g for 30 min at 20°C, with all reagents pre-equilibrated to 20°C ± 2°C. Isolated PBMCs are cultured in ImmunoCult-SF medium supplemented with 100 ng/mL macrophage colony-stimulating factor (M-CSF) for 7 days to drive macrophage differentiation (Day 0–7), with medium supplementation at Day 5. On Day 8, differentiated macrophages are stimulated with 100 ng/mL IFN-γ and 1 µg/mL LPS for 48 h (Day 8–10). Cells are then subjected to flow cytometry analysis. Bottom panel: Flow cytometry analysis of macrophages. Cells were stained with a surface panel consisting of CD11b-FITC, CD80-PE, and CD206-PerCP-Cy5.5, followed by DAPI addition prior to acquisition for dead cell exclusion. Gating strategy: Cells were first gated on live cells (DAPI⁻), followed by CD11b⁺ identification on a CD11b-FITC versus FSC-A plot to confirm macrophage identity. Live CD11b⁺ events were then analyzed on a CD80 versus CD206 dot plot to confirm the CD80⁺CD206⁻ population induced by IFN-γ/LPS stimulation. Right: Representative dot plot of CD11b-FITC versus FSC-A showing that 99.8% of gated cells were CD11b⁺, confirming macrophage identity. Left: The majority of CD11b⁺ cells fell within the CD80⁺CD206⁻ gate (Q1: 95.2%), indicating the expected pro-inflammatory phenotype under the applied stimulation conditions. Please click here to view a larger version of this figure.
Users should consider several constraints when applying this technique. First, donor variability in PBMC-derived macrophages can introduce substantial variance in phagocytic output, and we recommend using multiple donors (n ≥ 3) with individual donor data reported alongside pooled results. Second, the 2D co-culture format does not recapitulate the tumor microenvironment, and findings should be validated in 3D or in vivo models before clinical inference. Third, the 16-hour imaging window captures early phagocytic events but does not reflect longer-term processes such as antigen presentation or secondary immune activation. Thus, the combined use of real-time imaging and endpoint quantification provides a complementary framework that enhances both interpretability and reproducibility of ADCP measurements.
Access restricted. Please log in or start a trial to view this content.
Protocol
This protocol involves the use of primary macrophages derived from blood samples of healthy donors. The collection and processing of the samples were performed in accordance with the guidelines of the Institutional Review Board (IRB) of China Medical University.
1. Preparation of PBMC-Derived Macrophages
NOTE: Perform all procedures involving human blood under institutional IRB approval (e.g., CMUH IRB). Obtain informed consent from healthy donors prior to blood collection.
CAUTION: Handle all human blood products under Biosafety Level 2 conditions using universal precautions.
- Blood collection
- Collect whole blood from a healthy donor into 10 mL ethylenediaminetetraacetic acid (EDTA)-coated vacutainer tubes.
- Blood dilution
- Dilute the whole blood at a 1:1 ratio with ice-cold phosphate-buffered saline (PBS; Ca2⁺-/Mg2⁺-free) (e.g., 10 mL blood + 10 mL PBS).
- Mix by inversion three to five times.
NOTE: Keep PBS on ice prior to use. Cold temperature helps preserve cell viability during processing.
- Density gradient layering
- Carefully layer the diluted blood over Ficoll–Paque PLUS at a 2:1 volume ratio (v/v) in a conical tube (e.g., 8 mL blood over 4 mL Ficoll in a 15 mL tube, or 30 mL over 15 mL in a 50 mL tube).
- Equilibrate both the diluted blood and Ficoll–Paque PLUS to 20°C ± 2°C prior to layering.
- Remove Ficoll–Paque PLUS from 4°C storage at least 30 min before use, or warm briefly in a 20°C ± 2°C water bath.
- Do not use cold reagents, as Ficoll density is calibrated for 20°C ± 2°C, and deviations will compromise separation efficiency and PBMC yield.
NOTE: Tilt the tube at a 45° angle and pipette the blood slowly along the wall to maintain a sharp interface. Do not disturb the Ficoll layer.
- Centrifugation
- Centrifuge at 400 × g for 30 min at 20°C with the brake off (Figure 1).
NOTE: Braking will disrupt the density gradient and reduce PBMC yield.
- Centrifuge at 400 × g for 30 min at 20°C with the brake off (Figure 1).
- PBMC collection
- Carefully aspirate only the buffy coat layer (the whitish interface between the plasma and Ficoll layers), without disturbing the plasma above or the Ficoll layer below, using a serological pipette.
- Transfer the collected layer to a new 50 mL conical tube.
- PBMC washing
- Add PBS to bring the total volume up to 25 mL in a 50 mL conical tube.
- Use a 50 mL tube to ensure proper centrifugation and balancing.
- Centrifuge at 300 × g for 10 min.
- RBC lysis
- Discard the supernatant.
- Resuspend the pellet in 5 mL red blood cell (RBC) lysis buffer by gentle pipetting up and down with a serological pipette until the pellet is fully dispersed and no visible clumps remain.
- Incubate at room temperature for 5 min.
CAUTION: Complete dispersion is required to ensure uniform lysis; however, avoid vigorous pipetting or vortexing, which can damage PBMCs. Do not exceed 5 min of incubation with RBC lysis buffer, as prolonged exposure may compromise PBMC viability.
- PBMC pelleting
- Centrifuge at 500 × g for 5 min to pellet PBMCs and remove lysed RBC debris.
- Final resuspension
- Discard the supernatant.
- Resuspend the pellet in 5 mL ImmunoCult-SF macrophage medium.
NOTE: Under standard conditions, 10 mL of whole blood typically yields 1.5–2.0 × 10⁷ PBMCs.
2. Macrophage Differentiation (Days 0–7)
NOTE: Use non-tissue culture (TC)-treated Petri dishes to select for differentiated macrophages derived from monocytes by adherence. Non-adherent lymphocytes will be washed away during subsequent culture.
- Day 0: Cell seeding
- Perform cell counting and seed 1 × 10⁷ PBMCs into a non-TC-treated 10 cm Petri dish.
- Bring the total volume to 10 mL using ImmunoCult-SF macrophage medium supplemented with 100 ng/mL M-CSF (prepared by adding M-CSF stock directly to the complete medium immediately before use and mixing by gentle inversion).
NOTE: The protocol can be scaled proportionally to accommodate variations in donor PBMC yield, using a seeding density starting from 1 × 10⁶ cells/mL as a baseline.
- Incubation and monitoring
- Incubate at 37°C with 5% CO₂ in a humidified incubator.
- Monitor the formation of floating monocyte clusters and the appearance of adherent cells daily.
NOTE: Monocytes will gradually increase in size and form clusters as differentiation progresses. Some monocytes will begin to attach to the plate. No intervention is required at this step.
- Day 5: Media supplementation
- Gently add 5 mL of fresh ImmunoCult-SF macrophage medium supplemented with 100 ng/mL M-CSF to the dish, taking care to avoid disturbing the adherent macrophages.
- Continue the culture for an additional 2 days (until Day 7).
CAUTION: Add fresh medium gently along the side of the dish to avoid disturbing adherent macrophages, as mechanical disruption may affect differentiation efficiency and cell yield.
NOTE: Avoid replacing the medium to preserve autocrine/paracrine factors that support macrophage differentiation.
- Day 7: Morphological assessment
- Examine macrophage differentiation efficiency under an inverted microscope.
- Adherent cells exhibit characteristic macrophage morphology: large, flattened, and irregularly shaped, with visible pseudopodia.
- On Day 7, well-differentiated macrophages should be visible.
CAUTION: Morphological assessment at Day 7 serves as a critical prerequisite for subsequent flow cytometry validation. Well-differentiated macrophages should be clearly visible under the microscope, and a higher proportion of adherent cells with macrophage morphology reflects greater differentiation efficiency (approximately 70% confluency of adherent macrophages with characteristic morphology is considered indicative of successful differentiation). Cultures showing sparse adherence, predominantly rounded cells, or otherwise poor morphological differentiation are unlikely to yield reliable flow cytometry results and should not proceed to stimulation and staining.
3. Macrophage Polarization (Days 8–10)
- Collection and clarification of conditioned medium
- On Day 8, carefully aspirate the 15 mL of medium from the culture dish without disturbing the adherent macrophages and transfer it to a sterile 50 mL conical tube.
- Centrifuge the collected medium at 400 × g for 5 min to pellet cell debris.
- Retain the clarified supernatant for the next step.
- Interferon gamma (IFN-γ) and lipopolysaccharide (LPS) stimulation
- Transfer the clarified 15 mL supernatant to a new sterile tube and supplement with 100 ng/mL IFN-γ and 1 µg/mL LPS.
- Mix thoroughly by gentle pipetting up and down (5–10 times) to ensure uniform cytokine distribution without introducing bubbles.
- Return the full 15 mL of cytokine-supplemented medium to the original culture dish, gently pipetting along the inner wall to avoid disturbing the adherent macrophages.
- Incubate at 37°C with 5% CO₂ for 48 h (Day 8 to Day 10).
NOTE: Utilize conditioned (old) medium to preserve autocrine/paracrine factors. This combination of IFN-γ and LPS is used to polarize macrophages into a pro-inflammatory phenotype. Under the IFN-γ (100 ng/mL) and LPS (1 µg/mL) stimulation conditions used in this protocol, macrophages display characteristic morphological changes, including elongated lamellipodia consistent with an activated pro-inflammatory state, as well as CD11b and CD80 expression.
CAUTION: Handle LPS with appropriate laboratory safety procedures, as it is a bioactive endotoxin that may cause inflammatory responses upon exposure.
4. Confirmation of Inflammatory Phenotype Markers of IFN-γ- and LPS-Stimulated Macrophages by Flow Cytometry
- Cell harvesting
- Harvest a subset of polarized macrophages on Day 10 for phenotyping.
- Add 10 mM EDTA in PBS and incubate for 10–15 min at 37°C.
- Detach cells by gentle pipetting.
NOTE: Extend the EDTA incubation for an additional 30 min at 37°C if cells remain adherent, then repeat gentle pipetting. Avoid vigorous pipetting or mechanical scraping to preserve cell viability and surface marker integrity.
- Antibody staining setup
- Stain cells with fluorochrome-conjugated antibodies against CD11b (pan-macrophage lineage marker), CD80 (inflammatory marker), and CD206 (anti-inflammatory marker used as a negative exclusion marker for inflammatory phenotype identification).
- Staining procedure
- Transfer 5 × 10⁵ detached macrophages into a flow cytometry tube containing 100 µL of cold PBS.
- Add CD11b-FITC, CD80-PE, and CD206-PerCP-Cy5.5 antibodies to a final concentration of 1 µg/mL each.
- Mix the cell suspension by gentle pipetting.
- Incubate samples on ice for 1 h, protected from light.
- Centrifuge samples at 300 × g for 1 min at 4°C.
- Aspirate the supernatant carefully.
- Add 0.5 mL of cold PBS to wash the cell pellet.
- Centrifuge samples at 300 × g for 1 min at 4°C.
- Discard the supernatant.
- Resuspend the cell pellet in 200 µL of cold PBS.
- Add DAPI to a final concentration of 1 µg/mL.
NOTE: Include appropriate isotype controls and a viability dye (e.g., DAPI or Viobility 405/452 Fixable Dye).
- Flow cytometry analysis
- Acquire stained samples using a flow cytometer.
- Confirm expression of CD11b and CD80 in the macrophage population.
- Proceed to the phagocytosis assay only after confirming marker expression consistent with an inflammatory phenotype.
- Flow cytometry acquisition and setup
- Instrument setup
- Configure the flow cytometer using the following channels: Pacific Blue/V450 (DAPI), FITC (CD11b), PE (CD80), and PerCP-Cy5.5 (CD206).
- Set the acquisition parameter to collect 10,000 events per sample within the defined parent gate.
- Threshold and gain calibration
- Open four dot plots displaying FSC on the x-axis and one fluorophore channel on the y-axis.
- Prepare cells stained with corresponding isotype control antibodies matched to each fluorophore.
- Acquire isotype control samples.
- Adjust the gain for each channel to position the isotype control population below 101 on the log scale.
- Use this threshold to define background signal levels.
NOTE: Use a log scale range of 101 to 101·5 to establish reliable separation between background and specific signal.
- Compensation
- Add one drop of compensation beads into a 1.5 mL microcentrifuge tube.
- Add the corresponding fluorophore-conjugated antibody to a final concentration of 1 µg/mL.
- Incubate for 30 min on ice, protected from light.
- Centrifuge at 400 × g for 1 min.
- Discard the supernatant.
- Resuspend beads in 200 µL of cold PBS.
- Acquire single-color controls.
- Apply spectral compensation to correct fluorophore spillover.
- Gating strategy
- Live cell selection
- Display Pacific Blue/V450 (DAPI) on the y-axis and FSC on the x-axis.
- Gate on DAPI-negative events (below 101) to select live cells.
- Macrophage identification
- Set the live-cell population as the parent gate.
- Display FITC (CD11b) on the y-axis and FSC on the x-axis.
- Gate on CD11b⁺ events (above 101).
- Inflammatory phenotype identification
- Set the CD11b⁺ population as the parent gate.
- Display PE (CD80) on the y-axis and PerCP-Cy5.5 (CD206) on the x-axis.
- Apply quadrant gating at 101.5 on both axes.
- Identify CD80⁺CD206⁻ cells in the upper-left quadrant (Q1).
- Live cell selection
- Instrument setup
- Acceptance criteria
- Confirm that ≥90% of cells within the CD11b⁺ parent gate are CD80⁺CD206⁻.
- Proceed to the phagocytosis assay only when this threshold is achieved.
- Repeat PBMC isolation, M-CSF differentiation, and IFN-γ/LPS stimulation if samples fail to meet this criterion.
5. Antibody-Dependent Phagocytosis Assay
NOTE: Verify stable GFP expression in cancer cells before assay setup. Confirm CD24 expression on target cells prior to the assay. Use cancer cells with 50%–100% CD24 positivity for optimal performance. MDA-MB-468 cells used in this protocol exhibit 100% CD24 positivity.
- Macrophage seeding
- Seed IFN-γ- and LPS-stimulated macrophages, as validated in Step 4, at 2 × 10⁵ cells per well in a 24-well tissue culture plate.
- Incubate the plate at 37°C under static conditions with 5% CO₂ for 12–16 h to allow cell adherence (Figure 2A).
NOTE: Ensure firm macrophage adherence before proceeding. Poorly adhered macrophages may detach during imaging and confound results.
- Preparation of cancer cells
- Culture CD24-positive GFP-tagged breast cancer cells (MDA-MB-468) to 70%–80% confluency.
- Aspirate the culture medium.
- Wash the cell monolayer once with PBS.
- Detachment of cancer cells
- Add 10 mM EDTA in PBS to the culture dish.
- Incubate cells at 37°C for 5–10 min.
- Detach cells by gentle pipetting to achieve complete cell release.
NOTE: Avoid trypsin for cell detachment. Enzymatic digestion may cleave CD24 from the cell surface and compromise antibody binding.
- Collection and counting of cancer cells
- Collect detached cells into a centrifuge tube.
- Centrifuge cells at 300 × g for 5 min.
- Discard the supernatant.
- Resuspend the cell pellet in complete RPMI medium.
- Count viable cells.
- Antibody opsonization of cancer cells
- Resuspend cancer cells at a density of 2 × 10⁵ cells/mL in 0.5 mL of complete RPMI medium.
- Add anti-CD24 monoclonal antibody to a final concentration of 1 µg/mL.
- Mix the cell suspension by gentle pipetting to ensure uniform antibody distribution.
- Incubate the cells at 37°C for 30 min under static conditions.
NOTE: Include an isotype-matched IgG control at the same concentration as a negative control for antibody-dependent phagocytosis.
- Preparation for co-culture
- Do not wash the cells after opsonization.
- Proceed directly to co-culture to maintain antibody coating on the cell surface.
- Co-culture setup
- Add 1 × 10⁵ antibody-opsonized GFP-tagged breast cancer cells to each well containing macrophages.
- Maintain an effector-to-target ratio of 2:1.
NOTE: Adjust the effector-to-target ratio based on experimental design. Use higher macrophage-to-cancer cell ratios than the described 2:1 ratio (e.g., 3:1 or 5:1) to increase cell–cell contact frequency and enhance detection of phagocytic events.
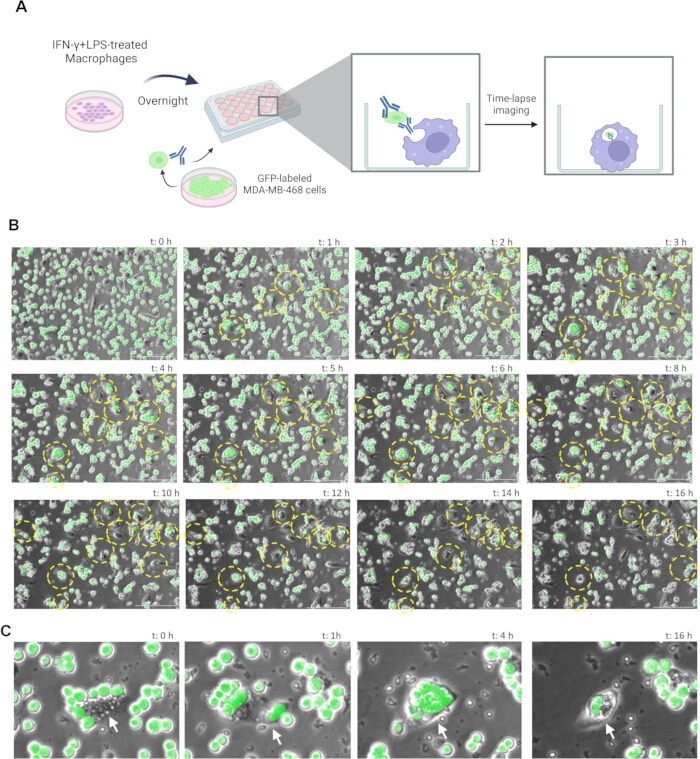
Figure 2. Time-lapse imaging of antibody-dependent cellular phagocytosis. (A) Schematic overview of the co-culture system and time-lapse imaging setup. Imaging parameters included a 10 min interval over a total acquisition time of 16 h (97 frames), using a 10× objective with phase contrast and GFP channels. (B) Representative time-lapse images from 1 h to 16 h showing phagocytic events characterized by the internalization of GFP-positive cancer cells by macrophages over time. Yellow dashed circles highlight representative phagocytic events. In the phase contrast channel, engulfed cancer cells appear as phase-bright intracellular structures within the macrophage cytoplasm (white arrows). In the GFP channel, fluorescence localized within macrophages confirms internalization. (C) Enlarged views of representative phagocytic events at 0, 1, 4, and 16 h, illustrating the sequential process of macrophage-mediated engulfment of GFP-labeled cancer cells. The image sequence was selected as representative based on clear visualization of macrophage-mediated phagocytic events. White arrows indicate macrophages interacting with and internalizing target cells. Please click here to view a larger version of this figure.
6. Time-Lapse Imaging (Automated live-cell imaging system)
NOTE: Configure the imaging protocol using a Lionheart automated live-cell imaging system and Gen5 automated live-cell imaging software prior to the assay. Obtain appropriate training before operating the imaging system to ensure accurate setup, optimal performance, and safe use.
- Instrument preparation
- Switch on the imaging system, environmental control module, and CO₂ gas supply at least 1 h before imaging.
- Open the Environment Control panel in automated live-cell imaging software.
- Set temperature to 37°C and CO₂ to 5%.
- Confirm that the chamber temperature stabilizes within ± 0.2°C and CO₂ at 5.0% ± 0.1% before loading the plate.
- Plate setup
- Place the 24-well plate into the imaging chamber of the imaging system.
- Initial configuration
- Open Task Manager of the automated live-cell imaging software.
- Select [Imager manual mode].
- Click [Capture now] to initialize imaging parameters.
- Select a 10× objective.
- Select microplate as the filter setting.
- Select a 24-well plate from the plate library of the automated live-cell imaging software.
- Focus and image setup
- Select the Phase Contrast channel.
- Select a representative well (e.g., A1).
- Activate autofocus prior to time-lapse acquisition.
- Capture an image using the camera icon.
- Confirm cell morphology and focus quality.
- Navigate to [Process/Analyze].
- Select [Create experiment from an image set] to configure the experiment.
- Time-lapse acquisition parameters
- Open the [Procedure] settings panel.
- Set temperature to 37°C and CO₂ to 5%.
- Under [Start Kinetic], set run time to 16:00:00.
- Set imaging interval to 0:10:00.
- Set total reads to 97.
- Use an imaging interval of 10–15 min to balance temporal resolution and phototoxicity while capturing early phagocytic events.
- Imaging channel configuration
- Set Channel 1 to Phase Contrast.
- Set Channel 2 to GFP (Ex 469/35, Em 525/39).
- Select a 10× objective for optimal field of view and resolution.
- Set illumination, integration time, and gain to [Auto], or manually adjust.
- Use a typical GFP exposure time of 100–300 ms to avoid signal saturation.
- Apply identical imaging settings across all wells.
- Imaging position setup
- Open the [Define beacons] menu.
- Disable Z-stack acquisition.
- Disable montage acquisition.
- Perform imaging at a single focal plane.
- Define imaging positions manually by selecting representative, non-overlapping regions within each well using the microscope icon.
- Maintain identical imaging positions across all time points.
- Select at least 4–6 fields of view per well.
- Time-lapse acquisition
- Click [Play] to initiate automated time-lapse imaging.
- Data export and visualization
- Open the saved experiment file after acquisition.
- Select imaging positions.
- Export time-lapse data in MP4 format.
- Open the [Process Tool].
- Apply [Image Deconvolution] if needed to enhance visualization and identify representative phagocytosis events.
NOTE: Use time-lapse imaging for qualitative visualization only. Non-engulfed GFP-positive cancer cells may overlap or transiently associate with macrophages, leading to false-positive signals. Perform quantitative analysis using a separate endpoint assay.
7. Endpoint Phagocytosis Quantification
- Removal of non-internalized cells
- Perform the assay under identical co-culture conditions.
- Terminate the experiment at 4 h.
- Remove the culture medium.
- Add 10 mM EDTA in PBS.
- Incubate at 37°C for 5 min.
- Wash gently with PBS to remove non-internalized GFP-positive cells.
- Add fresh macrophage medium.
- Image acquisition for quantification
- Acquire images using phase contrast and GFP channels.
- Capture at least 4–6 fields of view per well.
- Analyze a minimum of three wells per condition.
- Definition of phagocytic events
- Identify macrophages containing GFP-positive signals fully enclosed within the cellular boundary.
- Image analysis
- Open images in ImageJ software.
- Use the Cell Counter plugin.
- Count total macrophages.
- Count macrophages containing internalized GFP-positive cells.
- Calculation of phagocytosis index
- Calculate:

- Perform analysis in a blinded manner.
- Repeat across at least three independent experiments.
- Calculate:
- Data presentation
- Present representative time-lapse images chronologically (Figure 2B and Figure 2C).
- Present representative endpoint images (Figure 3A and Figure 3B).
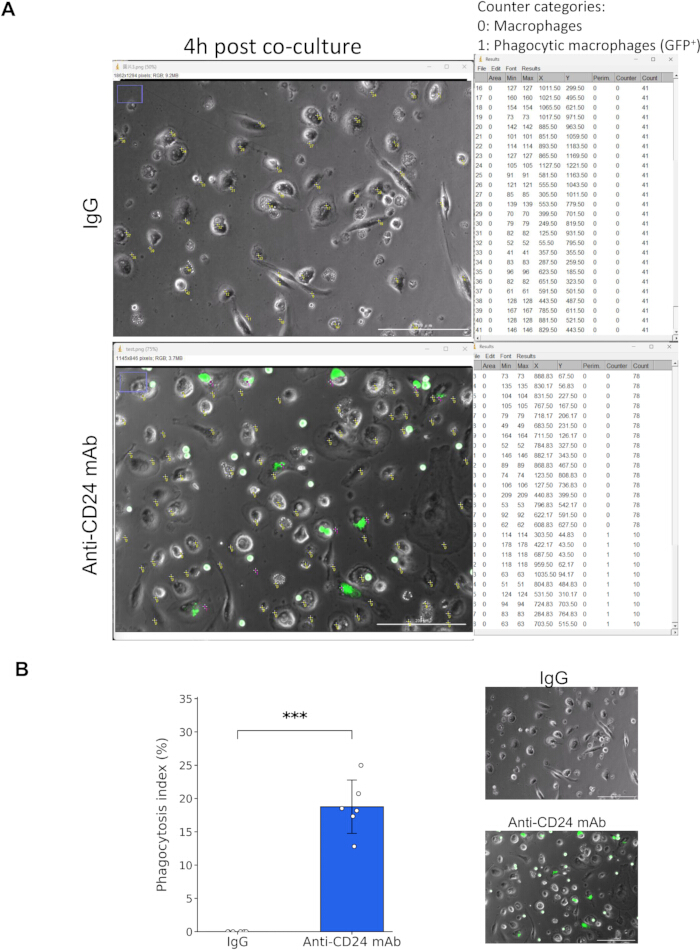
Figure 3. Quantification of antibody-dependent macrophage phagocytosis by endpoint analysis. (A) Representative phase-contrast and GFP fluorescence images of macrophages co-cultured with GFP-labeled breast cancer cells for 4 h, followed by removal of non-engulfed cells using EDTA treatment. Phase contrast and GFP channels were merged to identify macrophages and internalized GFP-positive targets. Macrophages (counter 0) and GFP-positive engulfing macrophages (counter 1) were enumerated using the Cell Counter plugin in ImageJ. In the IgG control condition, no phagocytic events were observed, whereas anti-CD24 monoclonal antibody treatment resulted in clear intracellular GFP-positive signals within macrophages, indicating active phagocytosis. Scale bar = 200 µm. (B) Quantification of the phagocytosis index, defined as the percentage of macrophages containing internalized GFP-positive cells relative to the total macrophage population. Anti-CD24 monoclonal antibody significantly increased the phagocytosis index compared to the IgG control (0.00 ± 0.00% vs. 18.76 ± 4.01%, mean ± SD; n = 6 fields per group; ***p < 0.001, Welch’s unpaired t-test). Data are representative of at least three independent experiments. Please click here to view a larger version of this figure.
Access restricted. Please log in or start a trial to view this content.
Results
Successful generation and polarization of macrophages from PBMCs were confirmed using morphological assessment and flow cytometry analysis (Figure 1). PBMCs isolated by density gradient centrifugation were cultured in M-CSF-supplemented medium, resulting in adherent cells with characteristic macrophage morphology by Day 7. Following stimulation with IFN-γ and LPS, cells exhibited a phenotype consistent with activation under the applied conditions. Flow cytometry analysis demonstrated th...
Access restricted. Please log in or start a trial to view this content.
Discussion
Several steps in this protocol are critical for obtaining reliable and reproducible results. First, the quality and purity of PBMC isolation directly influence macrophage yield and differentiation efficiency. Careful layering of diluted blood over the Ficoll gradient and centrifugation with the brake turned off are essential to preserve the buffy coat interface. Incomplete RBC lysis or excessive incubation with lysis buffer will compromise PBMC viability. Second, proinflammatory macrophage polarization must be verified b...
Access restricted. Please log in or start a trial to view this content.
Disclosures
The authors disclose no conflict of interest.
Acknowledgements
This work was supported by the Cancer Biology and Precision Therapeutics Center, China Medical University, from the Featured Areas Research Center Program within the framework of the Higher Education Sprout Project by the Ministry of Education (MOE) in Taiwan (CBPTC-PROJ-5-2).
We thank the Cancer Biology and Precision Therapeutics Center for providing funding and academic support.
Access restricted. Please log in or start a trial to view this content.
Materials
| Name | Company | Catalog Number | Comments |
|---|---|---|---|
| 0.5 M Ethylenediaminetetraacetic acid (EDTA) stock solution | Sigma-Aldrich (or equivalent) | E7889 (or equivalent) | Used to prepare 10 mM EDTA working solution in PBS for cell detachment |
| 24-well tissue culture plates (TC-treated) | Corning (or equivalent) | 3524 | Used for co-culture of macrophages and cancer cells during phagocytosis assay |
| Anti-human CD206 antibody (flow cytometry) | BioLegend (or equivalent) | 321122 (or equivalent) | Marker for alternative macrophage phenotype |
| Anti-human CD24 monoclonal antibody | Thermo Fisher Scientific (or equivalent) | MA1-91384 (or equivalent) | Used to opsonize cancer cells for antibody-dependent phagocytosis |
| Automated live-cell imaging system with environmental control chamber (e.g., Lionheart FX) | Agilent Technologies (or equivalent) | BioTek Lionheart FX Automated Microscope | Enables long-term time-lapse imaging under controlled temperature and 2 conditions |
| Imaging software for automated live-cell imaging (e.g., Gen5) | Agilent Technologies (or equivalent) | N/A | Used for acquisition and analysis of time-lapse imaging data |
| Centrifuge (swing-bucket rotor) | Thermo Fisher Scientific (or equivalent) | Multifuge X4R Pro with TX-1000 rotor (or equivalent) | Used for PBMC isolation and cell washing steps |
| 2 incubator (37°C, 5% 2) | Thermo Fisher Scientific (or equivalent) | Forma Direct Heat 2 Incubator (or equivalent) | Maintains physiological conditions for cell culture |
| 2 gas supply with regulator | Agilent Technologies (or equivalent) | N/A | Supplies 2 for incubator and imaging system environmental control |
| Conical tubes (15 mL and 50 mL) | Corning (or equivalent) | 352070 (or equivalent) | Used for PBMC isolation, washing, and centrifugation steps |
| EDTA-coated blood collection tubes (vacutainers) | BD Biosciences (or equivalent) | 367863 (or equivalent) | Used for collection of whole blood samples from donors |
| Ficoll-Paque PLUS | Cytiva (or equivalent) | 17144003 (or equivalent) | Density gradient medium for isolation of PBMCs |
| Flow cytometer (e.g., FACSCanto II) | BD Biosciences (or equivalent) | BD FACSCanto II | Used for phenotypic analysis of macrophages |
| Compensation beads (flow cytometry) | Biolegend (or equivalent) | 424602 | Used for single-color compensation controls |
| FITC anti-human CD11b antibody (flow cytometry) | BioLegend (or equivalent) | 101205 (or equivalent) | Marker used to identify macrophages |
| PE anti-human CD80 antibody (flow cytometry) | BioLegend (or equivalent) | 375410 (or equivalent) | Marker associated with activated macrophage phenotype |
| GFP-expressing breast cancer cell line (MDA-MB-468) | ATCC (or equivalent) | HTB-132 (or equivalent) | Target cells used in phagocytosis assay; GFP enables visualization |
| ImmunoCult-SF macrophage medium | STEMCELL Technologies (or equivalent) | 10961 (or equivalent) | Serum-free medium used for macrophage differentiation |
| Dulbecco’s Modified Eagle Medium (DMEM) | Thermo Fisher Scientific (or equivalent) | 12100046 | Used for culture and resuspension of cancer cells |
| Isotype control antibody (IgG) | Bio X Cell (or equivalent) | BE0297 (or equivalent) | Negative control for antibody-dependent phagocytosis assay |
| Lipopolysaccharide (LPS) | Sigma-Aldrich (or equivalent) | L2630 (or equivalent) | Stimulus used to activate macrophages in combination with IFN-γ |
| Recombinant human interferon gamma (IFN-γ) | STEMCELL Technologies (or equivalent) | 78020 (or equivalent) | Cytokine used for macrophage activation |
| Recombinant human macrophage colony-stimulating factor (M-CSF) | STEMCELL Technologies (or equivalent) | 78057 (or equivalent) | Growth factor used for macrophage differentiation |
| Pasteur pipettes or serological pipettes | Jetbiofil (or equivalent) | GSP010010 (or equivalent) | Used for liquid handling during PBMC isolation and cell culture |
| PBS (Ca2+-/Mg2+-free) | Thermo Fisher Scientific (or equivalent) | BP399-500 (or equivalent) | Buffer used for washing cells and dilution steps |
| Petri dishes (100 mm, non–tissue culture-treated) | Corning (or equivalent) | 430591 | Used for macrophage differentiation via adherence selection |
| Red blood cell (RBC) lysis buffer | BioLegend (or equivalent) | 420301 (or equivalent) | Used to remove red blood cells during PBMC isolation |
| Viobility 405/452 Fixable Dye | Miltenyi Biotec (or equivalent) | 130-130-404 (or equivalent) | Used to assess cell viability during flow cytometry analysis |
| DAPI | Sigma-Aldrich (or equivalent) | D9542 (or equivalent) | Used for dead cell exclusion in flow cytometry |
References
- Sung, H., et al. Global cancer statistics 2020: GLOBOCAN estimates of incidence and mortality worldwide for 36 cancers in 185 countries. CA Cancer J Clin. 71 (3), 209-249 (2021).
- Perou, C. M., et al. Molecular portraits of human breast tumours. Nature. 406 (6797), 747-752 (2000).
- Foulkes, W. D., Smith, I. E., Reis-Filho, J. S. Triple-negative breast cancer. N Engl J Med. 363 (20), 1938-1948 (2010).
- Dent, R., et al. Triple-negative breast cancer: Clinical features and patterns of recurrence. Clin Cancer Res. 13 (15 Pt 1), 4429-4434 (2007).
- Lin, N. U., et al. Sites of distant recurrence and clinical outcomes in patients with metastatic triple-negative breast cancer: High incidence of central nervous system metastases. Cancer. 113 (10), 2638-2645 (2008).
- Bianchini, G., De Angelis, C., Licata, L., Gianni, L. Treatment landscape of triple-negative breast cancer - expanded options, evolving needs. Nat Rev Clin Oncol. 19 (2), 91-113 (2022).
- Lecoultre, M., Dutoit, V., Walker, P. R. Phagocytic function of tumor-associated macrophages as a key determinant of tumor progression control: A review. J Immunother Cancer. 8 (2), (2020).
- Mantovani, A., Allavena, P., Marchesi, F., Garlanda, C. Macrophages as tools and targets in cancer therapy. Nat Rev Drug Discov. 21 (11), 799-820 (2022).
- Chan, S. H., Lin, C. Y., Tseng, H. J., Wang, L. H. Cd24a knockout results in an enhanced macrophage- and cd8⁺ t cell-mediated anti-tumor immune responses in tumor microenvironment in a murine triple-negative breast cancer model. J Biomed Sci. 32 (1), 73 (2025).
- Majeti, R., et al. CD47 is an adverse prognostic factor and therapeutic antibody target on human acute myeloid leukemia stem cells. Cell. 138 (2), 286-299 (2009).
- Barkal, A. A., et al. CD24 signalling through macrophage siglec-10 is a target for cancer immunotherapy. Nature. 572 (7769), 392-396 (2019).
- Wang, X., et al. CD24-siglec axis is an innate immune checkpoint against metaflammation and metabolic disorder. Cell Metab. 34 (8), 1088-1103.e6 (2022).
- Chan, S. H., et al. Identification of the novel role of CD24 as an oncogenesis regulator and therapeutic target for triple-negative breast cancer. Mol Cancer Ther. 18 (1), 147-161 (2019).
- Huang, S., Zhang, X., Wei, Y., Xiao, Y. Checkpoint CD24 function on tumor and immunotherapy. Front Immunol. 15, 1367959 (2024).
- Weiskopf, K., Weissman, I. L. Macrophages are critical effectors of antibody therapies for cancer. MAbs. 7 (2), 303-310 (2015).
- Cao, X., et al. Promoting antibody-dependent cellular phagocytosis for effective macrophage-based cancer immunotherapy. Sci Adv. 8 (11), eabl9171 (2022).
- Aderem, A., Underhill, D. M. Mechanisms of phagocytosis in macrophages. Annu Rev Immunol. 17, 593-623 (1999).
- Flannagan, R. S., Jaumouille, V., Grinstein, S. The cell biology of phagocytosis. Annu Rev Pathol. 7, 61-98 (2012).
- Denardo, D. G., Ruffell, B. Macrophages as regulators of tumour immunity and immunotherapy. Nat Rev Immunol. 19 (6), 369-382 (2019).
- Horsthemke, M., Wilden, J., Bachg, A. C., Hanley, P. J. Time-lapse 3d imaging of phagocytosis by mouse macrophages. J Vis Exp. (140), e57566 (2018).
Access restricted. Please log in or start a trial to view this content.
Reprints and Permissions
