This protocol describes the preparation of hexamethyldisiloxane (HMDS)-facilitated diffusion dishes, followed by ion-selective electrode measurements to quantify fluoride ion mass in the serum, bone, and teeth of mice. The method provides a sensitive, calibration-based approach for evaluating fluoride accumulation in biological specimens.
Method Article
Quantification of Fluoride in Serum, Bone, and Teeth in a Murine Model Using Hexamethyldisiloxane-Facilitated Diffusion and Ion-Selective Electrode Measurements
In This Article
Summary
Abstract
Quantifying fluoride levels in biological tissues is essential for understanding fluoride exposure, metabolism, and toxicity. This protocol describes a sensitive and reproducible method for measuring fluoride ion mass in serum, bone, and teeth using hexamethyldisiloxane (HMDS)‑facilitated diffusion followed by ion‑selective electrode (ISE) analysis. Biological specimens, including serum, femoral bone, and mandibular incisors, are collected from mice exposed to controlled fluoride treatments. Bone and tooth specimens are ashed, milled, and hydrated, while serum is processed directly. Each specimen is transferred to a diffusion dish containing ultrapure water and sealed with a petrolatum‑lined lid bearing sodium hydroxide droplets that serve as fluoride traps. Injection of HMDS‑saturated sulfuric acid initiates fluoride release and diffusion, allowing liberated fluoride ions to be quantitatively captured in the traps. Following overnight diffusion, the fluoride trap droplets are combined into a single sample, acidified to the required pH range, and adjusted to a defined volume for ISE measurement. Calibration diffusion dishes prepared with known fluoride masses generate a standard curve for quantification, and quality control samples verify electrode stability. Representative results from adolescent and mature mice exposed to 0 or 125 ppm fluoride demonstrate the method’s ability to detect age‑ and dose‑dependent differences in fluoride levels across serum, bone, and teeth. This protocol provides a robust, calibration‑based approach for quantifying fluoride in diverse biological matrices and is well‑suited for studies investigating fluoride exposure, tissue deposition, and toxicological outcomes in murine models. A key advantage of this method is its ability to accurately quantify fluoride in extremely small specimens, including the 3–5 mg of ash obtained from individual mouse incisors, because the diffusion process concentrates all released fluoride into a measurable sample volume of less than 100 µL.
Introduction
Fluoride is a naturally occurring anion, and the optimal level of fluoride is effective in preventing dental caries1,2,3,4,5. In the United States (U.S.), community water fluoridation at 0.7 ppm has been implemented as a public health strategy to reduce caries incidence and promote oral health6. However, prolonged ingestion of excessive fluoride can adversely affect multiple tissues. High fluoride exposure disrupts enamel formation7,8,9, alters bone formation10, and compromises skeletal integrity11.
At the cellular level, fluoride exposure induces several metabolic disturbances, including oxidative stress12, endoplasmic reticulum stress13 , epigenetic modifications that alter gene expression14, and apoptosis in ameloblasts15,16,17,18. Globally, elevated fluoride concentrations in groundwater (>1.5 ppm) pose a significant health concern. A recent predictive modeling study estimated that approximately 180 million people worldwide are potentially affected by excessive fluoride exposure, with the highest burden occurring in Asia and Africa1. Beyond drinking water, fluoride exposure also occurs through food (e.g., seafood; ~1.9 ppm), beverages (e.g., tea; 0.5–6 ppm19, and dental products such as toothpaste20 (1,000–1,500 ppm).
Understanding fluoride exposure, metabolism, and tissue deposition is therefore essential for evaluating both its therapeutic benefits and potential toxicological consequences. Accurate quantification of fluoride in biological specimens—including urine, serum, bone, and teeth—is a critical component of this work. However, measurement is analytically challenging due to fluoride’s chemical behavior and its strong affinity for calcium-rich matrices. Approximately 99% of the body’s fluoride resides in mineralized tissues such as bone and teeth21. To address these challenges, a variety of analytical techniques have been developed, including ion-selective electrode (ISE) potentiometry, ion chromatography, colorimetric assays, titrimetric procedures, and nuclear or activation-based methods22. Among these, the hexamethyldisiloxane (HMDS)–facilitated diffusion technique combined with fluoride-selective electrode measurement has emerged as one of the most reliable and widely used approaches for biological matrices due to its sensitivity, reproducibility, and compatibility with diverse sample types23,24,25,26,27,28,29.
Despite the availability of multiple analytical methods, each approach has limitations that may restrict its use in experimental or clinical research. Ion chromatography provides high sensitivity and selectivity, but requires specialized instrumentation and extensive sample preparation30,31. Colorimetric assays such as the SPADNS (sodium 2‑(parasulfophenylazo)‑1,8-dihydroxynaphthalene-3,6‑disulfonate) method are simple and inexpensive, but they are susceptible to interference from turbidity and endogenous chromophores, which limits their reliability in complex biological samples22,32,33. Titrimetric methods are cost-effective and straightforward, but lack the sensitivity required for trace-level fluoride detection in most biological specimens34. Nuclear or activation-based techniques offer exceptional sensitivity but require access to reactors or accelerator-based neutron sources, making them impractical for routine laboratory use35. In contrast, HMDS-facilitated diffusion followed by ISE measurement provides a practical balance of sensitivity, cost, and accessibility while ensuring complete liberation of fluoride from both soft and mineralized tissues. This is particularly advantageous for studies involving small animals, where tissue availability is limited and mineralized structures such as mouse incisors yield only 3–5 mg of ash per tooth.
The ability of the diffusion–ISE method to concentrate all released fluoride into a small, defined volume enables accurate quantification even in extremely small samples. This makes the method well-suited for toxicokinetic studies, dose–response experiments, and investigations of fluoride metabolism across developmental stages. Small rodents, particularly C57BL/6J mice, have been widely used as animal models for studying the effects of fluoride7,9,12,29,36 .
In this protocol, the authors apply the HMDS-facilitated diffusion technique followed by fluoride-selective electrode measurement to quantify fluoride in serum, bone, and teeth collected from mice exposed to a high fluoride dose (125 ppm) compared with untreated controls. The authors further compare fluoride accumulation in adolescent (6 weeks at the onset of treatment) and mature (18 weeks at the onset of treatment) mice to evaluate age-dependent differences in fluoride metabolism and tissue deposition. Mandibular incisors were selected as the representative dental tissue because rodent incisors erupt continuously and achieve a steady-state balance between eruption and occlusal wear by approximately 7 weeks of age. This continuous growth pattern provides a consistent and accessible gradient of enamel development, making murine incisors a widely used and well‑validated model for investigating enamel formation and dental fluorosis.
Protocol
All procedures described in this protocol have been performed in accordance with guidelines and regulations for the use of vertebrate animals approved by the Institutional Animal Care and Use Committee (IACUC) at Nova Southeastern University (Protocol No. 2023.02.MSuz1), which is accredited by the Association for Assessment and Accreditation of Laboratory Animal Care International (AAALAC). All animal work complied with the guide for the care and use of laboratory animals and the American Veterinary Medical Association (AVMA) Guidelines for the euthanasia of animals. All the materials used in this study are listed in the Table of Materials.
1. Animals and preparation and administration of sodium fluoride in a murine model
- Animals: Assign male C57BL/6J mice to two age categories: adolescent, 6 weeks at the onset of treatment, and mature, 18 weeks at the onset of treatment.
- Provide each group with either fluoride‑free deionized water (0 ppm F⁻) or sodium‑fluoride–supplemented drinking water (125 ppm F⁻) for a 6‑week exposure period.
- Include five animals in each age and treatment condition (N = 5/group).
- At the end of the exposure period, harvest serum, femurs, and mandibular incisors, and prepare all collected specimens for downstream analysis.
NOTE: Specimen: Processed material such as ashed bone, ashed tooth, and serum.
- Animal housing and diet: House mice under standard laboratory conditions with ad libitum access to food and water.
- Provide a fluoride‑free diet beginning one week prior to teeth, bone, and serum collection to minimize background fluoride levels.
- Sodium fluoride drinking water
- To prepare fluoride‑supplemented drinking water, dissolve sodium fluoride (NaF) in deionized water to achieve the desired fluoride concentration (e.g., 125 ppm F⁻).
- Filter the solution through a 0.2 µm vacuum filter into an autoclaved bottle. Prepare a fresh solution every 2 days.
CAUTION: NaF is toxic if ingested and may cause skin and eye irritation. Handle in a fume hood while wearing a lab coat, nitrile gloves, and safety goggles.
- For fluoride‑free control water, filter deionized water through a 0.2 µm vacuum filter into an autoclaved bottle. Prepare fresh water every 2 days.
- Provide fluoride‑supplemented or fluoride‑free drinking water ad libitum for the desired duration for fluoride treatment. Monitor water levels daily and replace bottles every 2 days.
- At the end of the exposure period, euthanize animals using carbon dioxide (CO₂) inhalation followed by decapitation. Euthanasia procedures were performed in accordance with the AVMA Guidelines for the Euthanasia of Animals and were approved as part of the institutional IACUC protocol.
CAUTION: CO2 is an asphyxiant. Perform procedures in a well-ventilated area and ensure the chamber functions properly. Avoid direct inhalation exposure.
2. Specimen preparation for fluoride measurement
- Blood collection
- Euthanize mice by CO₂ inhalation and immediately collect blood via terminal cardiac puncture using a 1 mL tuberculin syringe. Transfer blood into 1.5 mL microcentrifuge tubes. Dispose of all used needles and syringes in an approved institutional sharps waste container.
CAUTION: Syringe needles are sharp and may cause puncture injuries; handle with care. - Store blood for 30 min at room temperature, then centrifuge for 10 min at 2,000 × g.
- Transfer the supernatant (serum) to a microcentrifuge tube and store at −80 °C.
CAUTION: Ultra‑low freezers pose frostbite hazards. Wear insulated gloves when handling tubes and avoid prolonged skin contact with cold surfaces.
- Euthanize mice by CO₂ inhalation and immediately collect blood via terminal cardiac puncture using a 1 mL tuberculin syringe. Transfer blood into 1.5 mL microcentrifuge tubes. Dispose of all used needles and syringes in an approved institutional sharps waste container.
- Bones
- Extraction of femora: Following euthanasia, dissect the hind legs at the hip joints.
- Carefully remove all soft tissues from the femora. Wash tissues three times in deionized water. Store bones at -80 °C until further processing. Discard removed soft tissues and any contaminated materials in the institutional biological waste stream.
NOTE: Tissues may be fixed in 4% paraformaldehyde with 2% sucrose for 12–16 h for long‑term storage in 70% ethanol. This fixation procedure does not alter the accuracy of subsequent fluoride quantification. - Rinse bones thoroughly with deionized water. Blot excess moisture with a lint-free paper towel.
- Transfer bones into 1.5 mL microcentrifuge tubes with open lids to allow evaporation and place them in a drying oven at 60 °C for 12–16 h.
CAUTION: The drying oven may cause burns. Use heat-resistant gloves when handling samples. - Ashing of bones: Transfer dried bones into alumina crucibles. Place crucibles in a muffle furnace and heat to 600 °C at 150 °C/h, then hold for 6 h. Allow the furnace to cool to below 200 °C before removing crucibles. Dispose of any residual bone fragments or contaminated consumables in the institutional biological waste stream.
CAUTION: The muffle furnace and crucibles reach extreme temperatures, posing a severe burn hazard. Always allow the furnace to cool before handling crucibles. When removing crucibles, wear a lab coat, safety goggles, and heat‑resistant gloves, and use long forceps to avoid direct contact with hot surfaces.
CRITICAL STEP: Incomplete ashing will compromise downstream analyses. Verify that the bone material has reached a fully oxidized state before proceeding; any residual carbon will interfere with subsequent measurements.
NOTE: Properly ashed bone should appear uniformly light gray to white. Darker particles—especially black or charcoal‑like residues—indicate incomplete combustion. If discoloration is present, extend the ashing duration to allow complete removal of organic material. - Storage of ashed bones: Immediately after ashing, transfer bones into 1.5 mL microcentrifuge tubes. Seal the tubes with Parafilm and store them in a vacuum desiccator until use.
- Teeth
- Extraction of mandibular incisors: Make a horizontal cut at the level of the temporomandibular joint to separate the mandible from the maxilla.
- Perform mid-sagittal cuts to divide both the maxilla and mandible into left and right halves.
- Wash tissues three times in deionized water and carefully extract the mandibular incisors. Store extracted incisors at -80 °C until further use. Discard extracted soft tissues and any contaminated consumables in the institutional biological waste stream.
CAUTION: Use sharp dissection instruments carefully when performing cuts at the temporomandibular joint and mid-sagittal plane to avoid personal injury. Wear appropriate PPE, including gloves, a lab coat, and safety goggles.
NOTE: Tissues may be fixed in 4% paraformaldehyde with 2% sucrose for 12–16 h for long‑term storage in 70% ethanol. This fixation procedure does not alter the accuracy of subsequent fluoride quantification. - Teeth preparation for ashing: Rinse teeth thoroughly with deionized water and place them in 1% hydrogen peroxide (H₂O₂) for 12–16 h. Dispose of spent hydrogen peroxide solutions as hazardous chemical waste.
- Rinse again with deionized water, blot dry briefly with a lint‑free tissue, and transfer to 1.5 mL microcentrifuge tubes with open lids. Place tubes in a drying oven at 60 °C for 12–16 h.
CAUTION: Hydrogen peroxide is an oxidizer and may cause skin and eye irritation. Handle in a fume hood while wearing a lab coat, nitrile gloves, and safety goggles. Avoid contact with combustible materials. - Ashing of teeth: Transfer dried teeth into alumina crucibles and ash in a muffle furnace at a dwell temperature of 600 °C for 20 h, using a ramp rate of 150 °C/h.
- Remove crucibles only after the furnace has cooled below 200 °C.
CAUTION: The muffle furnace and crucibles reach extreme temperatures, posing a severe burn hazard. Allow the furnace to cool below 200 °C before handling crucibles. When removing crucibles, wear a lab coat, safety goggles, and heat‑resistant gloves, and use long forceps to avoid direct contact with hot surfaces.
CRITICAL STEP: Ensure complete oxidation; residual carbon will interfere with subsequent analyses.
NOTE: Ashed tooth material should appear uniformly light gray to white. Re‑ash if black residues remain. - Storage of ashed teeth specimen: Immediately after ashing, transfer teeth into 2 mL round-bottom microcentrifuge tubes.
- Seal the tubes with Parafilm and store them in a vacuum desiccator until use.
3. Preparation of HMDS-facilitated diffusion dishes
- Reagents and material
- 6 N sulfuric acid: At least two days before preparing diffusion dishes, make a stock of 6 N sulfuric acid.
NOTE: Diffusion dish: A sealed vessel designed to create a controlled closed environment in which released components from a processed biological material can be captured by a chemical trap affixed to the lid. The sealed design prevents exchange with outside air and ensures that released analytes are directed toward the trap for subsequent measurement. - Place a 1 L plastic beaker with a magnetic stir bar on a magnetic mixer and add 416 mL of ultrapure water.
- Using a 50 mL serological pipette, slowly add 84 mL of 36 N H₂SO₄ to the water while stirring continuously. The solution will become hot; allow it to cool to room temperature. Dispose of any unused or spent sulfuric acid solutions as hazardous chemical waste in the institutional chemical waste stream.
CAUTION: Sulfuric acid is highly corrosive. Handle in a fume hood while wearing acid-resistant gloves, a lab coat, and safety goggles. In case of contact, rinse immediately with copious water. - HMDS-saturated 6 N sulfuric acid: Transfer the 6 N sulfuric acid to a 2 L separating funnel and add 15 mL hexamethyldisiloxane (HMDS).
- Ensure that the stopper and stopcock are securely closed, hold the separating funnel sideways, and shake vigorously until tiny HMDS droplets are visible.
- Open the stopper to release the developing gas and repeat the process two additional times.
- Leave the stopper ajar for several hours. Store the separating funnel containing the 6 N HMDS‑saturated sulfuric acid in a stand inside the chemical fume hood. Dispose of HMDS‑containing sulfuric acid and contaminated materials as hazardous chemical waste.
CAUTION: HMDS is flammable and toxic by inhalation. Handle in a fume hood while wearing a lab coat, gloves, and safety goggles. Keep away from ignition sources. - 0.05 N sodium hydroxide: Dissolve 1 g NaOH pellets in 25 mL ultrapure water to prepare a 1 N stock solution.
- Mix 2 mL of the 1 N NaOH stock with 38 mL ultrapure water to obtain a 0.05 N NaOH solution.
- Aliquot the 0.05 N NaOH into 1.5 mL microcentrifuge tubes for single use, secure the lids with Parafilm, and store the tubes in a vacuum desiccator to minimize CO₂ absorption. Dispose of unused or spent sodium hydroxide solutions as hazardous chemical waste.
CAUTION: Sodium hydroxide is highly caustic and can cause severe burns. Wear a lab coat, gloves, and safety goggles. Handle solutions carefully to avoid splashes. - 0.2 N acetic acid: Add 575 µL glacial acetic acid to ultrapure water and adjust to a final volume of 50 mL to prepare 0.2 N acetic acid. Dispose of acetic acid solutions as hazardous chemical waste.
CAUTION: Acetic acid is corrosive and may irritate the skin, eyes, and respiratory tract. Handle in a chemical fume hood while wearing a lab coat, gloves, and safety goggles. - Petrolatum: Melt approximately 100 g petrolatum at 60 °C in an oven. Aspirate the liquid petrolatum into 10 mL syringes and allow it to cool and solidify. Petrolatum-filled syringes may be stored at room temperature for several weeks.
- Petri dish: Use 60 × 15 mm untreated Petri dishes for preparing diffusion dishes.
- Melt a small hole into the lid of a Petri dish using a heated 18-G syringe needle.
- Coat the inner rim of the lid with a continuous petrolatum seal using a 10 mL syringe fitted with a blunt 14 G needle. Dispose of all used needles in an approved institutional sharps waste container.
CAUTION: Syringe needles are sharp and can cause puncture injuries. Handle with care and dispose of in approved sharps containers. When heating needles, wear heat‑resistant gloves and eye protection to prevent burns. - NaF stock solutions for calibration diffusion dishes. Dissolve 4.19 g NaF in 1 L ultrapure water to prepare a 100 mM stock solution. Prepare 10 mM, 100 µM, and 10 µM stock solutions by sequential 1:10 dilutions of the 100 mM solution.
NOTE: One mole of NaF provides 19 g F⁻; therefore, 1 µL of 10 µM NaF contains 0.19 ng F⁻ and 1 µL of 10 mM NaF contains 190 ng F⁻.
NOTE: Calibration diffusion dishes: Diffusion dishes used specifically for calibration with a known mass of fluoride ions (F¯).
- 6 N sulfuric acid: At least two days before preparing diffusion dishes, make a stock of 6 N sulfuric acid.
- Specimen-specific diffusion dish preparations
- Serum diffusion dish: Pipette 3 mL ultrapure water into the bottom of the Petri dish and add 75 µL serum. Discard any serum-contaminated materials in the institutional biological waste stream. Continue with step 3.4.
- Bone diffusion dish
- Pulverization of bone ash: Use a micro spatula to grind the ashed bones inside the 1.5 mL microcentrifuge tubes to a fine powder. Proceed with the processing of the pulverized bone ash immediately. Dispose of consumables contaminated with bone ash in the institutional chemical waste stream.
- Weighing and hydration of bone ash
- Place the empty bottom of the Petri dish onto the weighing pan of an analytical balance with a readability of at least 0.1 mg.
- Transfer the milled bone ash from the 2 mL microcentrifuge tube into a small porcelain dish to minimize static charge and prevent powder dispersion.
- Using a micro spatula, add approximately 5 mg of bone ash to the dish and immediately cover the powder with 3 mL ultrapure water before removing the dish from the analytical balance to avoid ash dispersion.
- Record the exact weight of each bone ash specimen. Continue with step 3.4.
- Tooth diffusion dish
- Milling of ashed teeth
- Transfer the ashed incisors into 2 mL round‑bottom microcentrifuge tubes and add a 5 mm diameter stainless‑steel bead to each tube. Close the tubes and secure the lids with Parafilm.
- Pulverize the ashed incisors in a bead beater at 2,500 rpm for 10 s. Proceed with the processing of the milled teeth immediately.
- Weighing and hydration of ashed teeth
- Pour the entire contents of the tube, including the stainless‑steel bead, into the bottom of the diffusion dish positioned on the weighing pan of an analytical balance. Dispose of contaminated consumables containing tooth ash in the institutional chemical waste stream.
- Remove the stainless‑steel bead from the dish and record the exact weight of the tooth ash (typically 3–4 mg per mandibular incisor).
- Immediately add 3 mL ultrapure water to cover the tooth ash before removing the dish from the balance to prevent ash dispersion caused by static discharge. Continue with step 3.4.
- Milling of ashed teeth
- Calibration and quality control diffusion dishes
- In parallel with the specimen diffusion dishes, prepare two sets of calibration diffusion dishes for a 5–6 point calibration and one identical set of quality control diffusion dishes, including a blank.
NOTE: Quality control diffusion dishes: Prepared identically to calibration diffusion dishes but used periodically to verify electrode stability and ensure consistent measurement performance. - Pipette 3 mL ultrapure water into each of 11 or 13 Petri dishes and add NaF stock to span the expected F¯ mass range in the specimen samples. Continue with step 3.4. to complete the diffusion dish assembly37.
- In parallel with the specimen diffusion dishes, prepare two sets of calibration diffusion dishes for a 5–6 point calibration and one identical set of quality control diffusion dishes, including a blank.
- Completion of diffusion dish assembly
- To build a fluoride trap deposit, 50 µl of 0.05 N NaOH is added in three drops onto the inner surface of the Petri dish lid, well away from the rim of the lid.
NOTE: Fluoride trap (F¯ Trap): A component of diffusion dishes that traps F¯, specifically sodium hydroxide (NaOH). - Invert the lid without disrupting the NaOH drops and tightly seal it to the bottom of the dish with the petrolatum.
- To prepare a 3 N HMDS-saturated sulfuric acid solution, mix equal volumes of 6 N HMDS-saturated sulfuric acid and ultra-pure water. Prepare fresh immediately before use, as it cannot be stored.
- Inject 3 mL of the prepared 3 N HMDS-saturated sulfuric acid through the hole in the lid into the water at the bottom of the diffusion dish using a 10 ml syringe fitted with a 20 G needle. Take care not to splash acid onto the inner surface of the lid when inserting or withdrawing the syringe needle.
- HMDS-facilitated fluoride diffusion: Immediately seal the injection hole with a bead of petrolatum that fully covers the opening and place the diffusion dishes on a variable rocker set to slow speed. Incubate overnight at room temperature (Figure 1).
- To build a fluoride trap deposit, 50 µl of 0.05 N NaOH is added in three drops onto the inner surface of the Petri dish lid, well away from the rim of the lid.
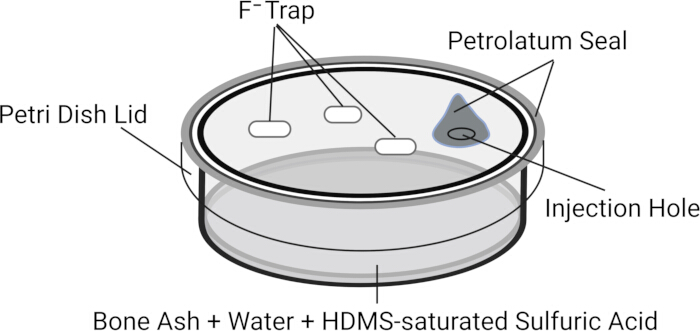
Figure 1: Schematic of a bone diffusion dish for fluoride extraction and trapping. Figure 1 illustrates the design of a bone diffusion dish assembled in a 60 × 15 mm untreated Petri dish. The lid contains a small injection hole sealed with a petrolatum bead. On the inner surface of the lid, three drops of NaOH are positioned as fluoride ion (F⁻) traps, suspended from the lid during diffusion. The lid is sealed airtight to the base of the dish using petrolatum. The bottom of the Petri dish contains ultrapure water, hexamethyldisiloxane (HMDS)–saturated sulfuric acid, and bone ash, which together form the reaction environment for fluoride release and subsequent trapping. This figure was created by the authors using Biorender, and the figure is licensed under the CC BY license. Please click here to view a larger version of this figure.
4. Fluoride measurement with an ISE
- Set up the ISE
- Fill the double-channel fluoride-selective electrode with the appropriate filling solution, connect it to the potentiometer, and secure the electrode in an electrode holder.
- Position an untreated Petri dish on a scissor jack beneath the sensing surface of the electrode, ensuring that the sensing surface is parallel to the bottom of the Petri dish, and lift the table of the scissor jack so that the Petri dish is almost touching the electrode (Figure 2).
- Preparation of samples for measurement
NOTE: Samples: Only the final products measured with an ion-selective electrode (ISE), consisting of the F¯ trap after diffusion, which was subsequently combined with acetic acid and water, are referred to as samples in the protocol.- To adjust the pH of the sample to 5, remove the diffusion dish from the rocker and carefully lift off the lid by breaking the petrolatum seal after the incubation period. Invert the lid onto a flat surface, ensuring the three F¯ trap drops remain undisturbed.
- Add 15–20 µL of 0.2 N acetic acid to one drop with a P20 pipette, then merge all three drops into a single drop without changing the pipette tip.
NOTE: Samples with high F¯ concentrations tend to have a lower initial pH and therefore require less 0.2 N acetic acid to adjust the pH to 5 compared with samples containing less F¯. Because the remaining sample volume after recording the electrode potential (step 5.3) is minimal, use whatever residual sample is available to verify the pH with indicator paper. - To adjust the volume of the sample, set a P100 pipette to 75 µL, aspirate the entire volume of the F¯ trap without introducing air, and adjust the sample to exactly 75 µL using ultra-pure water.
- Perform this step carefully to ensure accurate volume for fluoride concentration calculations. Retain the sample in the pipette tip and proceed immediately to step 4.3.
- Measurement of specimen, calibration, and quality control samples
- To measure the electrode potential of the sample, dispense it between the sensing surface of the fluoride-selective electrode and the Petri dish. Ensure that the entire sensing surface of the electrode is fully submerged in liquid, without directly contacting the Petri dish. Allow the potentiometer to stabilize and record the potential (mV) displayed by the ISE.
- Determine the calibration standard curve by measuring the first set of calibration standards sequentially, beginning with the lowest F¯ concentration and progressing to the highest.
- Plot electrode potential (mV) against the logarithm of F¯ (ng) to construct the calibration curve (Figure 3). Apply exponential regression to obtain the standard curve equation and coefficient of determination (R2). Accept calibration curves only when R2 is ≥ 0.99.
- Measure each specimen sample and record the electrode potential (mV).
- To monitor electrode stability and detect potential assay drift, measure quality‑control samples intermittently throughout each analytical run.
- Compare quality control sample values directly with the corresponding calibration samples and confirm agreement within approximately 5% to verify stable electrode performance over time.
- Periodically measure a blank diffusion dish to confirm the absence of fluoride contamination during sample handling and diffusion.
- To calculate the mass of F¯(ng) in each specimen sample, use the standard curve equation. Then divide this mass by the volume (µL) of serum, or mass (mg) of the bone or tooth ash added to the diffusion dish.
- Example calculation of F¯ concentration in bone ash (ng/mg)
- Bone ash mass added to diffusion dish: 5.1 mg ; Electrode potential of 75 µL specimen sample: –31.6 mV
- Step 1: Calculate fluoride mass using the calibration equation
- F⁻ mass (ng) = 3505.4 x e(-0.043x-31.6)
- F⁻ mass (ng) = 13,641 ng
- Step 2: Calculate fluoride concentration in bone ash
- F⁻ concentration = 13,641 ng / 5.1 mg
- F⁻ concentration = 2,675 ng / mg (ppm)
- Example calculation of F¯ concentration in bone ash (ng/mg)
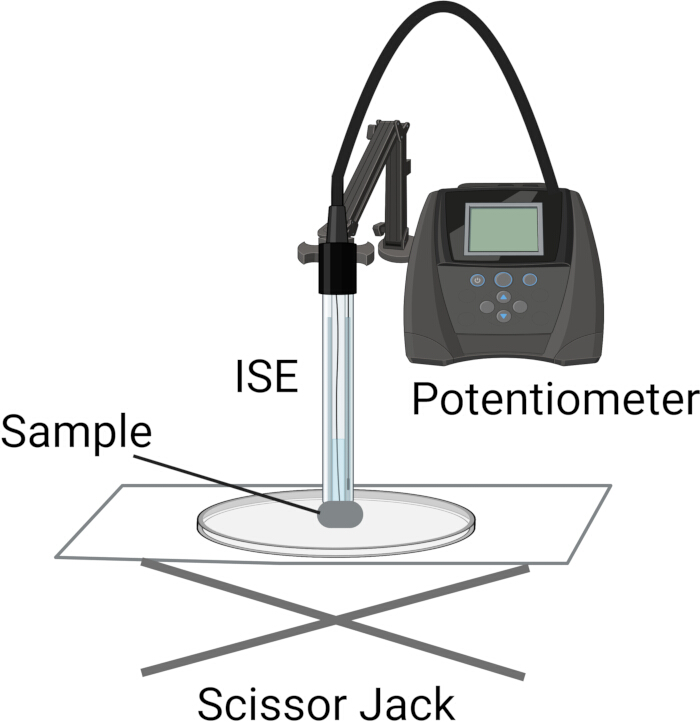
Figure 2: Schematic of the ISE measurement setup. Figure 2 illustrates the configuration used for fluoride ion measurements with a double‑channel ion‑selective electrode (ISE). A Petri dish is positioned on a scissor jack to allow precise adjustment of its height relative to the electrode. The ISE is connected to a potentiometer and oriented so that its sensing surface is parallel to the Petri dish's plane, maintaining a distance of approximately 1–2 mm. After the spacing is set, a small volume of sample (75 µL) is pipetted into the gap between the sensing surface and the Petri dish, ensuring that the sample fully covers the electrode’s sensing area during measurement. This figure was created by the authors using Biorender, and the figure is licensed under the CC BY license. Please click here to view a larger version of this figure.
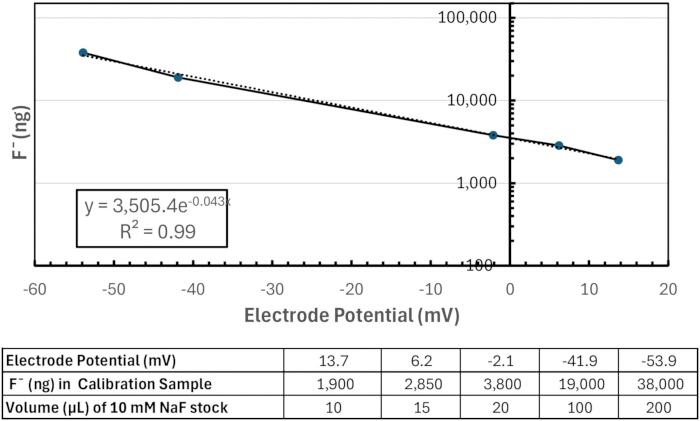
Figure 3: Calibration curve and corresponding calibration table for quantification of fluoride ion mass in tooth specimen samples. Top panel: Example calibration curve used to determine fluoride ion mass in tooth specimen samples. The x‑axis shows the electrode potential (mV, linear scale), and the y‑axis shows the corresponding fluoride ion mass (ng F⁻, logarithmic scale). Measured calibration points are plotted as a solid line, and the fitted exponential regression is shown as a dotted line. An inset box displays the standard curve equation and coefficient of determination (R2 = 0.99). Bottom panel: Table containing the numerical values used to generate the calibration curve. The first row lists the five electrode potentials (mV) recorded for the calibration samples. The second row provides the corresponding fluoride ion masses (ng F⁻) for each calibration sample. The third row lists the volumes (µL) of 10 mM NaF stock solution added to the calibration diffusion dishes; this added fluoride ion mass is equivalent to the mass trapped in each calibration sample following diffusion. Please click here to view a larger version of this figure.
Results
To demonstrate the application of this protocol for measuring fluoride (F-) concentrations in biological materials, specimen samples were generated from serum, bone, and mandibular incisor specimens collected from mice exposed to controlled fluoride treatments. Male C57BL/6J mice were assigned to two age categories, adolescent (6 weeks) and mature (18 weeks), and provided either fluoride‑free deionized water (0 ppm F⁻) or sodium‑fluoride‑supplemented drinking water (125 ppm F⁻) for a 6‑week exposure period. Each age and treatment condition included five animals. At the end of the exposure period, serum, femurs, and mandibular incisors were harvested, and specimen samples were prepared and analyzed according to the protocol. Representative fluoride concentrations measured in serum, bone, and teeth are summarized below.
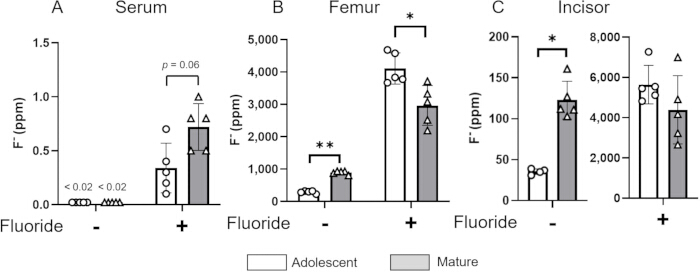
Figure 4: Fluoride concentrations measured in serum, femoral bone, and mandibular incisors. Male C57BL/6J mice were assigned to two age categories, adolescent (6 weeks, open bar) and mature (18 weeks, filled bar), and provided either fluoride‑free deionized water (0 ppm F⁻) or sodium fluoride–supplemented drinking water (125 ppm F⁻) for a 6‑week exposure period. At the end of the exposure period, fluoride levels were measured in (A) serum, (B) femoral bone, and (C) mandibular incisors from the same treatment groups. Serum values below the detection limit (<0.02 ppm) were plotted for visualization but excluded from statistical analysis. Data are expressed as means ± SD. Comparisons between adolescent and mature groups were performed using a Mann–Whitney U test with Bonferroni–Dunn correction for multiple comparisons. *p < 0.05, **p < 0.01 (N = 5/group). Please click here to view a larger version of this figure.
Fluoride concentrations in serum
In both the adolescent and mature groups treated with 0 ppm fluoride, serum fluoride concentrations were below the ion-selective electrode's detection limit (<0.02 ppm). In the 125 ppm treatment groups, serum fluoride increased to 0.3 ± 0.2 ppm in the adolescent group and to 0.7 ± 0.2 ppm in the mature group (p = 0.06). Comparison between the 125 ppm treatment adolescent and mature group was performed using a Mann–Whitney U test with Bonferroni–Dunn correction for multiple comparisons. *p < 0.05, **p < 0.01 (N = 5/group). The 0 ppm treatment groups were excluded from statistical analysis. (Figure 4A, Table 1).
Fluoride concentrations in femoral bone
In the 0‑ppm treatment groups, femoral fluoride concentrations were significantly lower in adolescents (292 ± 39 ppm) compared to mature animals (896 ± 55 ppm) (p < 0.01). In contrast, in the 125‑ppm groups, fluoride concentrations in adolescents (4,108 ± 482 ppm) were significantly higher than in mature animals (2,966 ± 612 ppm) (p = 0.04). Comparisons between adolescent and mature groups were performed using a Mann–Whitney U test with Bonferroni–Dunn correction for multiple comparisons. *p < 0.05, **p < 0.01 (N = 5/group). (Figure 4B, Table 1). Figure 5A shows the fold‑change in femoral fluoride between the 0‑ppm and 125‑ppm treatments for each age group. Adolescents exhibited a 14‑fold increase in fluoride levels at 125 ppm, whereas mature mice showed a 3‑fold increase.
Fluoride concentrations in mandibular incisors
In the 0 ppm groups, mandibular incisor fluoride concentrations were significantly lower in adolescents (35 ± 4 ppm) compared with mature animals (123 ± 23 ppm) (p = 0.03). In the 125 ppm treatment groups, incisor fluoride concentrations increased to 5641 ± 955 ppm in adolescents and 4392 ± 1694 ppm in mature animals. Comparisons between adolescent and mature groups were performed using a Mann–Whitney U test with Bonferroni–Dunn correction for multiple comparisons. *p < 0.05, **p < 0.01 (N = 5/group). (Figure 4C, Table 1). Although absolute fluoride concentrations at 125 ppm did not differ significantly between age groups, the fold-change from 0 ppm to 125 ppm was significantly greater in adolescent (161-fold increase) than mature mice (36-fold increase) (Figure 5B).
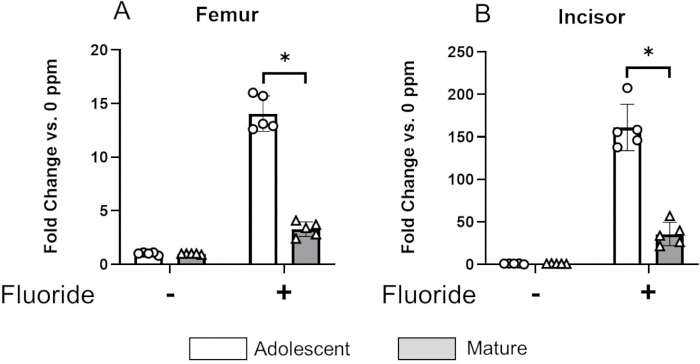
Figure 5: Adolescents exhibit a greater fold-increase in bone and incisor fluoride accumulation than mature mice. Fold-change in fluoride concentrations from 0 ppm to 125 ppm fluoride treatment in adolescent (open bar) and mature (filled bar) mice. (A) Femoral bone and (B) Mandibular incisor from the same treatment groups. Data are expressed as means ± SD. Comparisons between adolescent and mature groups were performed using an unpaired t-test. * p < 0.05, (N = 5/group). Please click here to view a larger version of this figure.
| Sample | Serum | Femur | Mandibular Incisor | |||||||||
| Age Group | Adolescent | Mature | Adolescent | Mature | Adolescent | Mature | ||||||
| Treatment Group | 0 ppm | 125 ppm | 0 ppm | 125 ppm | 0 ppm | 125 ppm | 0 ppm | 125 ppm | 0 ppm | 125 ppm | 0 ppm | 125 ppm |
| < 0.02 | 0.2 | < 0.02 | 0.8 | 324 | 4576 | 933 | 3081 | 37 | 4824 | 161 | 3229 | |
| < 0.02 | 0.1 | < 0.02 | 0.8 | 229 | 3778 | 924 | 3326 | 39 | 5451 | 127 | 2654 | |
| < 0.02 | 0.7 | < 0.02 | 1.0 | 300 | 4683 | 877 | 3713 | 31 | 5544 | 112 | 6997 | |
| < 0.02 | 0.4 | < 0.02 | 0.5 | 323 | 3832 | 807 | 2519 | 35 | 5114 | 103 | 4169 | |
| < 0.02 | 0.3 | < 0.02 | 0.5 | 283 | 3669 | 937 | 2192 | N/A | 7271 | 111 | 4909 | |
| Mean | < 0.02 | 0.3 | < 0.02 | 0.7 | 292 | 4108 | 896 | 2966 | 35 | 5641 | 123 | 4392 |
| SD | NA | 0.2 | NA | 0.2 | 39 | 482 | 55 | 612 | 3 | 955 | 23 | 1694 |
Table 1: Individual fluoride measurements in serum, femoral bone, and mandibular incisors. Table 1 lists the individual fluoride concentrations (ppm F⁻) measured in serum, femoral bone, and mandibular incisor specimens from adolescent and mature mice exposed to either 0 ppm or 125 ppm fluoride. For each tissue type, data are presented in columns corresponding to the four treatment groups: adolescent 0 ppm, adolescent 125 ppm, mature 0 ppm, and mature 125 ppm. Each column includes the five individual recorded values (N = 5), followed by the calculated mean and standard deviation (SD). In the adolescent 0 ppm serum group, all recorded values were below the ion-selective electrode's detection limit (<0.02 ppm). The table provides the raw numerical data underlying the summary values and statistical comparisons shown in Figure 4.
Discussion
Fluoride measurements were obtained using a fluoride‑selective ion‑selective electrode (ISE) incorporating a lanthanum fluoride (LaF₃) crystal membrane38,39. This membrane forms highly stable La–F bonds, which results in a strong preference for fluoride ions over other halides. According to established electrochemical literature and manufacturer specifications, the LaF₃ membrane exhibits very low selectivity coefficients for chloride, indicating that chloride ions do not produce a measurable interference under the conditions used in this protocol. Although chloride is naturally present in teeth and bone, its activity does not influence the electrode potential, and the recorded signal reflects fluoride activity specifically. The lower detection limit of 0.02 ppm corresponds to the manufacturer‑validated minimum quantifiable concentration for the Orion fluoride‑selective electrode. This limit reflects the lowest fluoride concentration at which the electrode maintains a stable Nernstian response and a linear relationship with the calibration curve. Because the detection limit is defined by the electrode’s membrane characteristics and validated by the manufacturer, no additional experimental determination was required for this protocol; however, regarding the upper detection range, the authors observed that fluoride masses exceeding approximately 38,000 ng in a 50 µL NaOH trap resulted in a non‑linear electrode response, indicating that the calibration curve is no longer reliable at very high fluoride loads. This non‑linearity is likely due to exceeding the optimal ionic strength and activity range for the electrode under the given experimental conditions, rather than reflecting an inherent upper limit of the ISE itself. For samples expected to contain fluoride masses above this threshold, it is advisable to increase the NaOH trap volume to maintain measurements within the linear dynamic range of the electrode.
This consideration should be taken into account when applying the protocol to samples with unusually high fluoride content. Because the diffusion step consumes the entire sample volume, duplicate measurements and spike‑and‑recovery experiments could not be performed on the biological samples. To ensure analytical accuracy and precision, quality control (QC) standards containing known fluoride concentrations were included in every measurement series. These QC standards were processed and measured identically to experimental samples. Across all runs, the measured fluoride concentrations of the QC standards were consistently within 5% of their expected values. For each series of 10–20 specimen samples, two independent sets of 5–6 calibration samples were prepared in parallel with the specimen samples, and a calibration curve was recorded prior to each measurement session. The calibration range was adjusted for each run to approximate the expected fluoride masses of the specimen samples, which depended on specimen type, the mass of material added to the diffusion dish, and the animal’s treatment group and age. For serum measurements, calibration standards corresponded to fluoride concentrations of approximately 0.06–1.20 ppm in the specimen. For bone and tooth measurements, calibration standards corresponded to fluoride concentrations of approximately 19–7,600 ppm in the specimen.
This protocol provides a sensitive and reproducible approach for quantifying fluoride ion mass in serum, bone, and teeth using hexamethyldisiloxane‑facilitated diffusion followed by ISE analysis. The method reliably captures fluoride released from diverse biological matrices and enables quantitative assessment of fluoride accumulation following controlled exposure. Representative results from adolescent and mature mice demonstrate clear age‑ and dose‑dependent differences in fluoride deposition across tissues, underscoring the utility of this approach for studying fluoride metabolism and toxicokinetics in vivo.
A key strength of this protocol is the use of diffusion dishes that physically separate the fluoride‑releasing reaction from the fluoride‑trapping environment. The petrolatum‑sealed design minimizes atmospheric exchange and ensures efficient capture of liberated fluoride ions by sodium hydroxide droplets on the lid. HMDS‑saturated sulfuric acid provides a strong and consistent driving force for fluoride release from mineralized tissues, including highly calcified structures such as bone and teeth. Subsequent ISE measurement, calibrated with diffusion‑matched standards, enables accurate quantification across a wide dynamic range. Another advantage of this approach is its ability to quantify fluoride in extremely small biological samples. Mineralized tissues from mice, particularly mandibular incisors, yield only 3–5 mg of ash per tooth. Conventional analytical methods often require larger sample masses or higher fluoride content to achieve reliable detection. In contrast, the diffusion‑based design concentrates all fluoride released from the entire specimen into a small, defined volume, allowing accurate quantification even in tiny samples with low absolute fluoride mass. This feature is particularly valuable for studies involving small animals, limited tissue availability, or micro‑dissected mineralized structures.
A primary limitation of this method is the detection limit of the ISE used in this study (0.02 ppm). Serum samples from fluoride‑free control animals frequently fell below this threshold, preventing quantification of extremely low fluoride concentrations. An increased mass or volume of specimen added to the diffusion dish, if available, or alternative analytical techniques may be required when measuring trace concentrations near or below the detection limit. In addition, the method requires overnight diffusion and careful handling of corrosive reagents, which may limit throughput in high‑volume studies. Although ISE provides sensitive quantification of bulk fluoride, it cannot assess spatial distribution within tissues. Complementary approaches, such as scanning electron microscopy coupled with energy-dispersive X-ray spectroscopy (SEM-EDX) or particle-induced gamma-ray emission (PIGE), can be incorporated to visualize and map fluoride distribution at the micro‑ to macro‑scale. These imaging‑based modalities allow evaluation of localized fluoride accumulation in mineralized or soft tissues, thereby complementing ISE measurements and providing a more comprehensive assessment of tissue fluoride content.
Several recurring technical factors can influence the accuracy and reliability of fluoride diffusion and measurement in this protocol, and our observations highlight how calibration preparation, diffusion‑dish sealing, pH control, electrode performance, and sample handling collectively shape data quality. Possible causes for a non‑linear calibration curve (R2 < 0.99) or tissue sample readings outside the expected range include miscalculations of the NaF stock solution volume added to the diffusion dish or pipetting errors during preparation of calibration standards. Recommended action: Prepare at least two independent sets of calibration samples for each run so that a backup set is available if one calibration curve falls outside the expected range. An incomplete seal of the diffusion dish may also cause fluoride loss during diffusion, resulting in artificially low readings. This typically occurs when insufficient petrolatum is applied to the rim of the diffusion dish lid. Recommended action: Apply a generous amount of petrolatum jelly around the rim of the diffusion dish lid and press firmly to ensure a complete seal. Pipetting errors when adding the acetic acid solution to the NaOH trap can shift the sample pH outside the optimal range of pH 5.0, leading to inaccurate fluoride recovery. Recommended action: Check the pH of each sample with pH paper and discard any sample that falls outside pH 5. Calibration samples may also fall outside the valid recording limits of the fluoride‑selective electrode. Concentrations below 0.02 ppm are below the electrode’s detection limit. Recommended action: Do not use calibration samples containing less than 0.02 ppm fluoride. Conversely, calibration samples with excessively high fluoride concentrations can alter the ionic strength of the solution and produce non‑linear electrode responses. Recommended action: At the beginning of the project, prepare calibration solutions spanning a wide fluoride concentration range to determine the linear working range of the specific electrode being used. If tissue samples exceed this linear range, reduce the tissue mass or increase the NaOH trap volume and adjust the acetic acid volume accordingly to maintain pH 5. Difficulty obtaining linear calibration curves in the 0.02–1 ppm range: A common cause is electrode aging. Older fluoride‑selective electrodes lose sensitivity at very low fluoride concentrations. Recommended action: Replace the fluoride‑selective electrode. Unstable potentiometer readings (signal drifting or jumping) typically occur when the sensing surface of the electrode is not fully immersed in the sample solution. Recommended action: Lower the electrode so that the sensing surface is completely covered by the liquid sample.
Overall, this protocol provides a robust, calibration‑based approach for quantifying fluoride in diverse biological matrices and is well-suited for studies investigating fluoride exposure, tissue deposition, and toxicological outcomes in murine models.
Disclosures
The authors declare no conflict of interest.
Acknowledgements
Research reported in this publication was supported by Japan Society for the Promotion of Science; JSPS Overseas Research Fellowships 202560528 (S.Y.), Fundação de Amparo a Pesquisa do Estado de São Paulo (FAPESP); 2024/07452-9 (J.S.T.), and the National Institute of Dental and Craniofacial Research of the National Institutes of Health; R01DE027648 (M.S.) and K02DE029531 (M.S.).
Materials
| Name | Company | Catalog Number | Comments |
|---|---|---|---|
| Acetic Acid, Glacial | Sigma-Aldrich | Supelco, GR ACS | AX0073-6 |
| Alumina Crucibles | Advalue Technology | 12 mm OD × 25 mm H, AL-6212 | AL-6212 |
| Analytical Balance | VWR | VWR 124B2, d = 0.1 mg | — |
| Bead Beater | Benchmark | BeadBug 6 | — |
| Blunt Tip Syringe Needle | Amazon | Industrial Blunt Tip Needle, 14 G × 0.5 inch | X001TT8KX1 |
| Carbon Dioxide | AirGas | — | — |
| Chemical Fume Hood | Mott Manufacturing | Model 7421040 | — |
| D(+)-Sucrose | Thermo Scientific | 99.7% for Biochemistry | 177142500 |
| Electrode Filling Solution | Thermo Scientific | Orion IonPlus Filling Solution | 900061 |
| Ethyl Alcohol Solution | Koptec | 140 Proof | 2401 |
| Freezer, −80 °C | Thermo Scientific | Revco RDE Series | — |
| Heat-Resistant Gloves | Fisher Scientific | Bel-Art Clavies Biohazard Autoclave Gloves | H13201 |
| Hexamethyldisiloxane (HMDS) | Fisher Scientific | TCI H0091, >98% | H0091 |
| Hydrogen Peroxide | VWR | J.T. Baker, 30% | 2204-01 |
| Ion-Selective Electrode | Thermo Scientific | Orion Fluoride ISE, Double Channel | 9609BNWP |
| Magnetic Mixer | VWR | 360 Stirrer | — |
| Micro Spatula | Amazon | Wax Carving Spatula #7A, Stainless Steel | — |
| Microcentrifuge | Eppendorf | 5427R | 5404000131 |
| Muffle Furnace | Thermo Scientific | Thermolyne Small Benchtop Muffle Furnace, 1.3 L, FB1315M | FB1315M |
| Oven | Boekel Scientific | Boekel RapidFISH | 240200 |
| Paraformaldehyde Solution in PBS | Thermo Scientific | 4% Paraformaldehyde in PBS | J19943-K2 |
| Petri Dish | VWR | 60 × 15 mm, Untreated | 25384-092 |
| Petrolatum | Thermo Scientific | Petrolatum, White, Pure | 417090010 |
| pH Indicator Paper | Fisher Scientific | pH-Fix 4.5–10.0 | 92120.3 |
| Porcelain Dish | Fisher Scientific | Fisherbrand Crucible, 5 mL, 20 mm Height, High Form | FB-965-B |
| Potentiometer | Thermo Scientific | Orion Dual Star pH/ISE Meter | 2115102 |
| Ring Stand with Clamp | VWR | Ring Clamp, 15 cm | 470104-526 |
| Rodent Diet | Bio-Serv | F1515, AIN-76A, ½ Pellets | F1515 |
| Scissor Jack | Amazon | Laboratory Scissor Jack | — |
| Separatory Funnel | Fisher Scientific | Eisco, Borosilicate Glass, 2 L | S89285 |
| Sodium Chloride | Fisher Scientific | Certified ACS, Crystalline | S271-1 |
| Sodium Fluoride | Fisher Scientific | Certified ACS, Powder | S299-100 |
| Sodium Hydroxide | Fisher Scientific | White Pellets | BP359-500 |
| Stainless Steel Beads | Fisher Scientific | Scientific Industries, 5 mm, 100 pcs | SI-CS05 |
| Sulfuric Acid | Fisher Scientific | ACS Grade | A300-500 |
| TISAB II | Thermo Scientific | Orion IonPlus Application Solution | 940909 |
| Vacuum Desiccator | Fisher Scientific | Bel-Art Space Saver Vacuum Desiccator, 10-inch | F42010-0000 |
| Vacuum Filter | Fisher Scientific | Flow Bottle-Top Filter, PES, 90 mm, 0.2 µm | 597-4520 |
| Variable Rocker | MidSci | LabDoctor / Benchmark Scientific | — |
References
- Podgorski J, Berg M. Global analysis and prediction of fluoride in groundwater. Nat Commun. 2022;13(1):4232. doi:10.1038/s41467-022-31940-x
- Iheozor-Ejiofor Z, Worthington HV, Walsh T, O'Malley L, Clarkson JE, Macey R, et al. Water fluoridation for the prevention of dental caries. Cochrane Database Syst Rev. 2015;2015(6):Cd010856. doi:10.1002/14651858.CD010856.pub2
- Manchanda S, Sardana D, Liu P, Lee GH, Li KY, Lo EC, et al. Topical fluoride to prevent early childhood caries: Systematic review with network meta-analysis. J Dent. 2022;116:103885. doi:10.1016/j.jdent.2021.103885
- Chan AKY, Tamrakar M, Jiang CM, Tsang YC, Leung KCM, Chu CH. Clinical evidence for professionally applied fluoride therapy to prevent and arrest dental caries in older adults: A systematic review. J Dent. 2022;125:104273. doi:10.1016/j.jdent.2022.104273
- Zamperini CA, Bedran-Russo AK. Immediate and Sustained Root Caries Prevention of Fluoride Varnish Combined with Toothpastes. Caries Res. 2023;57(5-6):592-601. doi:10.1159/000533279
- Melough MM, Sathyanarayana S, Zohoori FV, Gustafsson HC, Sullivan EL, Chi DL, et al. Impact of Fluoride on Associations between Free Sugars Intake and Dental Caries in US Children. JDR Clin Trans Res. 2023;8(3):215-23. doi:10.1177/23800844221093038
- Suzuki M, Everett ET, Whitford GM, Bartlett JD. 4-phenylbutyrate Mitigates Fluoride-Induced Cytotoxicity in ALC Cells. Front Physiol. 2017;8:302. doi:10.3389/fphys.2017.00302
- Suzuki M, Shin M, Simmer JP, Bartlett JD. Fluoride affects enamel protein content via TGF-beta1-mediated KLK4 inhibition. J Dent Res. 2014;93(10):1022-7. doi:10.1177/0022034514545629
- Everett ET, McHenry MA, Reynolds N, Eggertsson H, Sullivan J, Kantmann C, et al. Dental fluorosis: variability among different inbred mouse strains. J Dent Res. 2002;81(11):794-8.
- Kong H, He Z, Li H, Xing D, Lin J. The association between fluoride and bone mineral density in US children and adolescents: a pilot study. Nutrients. 2024. doi:10.3390/nu16172948
- Mazzoli R, Filippini T, Iamandii I, De Pasquale L, Veneri F, Birnbaum LS, et al. The association of fluoride exposure with bone density and fracture risk: a dose-response meta-analysis. Environ Health. 2025;24(1):73.
- Suzuki M, Bandoski C, Bartlett JD. Fluoride induces oxidative damage and SIRT1/autophagy through ROS-mediated JNK signaling. Free Radic Biol Med. 2015;89:369-78.
- Kubota K, Lee DH, Tsuchiya M, Young CS, Everett ET, Martinez-Mier EA, et al. Fluoride induces endoplasmic reticulum stress in ameloblasts responsible for dental enamel formation. J Biol Chem. 2005;280(24):23194-202. doi:10.1074/jbc.M503288200
- Yamashita S, Okamoto M, Mendonca M. Fluoride alters gene expression via histone H3K27 acetylation in ameloblast-like LS8 cells. Int J Mol Sci. 2024. doi:10.3390/ijms25179600
- Deng H, Fujiwara N, Cui H, Whitford GM, Bartlett JD, Suzuki M. Histone acetyltransferase promotes fluoride toxicity in LS8 cells. Chemosphere. 2020;247:125825.
- Deng H, Ikeda A, Cui H, Bartlett JD, Suzuki M. MDM2-Mediated p21 Proteasomal Degradation Promotes Fluoride Toxicity in Ameloblasts. Cells. 2019;8(5). doi:10.3390/cells8050436
- Fujiwara N, Whitford GM, Bartlett JD, Suzuki M. Curcumin suppresses cell growth and attenuates fluoride-mediated Caspase-3 activation in ameloblast-like LS8 cells. Environ Pollut. 2021;273:116495. doi:10.1016/j.envpol.2021.116495
- Suzuki M, Ikeda A, Bartlett JD. Sirt1 overexpression suppresses fluoride-induced p53 acetylation to alleviate fluoride toxicity in ameloblasts responsible for enamel formation. Arch Toxicol. 2018;92(3):1283-93. doi:10.1007/s00204-017-2135-2
- Regelson S, Dehghan M, Tantbirojn D, Almoazen H. Evaluation of fluoride levels in commercially available tea in the United States. 2020/12/23 ed2021 Jan-Feb. 17-20 p.
- Cantoral A, Luna-Villa LC, Mantilla-Rodriguez AA, Mercado A, Lippert F, Liu Y, et al. Fluoride Content in Foods and Beverages From Mexico City Markets and Supermarkets. Food Nutr Bull. 2019;40(4):514-31. doi:10.1177/0379572119858486
- Institute of Medicine SCotSEoDRI. Dietary Reference Intakes for Calcium, Phosphorus, Magnesium, Vitamin D, and Fluoride. Washington, DC: National Academy Press; 1997.
- Otal E.H. KML, Kimura M. Fluoride Detection and Quantification, an Overview from Traditional to Innovative Material-Based Methods. In: Wambu E.W. LGJ, Kiplagat A., editor. Fluoride. London: IntechOpen; 2022.
- Whitford GM. Absorption and Plasma Concentrations of Fluoride, 1996.
- Taves DR. Determination of submicromolar concentrations of fluoride in biological samples. Talanta. 1968;15(10):1015-23. doi:10.1016/0039-9140(68)80109-2
- Buzalaf MA, Caroselli EE, de Carvalho JG, de Oliveira RC, da Silva Cardoso VE, Whitford GM. Bone surface and whole bone as biomarkers for acute fluoride exposure. J Anal Toxicol. 2005;29(8):810-3.
- Zohoori FV, Maguire A, Martinez-Mier EA, Buzalaf MAR, Sanderson R, Eckert GJ. A Comparison of Simple Analytical Methods for Determination of Fluoride in Microlitre-Volume Plasma Samples. Caries Res. 2019;53(3):275-83. doi:10.1159/000492339
- Martínez-Mier EA, Cury JA, Heilman JR, Katz BP, Levy SM, Li Y, et al. Development of gold standard ion-selective electrode-based methods for fluoride analysis. Caries Res. 2011;45(1):3-12. doi:10.1159/000321657
- Boivin G, Chapuy MC, Baud CA, Meunier PJ. Fluoride content in human iliac bone: results in controls, patients with fluorosis, and osteoporotic patients treated with fluoride. J Bone Miner Res. 1988;3(5):497-502.
- Yamashita S, Okamoto M, Fujiwara N, Achong-Bowe R, Brueckner S, Mendonca M, et al. Developmental vulnerability to fluoride toxicity: enamel and clearance differences in adolescent versus mature mice. Arch Toxicol. 2025.
- Chiba K, Hisamatsu, S., Takizawa, Y, Katsura, K. Determination of fluoride in biological materials by ion chromatography. Journal of Chromatography. 1982;245:8.
- Ikenishi K, Chiba, K., Hisamatsu, S, Takizawa, Y. Determination of fluoride in biological samples by ion chromatography. Journal of Chromatography. 1988;437:8.
- Venkateswarlu P, Reddy, D.S., Reddy, T.S. Spectrophotometric determination of fluoride using the SPADNS method. Analyst 1971;96:5.
- Kakabadse G. KN, Davies C.W. The Spectrophotometric Determination of Fluoride with SPDNS-Zirkonium Lake. Analyst. 1971;96:8.
- Mendham J, Denney RC, Barnes JD, Thomas MJK. Vogel's Textbook of Quantitative Chemical Analysis. 6th ed. Harlow, England: Prentice Hall; 2000.
- Kučera J, Štefánik, M. & Veselka, P. Fluorine determination in biological and environmental samples with INAA using fast neutrons from a p(19 MeV)+Be neutron generator. Journal of Radioanalytical and Nuclear Chemistry 2019;322:7.
- Okamoto M, Yamashita S, Memida T, Mendonca M, Brueckner S, Nakamura S, et al. Microhardness Measurements on Tooth and Alveolar Bone in Rodent Oral Disease Models. J Vis Exp. 2024(206). doi:10.3791/66583
- Okamoto M, Yamashita S, Mendonca M, Brueckner S, Achong-Bowe R, Thompson J, et al. Ultrastructural evaluation of adverse effects on dentine formation from systemic fluoride application in an experimental mouse model. Int Endod J. 2025;58(1):128-40.
- Frant MS, Ross JW, Jr. Electrode for sensing fluoride ion activity in solution. Science. 1966;154(3756):1553-5.
- Umezawa Y, Umezawa, K and Sato, H. Selectivity coefficients for ion-selective electrodes: recommended methods for reporting KRB values, 1995.
Reprints and Permissions
