This protocol provides a standardized within-chamber cutting approach to resolve the onset, peak timing, and kinetics of wound-induced volatile emissions, together with simultaneous gas-exchange measurements.
Method Article
A Within-Chamber Cutting Method for Real-Time Quantification of Leaf Wounding Volatiles and Gas Exchange
80 views
⸱
September 11th, 2026
In This Article
Summary
Abstract
Volatile organic compounds (VOCs) released by plant leaves play key roles in stress signaling, plant–atmosphere interactions, and plant defense. Among these, wound-induced VOCs (wVOCs) are emitted within seconds of mechanical damage, herbivory, or environmental disturbance. Their emission dynamics depend strongly on the timing, severity, and method of tissue disruption. Yet, accurate quantification remains challenging due to mechanical artifacts, variable exposure conditions, and delays between injury and measurement. This study presents a standardized within-chamber leaf excision protocol for real-time monitoring of wVOCs and gas exchange. A surgical-grade cutter was integrated into a portable gas-exchange chamber to enable clean, controlled cuts within a sealed chamber under stable light, humidity, CO2, and temperature conditions. A proton-transfer-reaction time-of-flight mass spectrometer (PTR-TOF-MS) continuously measured volatile emissions at the chamber outlet, minimizing delay and signal distortion. This setup resolves emission onset, peak timing, maximum rise rate, and total release with high temporal fidelity. Application of the method to Quercus rubra, Acer platanoides, and Gossypium hirsutum demonstrated its ability to resolve distinct wound-induced emission patterns across contrasting leaf types. By eliminating delays associated with conventional sampling, this method resolves the full kinetic trajectory of wound-induced emissions and overcomes major limitations of previous approaches. It provides a robust framework for studying rapid stress responses in plant physiology, ecological biochemistry, and plant-atmosphere interactions.
Introduction
Plants respond to injury by releasing a rapid chemical signal, but capturing that signal accurately remains technically challenging. Within seconds after herbivory, wind damage, or mechanical disturbance, plants release a transient burst of volatile organic compounds (VOCs) that activate internal defenses and prime neighboring plants1,2,3,4. These wound-induced VOCs (wVOCs) include green leaf volatiles (GLVs), methanol, short-chain alcohols and aldehydes, terpenoids, and oxylipin derivatives. They arise either from de novo synthesis in mesophyll cells or from the rupture of storage structures such as resin ducts and trichomes. As immediate stress signals, wVOCs coordinate physiological defenses, mediate plant–plant communication, and interact with atmospheric chemistry1,5,6,7.
Because natural herbivory combines mechanical damage with salivary and microbial elicitors, experimental studies use simulated wounding to isolate responses to physical injury alone8. However, the transient nature of wVOCs makes them inherently difficult to capture. Conventional methods, such as static headspace sampling coupled with gas chromatography-mass spectrometry (GC-MS), often miss the initial emission burst and distort its kinetic profile9,10. Equilibration delays, elevated incubation temperatures, and extended sampling lines increase residence time and distort the recorded signal, particularly for reactive compounds such as sesquiterpenes9,11,12. Together, these artifacts reduce signal magnitude and obscure the temporal dynamics of wound-induced volatile emissions, thereby complicating the interpretation of plant stress responses.
Many studies also interrupt the measurement to wound leaves outside the chamber. This interruption destabilizes gas flow, alters wound timing, and reduces control over incision precision13,14,15. As a result, the first minutes after injury are often lost or distorted13, precisely when emission rates peak and characteristic kinetic patterns emerge3,6,16,17. Some approaches moved leaf excision inside large-volume chambers using Teflon blades or mechanical punches12,18,19. However, these setups often led to sealing instability, inconsistent cut lengths, and uneven incisions due to cutter shifting or differences in leaf toughness. The large chamber volume further delayed air turnover and broadened the volatile signal16. Together, these experimental limitations prevent accurate characterization of the temporal dynamics of wound-induced emissions under stable physiological conditions.
To overcome these challenges, this study presents a real-time within-chamber wounding protocol that integrates a surgical-grade cutter into a gas exchange system coupled to proton-transfer-reaction time-of-flight mass spectrometry (PTR-TOF-MS). The protocol enables synchronous leaf wounding and volatile detection under controlled environmental conditions while simultaneously measuring volatile fluxes and gas exchange at high temporal resolution. By performing leaf excision within the measurement chamber, the protocol minimizes sampling delays associated with conventional approaches, preserves the temporal dynamics of rapidly emitted wound-induced volatiles, and illustrates a standardized cutting procedure across leaves with different mechanical properties. This temporal resolution enables direct characterization of the onset, peak timing, and species-specific kinetics of wound-induced volatile emissions.
The protocol was evaluated using three species with contrasting anatomical and physiological characteristics (Quercus rubra, Acer platanoides, and Gossypium hirsutum) to demonstrate its applicability across diverse leaf types. Applying identical measurement conditions across all species demonstrates that the protocol can resolve wound-induced VOC dynamics over a broad range of emission patterns while minimizing experimental variability. The approach is broadly applicable to studies requiring high-temporal-resolution measurements of wound-induced VOCs under controlled environmental conditions. Together, these features provide a standardized framework for investigating rapid plant stress responses and facilitate the application of the protocol across species and experimental systems.
Protocol
All plants were grown under controlled-environment conditions in growth chambers. The reagents and the equipment used are listed in the Table of Materials.
1. Construction and installation of the within-chamber leaf cutter
- Fabricate a rotating leaf cutter designed to fit the internal dimensions (4 cm × 2 cm) of the standard measuring head.
- Attach a razor blade to a stainless-steel rod (1 mm diameter) using silver solder to ensure mechanical stability.
CAUTION: Razor blades are extremely sharp. Wear cut-resistant gloves during handling. After use, dispose of razor blades according to institutional laboratory safety procedures for sharp objects. Perform silver soldering under appropriate ventilation and wear protective eyewear. - Insert the blade-holding rod into a stainless-steel syringe needle (outer diameter 1.6 mm) to allow free axial rotation.
- Seal both ends of the needle using a low-emission polytetrafluoroethylene (PTFE) stopper to maintain airtight conditions while preserving rotation.
- Mount a manual turning knob at the proximal end of the rod to enable controlled rotation of the internal cutter.
- Attach two flexible supports made from spring brass sheet (0.2 mm thickness) to the outer surface of the needle to secure the cutter to the lower chamber half.
- Create a triangular incision in the lower chamber gasket to allow blade insertion without contact with the leaf surface.
- Seal the insertion point using a low-emission sealing putty to prevent gas leakage.
NOTE: Before proceeding, verify that the cutter installation has not compromised chamber sealing. Confirm that the chamber closes completely, the thermocouple remains in contact with the leaf surface, and that the gas-exchange system indicates stable airflow with no evidence of leakage. Proceed only after stable chamber conditions have been confirmed. Select blade length to produce a cut of approximately 10 mm. The integrated cutting mechanism and its position within the leaf chamber are shown in Figure 1B.
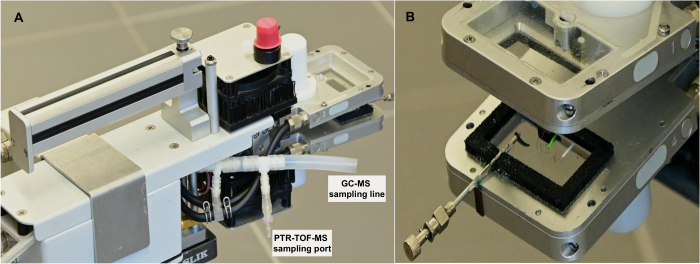
Figure 1: Modified gas-exchange system with an integrated within-chamber leaf cutter and volatile sampling lines. (A) Overview of the modified gas-exchange system, showing the PTR-TOF-MS sampling port and the GC–MS sampling line positioned near the chamber outlet for volatile collection. (B) Close-up view of the opened chamber showing the integrated cutting mechanism and the region in which the leaf is positioned during wounding. The cutter is hermetically integrated into the chamber, allowing leaf wounding without opening the enclosure during measurement. This configuration enables real-time monitoring of volatile emissions and gas exchange under controlled environmental conditions. Please click here to view a larger version of this figure.
2. Configuration of volatile sampling pathways
- Install a Teflon T-piece (1/16″ or 1/8″ ID) adjacent to the chamber outlet (Figure 1A) to minimize tubing length between the chamber and the volatile analyzer.
- Connect the outlet to the VOC collection system using inert tubing (e.g., FEP or PTFE; 1.6 mm inner diameter). Install the T-piece immediately adjacent to the chamber outlet to keep the tubing between the chamber and the volatile analyzer as short as practicable, thereby minimizing internal volume, residence time, and adsorption losses.
- Maintain chamber airflow at 750 µmol s-1.
NOTE: Short inert tubing reduces adsorption and residence time for reactive compounds.
3. Preparation of plant material
- Grow Quercus rubra, Acer platanoides, and Gossypium hirsutum under a controlled-environment chamber at 25 °C day / 20 °C night, 60% relative humidity, 1000 µmol m-2 s-1 light intensity, and 16 h/ 8 h photoperiod for 4 months.
- Maintain plants under ambient atmospheric CO2 concentration (~430 ppm) throughout the experiment.
- Water all plants every two days until the soil reaches field capacity.
- Select fully expanded, non-senescent leaves for experiments of comparable developmental stage.
4. Leaf wounding and VOC collection experiments
- Enclose the leaf and set environmental conditions
- Enclose a fully expanded attached leaf in the cuvette equipped with the internal cutter.
- Set block temperature to 25 °C, relative air humidity to 60%, actinic light intensity to 1000 µmol m-2 s-1 (90% red, 10% blue), and airflow to 750 µmol s-1.
- Allow the leaf to acclimate under the selected environmental conditions until steady-state values of net CO2 assimilation, stomatal conductance, and baseline VOC signals are reached, typically within 20–30 min after leaf enclosure.
- Perform gas exchange, fluorescence, and VOC monitoring
- Begin simultaneous measurements of gas exchange and VOCs using 1 Hz resolution.
- After completing gas exchange measurements, record the steady-state fluorescence yield (Fs) and then apply a saturating pulse (8000 µmol m-2 s-1, 0.6 s) via the chamber fluorimeter (3055-FL) to determine maximum fluorescence yield (Fm′) in light-adapted leaves.
- Turn off the actinic light and dark-adapt the leaf for 20 min.
- Record leaf dark respiration.
- Measure the initial fluorescence (F₀) using weak modulated measuring light (0.03 µmol m-2 s-1), followed by a saturating pulse to obtain maximum fluorescence in dark-adapted leaves (Fm).
- Turn the actinic light back on.
- Continue VOC and gas-exchange measurements under the same environmental conditions until the pre-wounding baseline is stable.
NOTE: Before wounding, confirm that the selected environmental conditions remain stable and that net CO₂ assimilation, transpiration, and baseline VOC signals have reached steady-state values. Proceed only after these conditions have been maintained under the selected measurement settings.
- Leaf wounding and VOC collection
- Insert the first VOC cartridge into the outlet line and connect it to a portable constant-flow air sampling pump. Draw chamber air through the cartridge at a constant flow rate of 200 mL min-1. Use a multi-bed stainless-steel adsorbent cartridge (10.5 cm length, 3 mm inner diameter) suitable for C3–C17 volatile capture, packed with Carbotrap C 20/40 mesh (0.2 g), Carbopack B 40/60 mesh (0.1 g), and Carbotrap X 20/40 mesh (0.1 g), arranged from weakest to strongest adsorption strength in the sampling direction.
NOTE: Before sampling, condition cartridges by passing high-purity helium through the cartridge at 200 mL min-1 for 3 h at 250 °C. Cartridge sampling enables subsequent offline GC-MS analysis for compound identification when required by the experimental objectives. Although cartridge collection forms part of the workflow described here, the representative results presented in this study are derived from continuous PTR-TOF-MS measurements. Match adsorbent choice to the volatility range and polarity of the target VOCs, as well as to the sampling conditions. - Collect pre-wounding VOCs for 15 min at 200 mL min-1.
- Replace cartridge and collect VOCs for 2 min.
- Rotate the internal cutter 360° to excise the leaf without opening the chamber and return the blade to its initial position.
NOTE: Position the leaf within the chamber so that the incision is made in the enclosed lamina while maintaining complete chamber sealing. Whenever permitted by leaf size and morphology, avoid cutting through the primary vein and keep the incision position as consistent as possible among samples. Because major vein damage can substantially increase wound-induced volatile emissions, consistent wound placement improves experimental reproducibility5.
CAUTION: Ensure the chamber is fully sealed before cutting. - Continue VOC collection with the same cartridge for 13 min.
- Insert a third cartridge and collect VOCs for 15 min.
- Operate PTR-TOF-MS continuously during all periods for real-time detection.
NOTE: Before and after each plant measurement, collect an empty-chamber background sample under the same environmental conditions. Use these background measurements for baseline correction of VOC emission data during data analysis.
- Insert the first VOC cartridge into the outlet line and connect it to a portable constant-flow air sampling pump. Draw chamber air through the cartridge at a constant flow rate of 200 mL min-1. Use a multi-bed stainless-steel adsorbent cartridge (10.5 cm length, 3 mm inner diameter) suitable for C3–C17 volatile capture, packed with Carbotrap C 20/40 mesh (0.2 g), Carbopack B 40/60 mesh (0.1 g), and Carbotrap X 20/40 mesh (0.1 g), arranged from weakest to strongest adsorption strength in the sampling direction.
5. Volatile detection and instrument operation
- Set PTR-TOF-MS inlet and drift tube temperatures to 80 °C, inlet flow of 100 mL min-1, water vapor flow 4.0 mL min-1, ion current 4.0 mA, drift chamber pressure to 2.1 mbar, drift tube field density ratio 115 Td, and TOF-MS module pressure of 1.2 × 10⁻⁷ mbar.
- Record volatile signals at a temporal resolution of 1 Hz with a 400 ps sample interval.
- Calibrate the PTR-TOF-MS before each experiment using a certified gas standard mixture containing representative VOCs from the major plant volatile classes. Process calibration data and calculate VOC concentrations using PTR-MS Viewer software following the procedures described13,16.
6. Offline GC-MS analysis of cartridge samples
NOTE: The following procedure describes the offline analysis of cartridge samples collected during the workflow above. GC-MS analysis provides complementary compound identification, whereas the representative results presented in this study are based on continuous PTR-TOF-MS measurements.
- Thermally desorb cartridges using an automated thermal desorption unit coupled to a GC-MS system following the procedure described by Kännaste et al.20.
- Identify compounds by comparison with authentic standards and the NIST mass spectral library. Perform mass spectrometric detection using electron impact ionization (70 eV) and confirm compound identities by matching both retention times and mass spectra with authentic standards when available.
NOTE: Cartridge sampling follows the modified protocol from Kännaste et al.20 for C3–C17 volatile capture.
7. Data analysis
- Subtract the empty-chamber background from all emission traces before analysis. Define the pre-wounding baseline for each monitored mass as the mean signal during a fixed interval immediately before cutting.
- Use the cutting time as the common reference point for all monitored masses. Determine emission onset as the first detectable increase in the baseline-corrected VOC signal following leaf cutting.
NOTE: Emission onset was defined as the first consecutive increase above the pre-wounding baseline that continued into the rising phase of the emission burst, thereby excluding isolated fluctuations attributable to instrumental noise. - Calculate the time to peak as the interval between the time of cutting and the maximum emission signal. Calculate the maximum slope of the emission burst from the first derivative of the baseline-corrected signal using the mean of the forward and backward slopes between adjacent data points13. Define peak magnitude as the maximum observed emission value during the burst.
Results
To evaluate whether volatile sampling position influences signal detection, we compared two configurations using controlled gas injections into the leaf chamber. In one setup, volatiles were sampled directly at the chamber outlet of the modified gas-exchange chamber (Figure 1). In contrast, in the other, air passed through the gas-exchange analyzer tubing before reaching the detector. Recording both signals simultaneously enabled direct comparison of their temporal dynamics.
Injection of pure volatile compounds produced rapid detector responses with distinct emission peaks (Figure 2). When sampled directly at the chamber outlet, signals rose immediately after injection, reached sharp maxima, and decayed rapidly. When sampled after the analyzer tubing, the same compounds produced delayed and attenuated responses.
For isoprene (m/z 69), the temporal delay between sampling positions was minimal, and peak magnitudes remained similar (Figure 2A). For Z-3-hexen-1-ol (m/z 83), passage through the tubing reduced peak height and broadened the decay curve relative to direct sampling (Figure 2B). This effect was strongest for α-pinene (m/z 137), where tubing passage strongly attenuated the peak compared with the signal measured directly at the chamber outlet (Figure 2C).
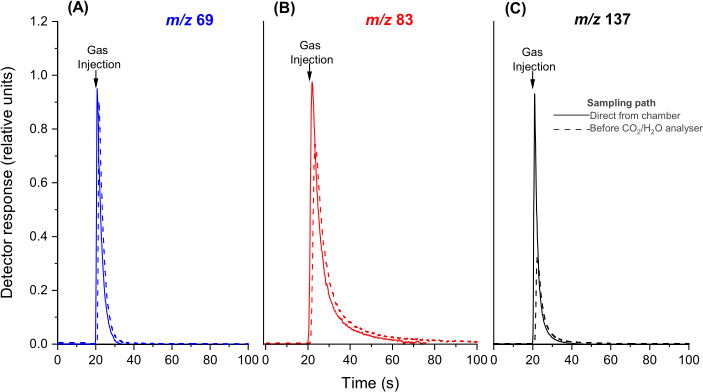
Figure 2: Effect of sampling position on the temporal response of volatile detection. Responses to injection of pure (A) isoprene (m/z 69), (B) Z-3-hexen-1-ol, detected mainly as the fragment ion m/z 83, and (C) α-pinene (m/z 137) were recorded at two sampling positions. Solid lines represent sampling immediately after the chamber outlet, whereas dashed lines represent the standard sampling position before the CO₂/H₂O analyzers following passage through the gas-exchange system tubing. Arrows indicate gas injection. Responses were normalized to the maximum signal detected by the PTR-QMS sampling next to the chamber. For visualization of differences in response shape, the standard-sampling time courses were shifted by 0.9 s relative to direct sampling. This figure was modified from Rasulov et al.16. Please click here to view a larger version of this figure.
Leaf cutting triggered rapid, compound-specific volatile emissions in all species (Quercus rubra, Acer platanoides, and Gossypium hirsutum), and the system detected these emissions within seconds. Because the within-chamber setup directly resolved both emission onset and peak timing, it enabled quantification of compound-specific kinetics without interrupting the measurement.
Across all species, the dominant wound-induced PTR-TOF-MS signal was detected at m/z 99, tentatively assigned to LOX-derived hexenal-type compounds based on previous PTR-TOF-MS studies (Figure 3, Figure 4, and Figure 5). Peak emissions ranged from 24–300 nmol m-2 s-1 across the three species, illustrating the ability of the protocol to resolve wound-induced VOC dynamics over a broad range of emission strengths (Figure 3, Figure 4, and Figure 5). In all cases, m/z 99 increased within seconds after cutting, peaked within ~39–57 s, and showed the steepest rise among the monitored masses (Table 1), identifying it as the dominant acute component of the wound burst.
Mass 69 remained negligible before cutting in A. platanoides (Figure 4B) and G. hirsutum (Figure 5B) and increased only slightly after wounding. In contrast, Q. rubra exhibited substantial baseline emissions prior to cutting, followed by a modest transient increase and subsequent stabilization, consistent with constitutive isoprene release superimposed on the wound response (Figure 3B).
Other monitored masses revealed a clear temporal sequence after cutting. Across species, m/z 43, 57, 69, and 99 defined the early phase of the burst, whereas m/z 45 and 83 peaked later (Figure 3, Figure 4, and Figure 5; Table 1). This pattern was most pronounced in A. platanoides, where m/z 45 began rising immediately after cutting but peaked only after ~155 s, indicating a slower and more prolonged response than the early LOX-related fragments (Figure 4A; Table 1). Similarly, m/z 83 peaked later than the early fragments in all species and was especially delayed in G. hirsutum, reaching its maximum only after ~223 s (Figure 5A; Table 1).
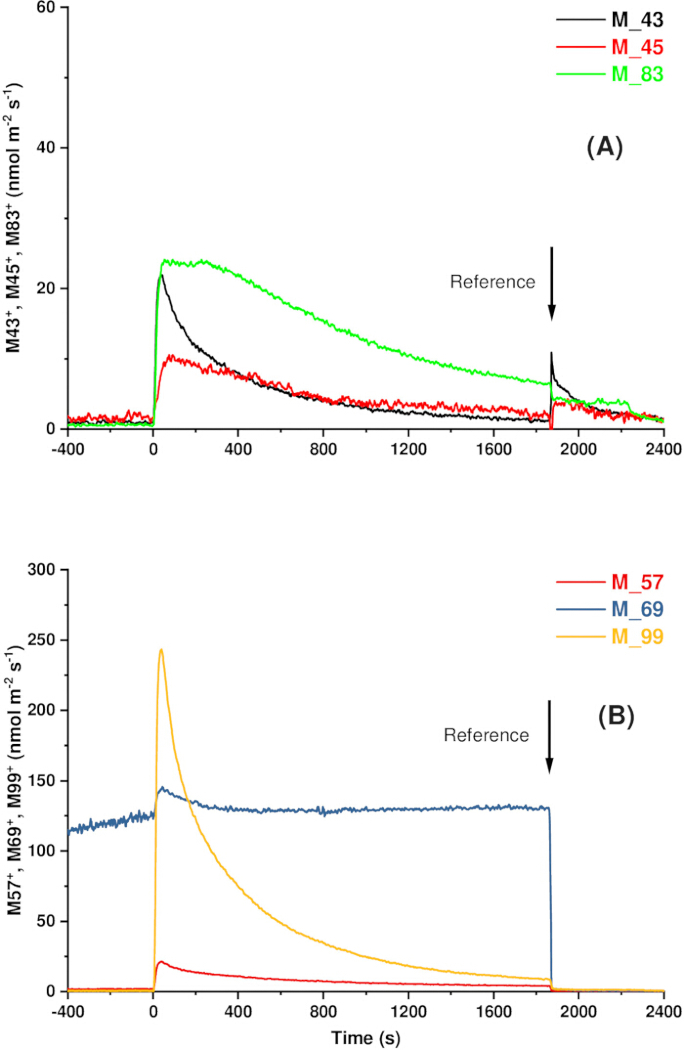
Figure 3: Time-resolved wound-induced volatile emissions in a representative leaf of Quercus rubra. (A) m/z 43, 45, and 83. (B) m/z 57, 69, and 99. At t = 0, the leaf was cut using a within-chamber leaf cutter shown in Figure 1, producing a 10 mm incision. Volatile emissions were continuously monitored with a proton-transfer reaction time-of-flight mass spectrometer (PTR-TOF-MS), and gas exchange rates were measured with a Walz GFS-3000 system. Signals are shown as representative baseline-corrected emission profiles illustrating the temporal resolution achievable with the protocol. See Table 1 for representative kinetic descriptors extracted from these emission profiles. Please click here to view a larger version of this figure.
Despite these shared features, the representative measurements illustrate that emission trajectories can differ among species. In Q. rubra, m/z 43 and 57 rose rapidly but diverged during the decay phase, with m/z 57 declining more slowly than m/z 43 (Figure 3A,B). In A. platanoides, this pattern reversed, with m/z 43 showing the slower late-phase decline (Figure 4A). In G. hirsutum, all signals were lower in magnitude, and emission profiles combined rapid initial peaks with more gradual decay. Notably, m/z 45 displayed a small secondary increase during the decay phase (Figure 5A).
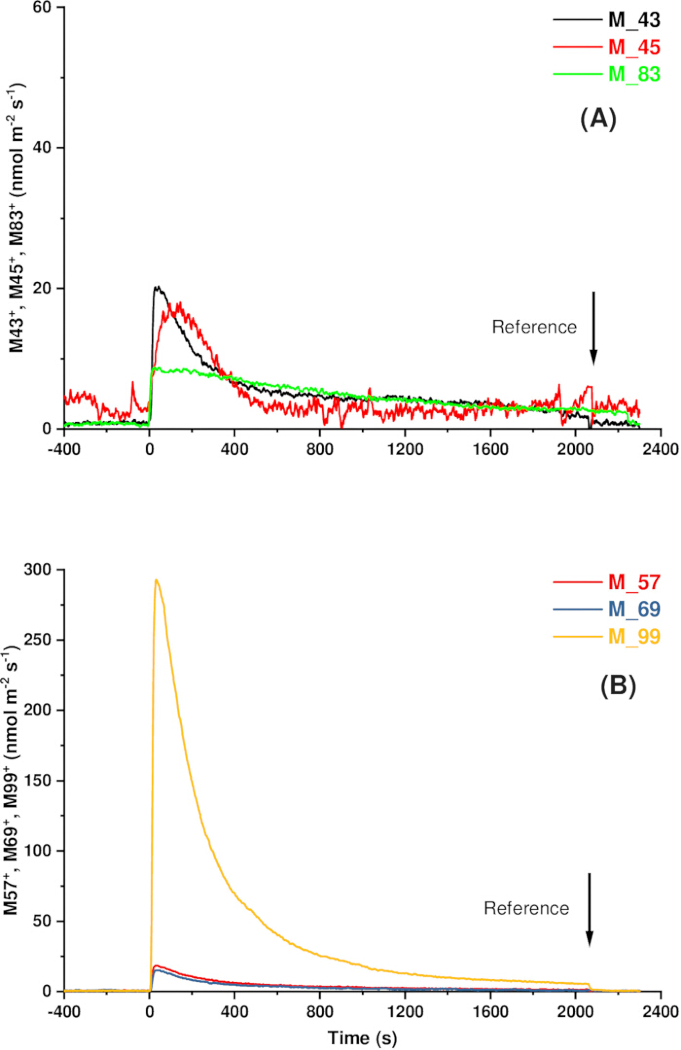
Figure 4: Time-resolved wound-induced volatile emissions in a representative leaf of Acer platanoides. (A) m/z 43, 45, and 83. (B) m/z 57, 69, and 99. The leaf was cut at t = 0 using a within-chamber cutter (Figure 1; 10 mm incision). Volatile emissions were continuously measured with a proton-transfer reaction time-of-flight mass spectrometer (PTR-TOF-MS), and gas exchange was measured with a Walz GFS-3000 system. Signals are shown as representative baseline-corrected emission profiles illustrating the temporal resolution achievable with the protocol. See Table 1 for representative kinetic descriptors extracted from these emission profiles. Please click here to view a larger version of this figure.
Together, these patterns indicate that wound-induced emissions follow a compound-specific cascade rather than a single synchronous burst, with sharp early components followed by broader, delayed responses.
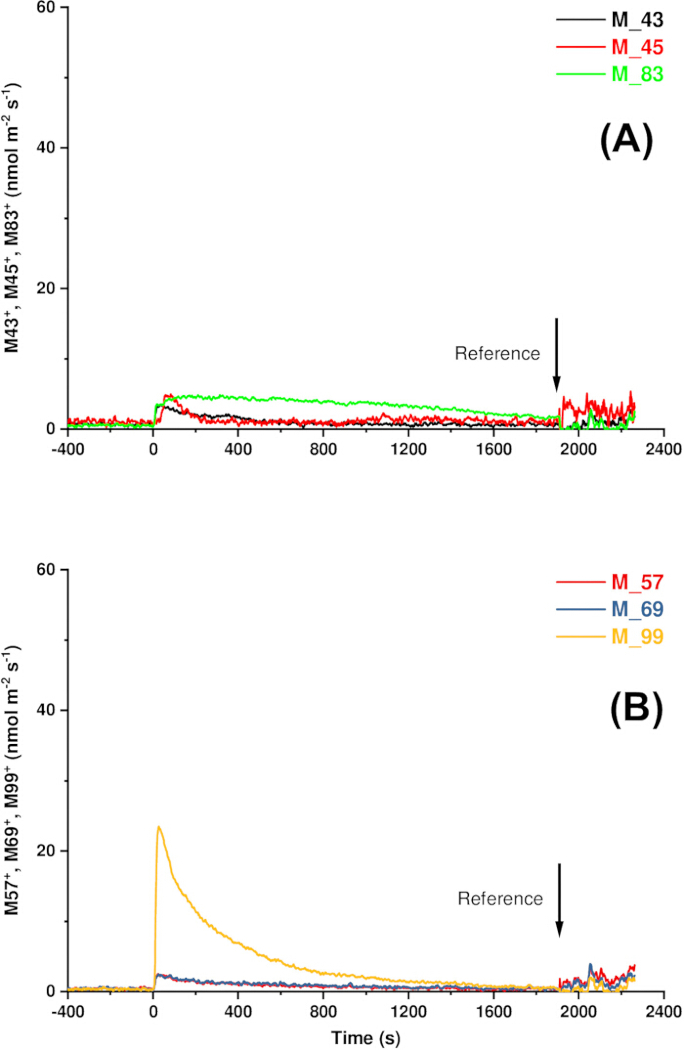
Figure 5: Time-resolved wound-induced volatile emissions in a representative leaf of Gossypium hirsutum. (A) m/z 43, 45, and 83. (B) m/z 57, 69, and 99. The leaf was cut at t = 0 using a within-chamber cutter (Figure 1; 10 mm incision). Volatile emissions were continuously measured with a proton-transfer reaction time-of-flight mass spectrometer (PTR-TOF-MS), and gas exchange was measured with a Walz GFS-3000 system. Signals are shown as representative baseline-corrected emission profiles illustrating the temporal resolution achievable with the protocol. See Table 1 for representative kinetic descriptors extracted from these emission profiles. Please click here to view a larger version of this figure.
Discussion
The protocol presented here enables high-temporal-resolution analysis of wound-induced volatile emissions under controlled experimental conditions. By integrating the cutting event directly into the leaf chamber and continuously monitoring volatile signals (Figure 1), the system captures the emission response without the distortions introduced by delayed sampling, chamber opening, or leaf manipulation outside the measurement setup. These disturbances can shift both the apparent timing and the magnitude of emission peaks in enclosure-based measurements3,6,13,17. By keeping wounding and measurement in the same enclosure, the protocol preserves the emission timeline and enables reliable time-resolved quantification of stress-induced volatile responses.
| Species | Protonated molecular mass | Peak magnitude (nmol m-2 s-1) | Onset after cut (s) | Time of peak (s) | Maximal Slope (nmol m-2 s-2) |
| Quercus rubra | 43 | 21.91 | ~0.0 | 55.6 | 1.49 |
| 45 | 10.52 | 7 | 111.4 | 0.29 | |
| 57 | 21.27 | 20 | 55.6 | 1.37 | |
| 69 | 145.6 | 25 | 61 | 1.44 | |
| 83 | 24.13 | 21 | 71.8 | 1.39 | |
| 99 | 243.16 | 21 | 57.4 | 18.17 | |
| Acer platanoides | 43 | 20.26 | 5.4 | 54 | 1.59 |
| 45 | 18.06 | 1.8 | 154.8 | 0.55 | |
| 57 | 18.65 | 10.8 | 41.4 | 1.55 | |
| 69 | 15.15 | 10.8 | 41.4 | 1.13 | |
| 83 | 8.78 | 7.2 | 57.6 | 0.76 | |
| 99 | 292.86 | 10.8 | 43.2 | 23.62 | |
| Gossypium hirsutum | 43 | 3.5 | 5.4 | 48.6 | 0.19 |
| 45 | 4.98 | 9 | 95.4 | 0.29 | |
| 57 | 2.48 | 10.8 | 36 | 0.18 | |
| 69 | 2.42 | 12.6 | 37.8 | 0.17 | |
| 83 | 4.83 | 14.4 | 223.2 | 0.3 | |
| 99 | 23.47 | 12.6 | 39.6 | 1.95 |
Table 1: Representative values of peak magnitude, emission onset, time to peak, and maximal slope extracted from continuous PTR-TOF-MS measurements following leaf wounding. The values include peak magnitude, emission onset, time to peak, and maximal slope. These values illustrate the type of kinetic descriptors generated by the protocol and are provided as proof-of-concept examples rather than statistical comparisons among species. Emission onset was defined as the first detectable increase above the pre-wounding baseline after cutting, time to peak as the interval between cutting and the maximum signal, and maximal slope as the maximum first derivative of the baseline-corrected signal.
Comparison of sampling positions showed that the sampling configuration markedly affected the recorded signal (Figure 2). Direct sampling at the chamber outlet preserved rapid peak formation, whereas sampling after analyzer tubing delayed peak formation and attenuated the signal intensity. This effect was negligible for isoprene (m/z 69), moderate for m/z 83, and strongest for α-pinene (m/z 137), consistent with increasing transport-related distortion for heavier or more reactive compounds10,21. Adsorption to tube surfaces, delayed transport through the sampling line, and chemical interactions during transport can broaden or attenuate emission peaks, thereby altering the interpretation of volatile kinetics9,12,21.
A central advantage of the present protocol is its ability to resolve the earliest phase of wound-induced volatile emissions. Across all species, this early phase emerged within seconds after cutting and was dominated by a burst at m/z 99, which showed both the highest peak magnitude and the steepest maximal slope (Figure 3, Figure 4, and Figure 5; Table 1). Peak maxima occurred within ~40–57 s after cutting, substantially earlier than the 100–280 s typically reported in previous studies13,19,22. This shift likely reflects the synchronization of wounding and detection within the chamber, minimizing delays caused by leaf handling and sampling-line transport.
By synchronizing wounding and detection within the same enclosure, the protocol also resolved a fragment-level cascade in which m/z 43 and 57 rose immediately after cutting, whereas m/z 45 peaked later and showed broader decay dynamics (Figure 3, Figure 4, and Figure 5; Table 1). This ordering remains consistent with previous PTR-based studies, despite the lack of compound-level separation compared with GC-MS, in which early emissions are dominated by lipoxygenase-derived C6 aldehydes, followed by downstream alcohols and related products19,22. Consistent with previous PTR-TOF-MS studies, the dominant m/z 99 signal aligns with hexenal-type compounds, whose dehydration fragment at m/z 81 has been identified as a major early signal, while m/z 83 reflects contributions from hexenols and hexanal22. This sequence further supports a size- and pathway-dependent hierarchy, in which smaller, rapidly formed oxygenated compounds are released earlier than larger or more complex molecules13,23.
Beyond lipoxygenase-derived fragments, the signal at m/z 69, tentatively assigned to isoprene, exhibited distinct emission trajectories among the representative examples (Figure 3, Figure 4, and Figure 5). Q. rubra showed substantial baseline emissions, whereas A. platanoides and G. hirsutum produced only trace levels, consistent with their known emission characteristics24,25. Across species, isoprene responded only weakly to wounding, consistent with its de novo synthesis via the MEP pathway, which depends on photosynthetic metabolism and is therefore only indirectly affected by mechanical injury15.
These rapid dynamics reflect well-established biochemical responses of leaves to mechanical damage. Mechanical injury rapidly activates the lipoxygenase pathway, which produces transient pulses of C6 volatiles and related oxygenated compounds from membrane lipid oxidation5,7,17,22,23. These emissions show strongly asymmetric dynamics, with a rapid rise after tissue disruption, followed by a slower decay phase16. This asymmetric pattern in the present system unfolds on a timescale of seconds to minutes, as illustrated by the representative kinetic descriptors summarized in Table 1, whereas studies that wound leaves outside the chamber report delayed peaks13. This earlier resolution captures the signal from its onset, reduces temporal smearing, and enables direct quantification of both rise and decay phases. These kinetic features together define the full emission trajectory, which discrete or delayed-sampling approaches often underestimate5,15.
Standardizing the cutting event within the chamber further improves experimental reproducibility by ensuring consistent wound geometry and severity, both of which are determined by incision length and directly influence VOC emission magnitude5,18,22. Nevertheless, because the cutting blade occupies a fixed position within the chamber, incision placement is influenced by leaf size, morphology, and the need to maintain an airtight seal. Whenever possible, the incision should be positioned within the interveinal lamina while avoiding the midrib and other major veins. However, complete avoidance of major veins cannot always be guaranteed, particularly for narrow or small leaves. Because damage to major veins can substantially alter wound-induced VOC emissions5, the incision position should be kept as consistent as possible among samples within the same experiment.
Maintaining stable environmental conditions is equally important for obtaining reproducible wound-induced VOC measurements. Because VOC production, release, and transport are influenced by environmental conditions, chamber temperature, humidity, irradiance, CO2 concentration, and airflow were maintained constant throughout all measurements. Standardizing these variables further minimizes experimental variability and improves the reproducibility of wound-induced VOC kinetics. In addition, because the protocol is fully compatible with simultaneous gas-exchange measurements, future applications may directly relate VOC emission dynamics to changes in photosynthesis and transpiration under identical experimental conditions26. Such measurements may help distinguish biochemical regulation of VOC production from physical processes affecting volatile release, including enhanced evaporation of water-soluble oxygenated compounds from wounded tissue16. Accordingly, differences among treatments or species should be interpreted only when environmental conditions, wound geometry, and plant material, including leaf developmental stage, are standardized throughout the experiment12.
Although previous within-chamber approaches demonstrate the feasibility of real-time wound-induced VOC measurements, they also revealed important technical limitations. Irregular cuts, inconsistent wound size, and disturbances to chamber sealing introduced variability among measurements18,19. In addition, these approaches often relied on relatively large chamber volumes, which slowed air turnover, delayed peak formation, and broadened volatile signal profiles22,27. Such effects become more pronounced for less volatile compounds and may vary with temperature21. In contrast, the smaller chamber used in the present protocol (~8 mL internal volume) reduces air residence time, contributing to the sharper onset observed in our measurements (Figure 1).
The protocol was developed for controlled physiological experiments rather than for direct in situ monitoring of forest ecosystems. Measurements are performed on attached leaves under well-defined environmental conditions, thereby minimizing experimental variability and enabling precise characterization of wound-induced VOC kinetics. Field applications will depend on the availability of portable gas-exchange and VOC detection systems. Nevertheless, because the integrated cutting mechanism can be adapted to different chamber configurations with only minor modifications, the approach should be readily transferable to portable gas-exchange platforms and other experimental platforms as these technologies become available. This flexibility expands opportunities to investigate rapid plant stress responses while preserving the temporal resolution required for accurate characterization of VOC emission dynamics, thereby facilitating mechanistic studies of the earliest physiological and biochemical responses to leaf damage.
Disclosures
The authors declare no conflicts of interest.
Acknowledgements
We acknowledge funding from the Estonian Research Council (PRG2207) and the Ministry of Education and Research of Estonia (Center of Excellence Agro-CropFuture, “Agroecology and new crops in future climates”, TK200U1).
Materials
| Name | Company | Catalog Number | Comments |
|---|---|---|---|
| GC-MS system with TD-20 thermal desorber | Shimadzu | GCMS-QP2010 Plus; TD-20 | GC-MS system with TD-20 thermal desorber. www.shimadzu.com |
| GFS-3000 Gas Exchange System | Walz GmbH | GFS-3000 | Leaf gas-exchange measurements. www.walz.com |
| High-purity helium (99.999%) | Local supplier | N/A | Used for adsorbent cartridge conditioning and GC-MS thermal desorption. www.airliquide.com (or equivalent supplier). |
| Isoprene calibration standard | Sigma-Aldrich Chemie GmbH | Custom | Custom isoprene calibration standard (3.43 ppm). www.sigmaaldrich.com |
| Low-emission sealing putty | Local supplier | N/A | Used to seal the cutter insertion point in the chamber. |
| Multi-bed stainless-steel adsorbent cartridge | Supelco | Custom | 10.5 cm length × 3 mm i.d.; packed with Carbotrap C (0.2 g, 20–40 mesh), Carbopack B (0.1 g, 40–60 mesh), and Carbotrap X (0.1 g, 20–40 mesh). Used for optional offline GC-MS identification of VOCs. www.sigmaaldrich.com |
| Portable constant-flow air sampling pump | SKC Inc. | 210-1003MTX | Portable constant-flow air sampling pump. |
| PTR-TOF 8000 mass spectrometer | Ionicon Analytik GmbH | PTR-TOF 8000 | VOC detection. www.ionicon.com |
| Silver solder wire | Local supplier | N/A | Used to attach a razor blade to a stainless steel rod. |
| Spring brass sheet (0.2 mm thickness) | Local supplier | N/A | Flexible supports used to secure the cutter. |
| Stainless steel rod (1 mm diameter) | Local supplier | N/A | Cutter support rod. |
| Stainless steel syringe needle (1.6 mm outer diameter) | Local supplier | N/A | Housing for a rotating cutter blade. |
| Teflon stoppers | Local supplier | N/A | Used to seal the cutter housing while allowing rotation. |
| Teflon T-piece connector | Local supplier | N/A | Installed near the chamber outlet to reduce tubing length. |
| Teflon tubing (FEP or PTFE) | Local supplier | N/A | VOC sampling line between the chamber and the detectors. |
| VOC calibration gas mixture | Ionimed GmbH | Custom | 1 ppm of each compound in N2; used for PTR-TOF-MS calibration. www.ionimed.com |
References
- Bergman ME, Huang XQ, Baudino S, Caissard JC, Dudareva N. Plant volatile organic compounds: emission and perception in a changing world. Curr Opin Plant Biol. 2025;85:102706.
- Luo R, Lun X, Gao R, Wang L, Yang Y, Su X, et al. A review of biogenic volatile organic compounds from plants: research progress and future prospects. Toxics. 2025;13(5):1-35.
- Molleman F, Mandal M, Sokół-Łętowska A, Walczak U, Volf M, Mallick S, et al. Simulated herbivory affects the volatile emissions of oak saplings, while neighbourhood affects flavan-3-ols content of their leaves. J Chem Ecol. 2024;50(5-6):250-261.
- Huang PC, Berg-Falloure KM, Gao X, Meeley R, Kolomiets MV. Pentyl leaf volatiles promote insect and pathogen resistance via enhancing ketol-mediated defense responses. Plant Physiol. 2025;197(2):1-18.
- Portillo-Estrada M, Niinemets Ü. Massive release of volatile organic compounds due to leaf midrib wounding in Populus tremula. Plant Ecol. 2018;219(9):1021-1028.
- Engelberth M, Engelberth J. Leaf developmental stages strongly modulate indole emissions in response to simulated insect herbivory. Plants (Basel). 2025;14:3761.
- Matsui K. How and why plants came to smell green: the origins, biosynthesis, and roles of green leaf volatiles. J Exp Bot. 2025;76:1-14.
- Waterman JM, Cazzonelli CI, Hartley SE, Johnson SN. Simulated herbivory: the key to disentangling plant defence responses. Trends Ecol Evol. 2019;34(5):447-458.
- Tholl D, Boland W, Hansel A, Loreto F, Röse USR, Schnitzler JP. Practical approaches to plant volatile analysis. Plant J. 2006;45(4):540-560.
- Ormeño E, Goldstein A, Niinemets Ü. Extracting and trapping biogenic volatile organic compounds stored in plant species. TrAC Trends Anal Chem. 2011;30(7):978-989.
- Chang YY, Huang YM, Chang HT. Using headspace gas chromatography-mass spectrometry to investigate the volatile terpenoids released from the Liquidambar formosana leaf and its essential oil. Forests. 2024;15(9):1-12.
- Niinemets Ü, Kuhn U, Harley PC, Staudt M, Arneth A, Cescatti A, et al. Estimations of isoprenoid emission capacity from enclosure studies: measurements, data processing, quality and standardized measurement protocols. Biogeosciences. 2011;8(8):2209-2246.
- Portillo-Estrada M, Kazantsev T, Talts E, Tosens T, Niinemets Ü. Emission timetable and quantitative patterns of wound-induced volatiles across different leaf damage treatments in aspen (Populus tremula). J Chem Ecol. 2015;41(12):1105-1117.
- Waterman JM, Cofer TM, Von Laue OM, Mateo P, Wang L, Erb M. Leaf size determines damage- and herbivore-induced volatile emissions in maize. Plant Cell Environ. 2025;48(5):3766-3777.
- Yuan Y, Mao Y, Yuan H, Guo M, Zhou G, Niinemets Ü, et al. Impacts of mechanical injury on volatile emission rate and composition in 45 subtropical woody broad-leaved storage and non-storage emitters. Plants (Basel). 2025;14(5):1-40.
- Rasulov B, Talts E, Niinemets Ü. A novel approach for real-time monitoring of leaf wounding responses demonstrates unprecedentedly fast and high emissions of volatiles from cut leaves. Plant Sci. 2019;283:256-265.
- Portillo-Estrada M, Okereke CN, Jiang Y, Talts E, Kaurilind E, Niinemets Ü. Wounding-induced VOC emissions in five tropical agricultural species. Molecules. 2021;26(9):1-20.
- Mithöfer A, Wanner G, Boland W. Effects of feeding Spodoptera littoralis on lima bean leaves. II. Continuous mechanical wounding resembling insect feeding is sufficient to elicit herbivory-related volatile emission. Plant Physiol. 2005;137(3):1160-1168.
- Brilli F, Ruuskanen TM, Schnitzhofer R, Müller M, Breitenlechner M, Bittner V, et al. Detection of plant volatiles after leaf wounding and darkening by proton transfer reaction time-of-flight mass spectrometry (PTR-TOF). PLoS One. 2011;6(5):e20419.
- Kännaste A, Copolovici L, Niinemets Ü. Gas chromatography-mass spectrometry method for determination of biogenic volatile organic compounds emitted by plants. In: Rodríguez-Concepción M, editor. Plant Isoprenoids Methods and Protocols. New York (NY): Humana Press; 2014. p. 161-169.
- Schaub A, Blande JD, Graus M, Oksanen E, Holopainen JK. Real-time monitoring of herbivore-induced volatile emissions in the field. Physiol Plant. 2010;138(2):123-133.
- Fall R, Karl T, Hansel A, Jordan A, Lindinger W. Volatile organic compounds emitted after leaf wounding: on-line analysis by proton-transfer-reaction mass spectrometry. J Geophys Res Atmos. 1999;104(D13):15963-15974.
- Kaur D, Schedl A, Lafleur C, Martinez Henao J, van Dam NM, Rivoal J, et al. Arabidopsis transcriptomics reveals the role of Lipoxygenase2 (AtLOX2) in wound-induced responses. Int J Mol Sci. 2024;25(11):5898.
- Gentner DR, Ormeño E, Fares S, Ford TB, Weber R, Park JH, et al. Emissions of terpenoids, benzenoids, and other biogenic gas-phase organic compounds from agricultural crops and their potential implications for air quality. Atmos Chem Phys. 2014;14(11):5393-5413.
- Harley P, Deem G, Flint S, Caldwell M. Effects of growth under elevated UV-B on photosynthesis and isoprene emission in Quercus gambelii and Mucuna pruriens. Glob Chang Biol. 1996;2(2):149-154.
- Lobo-do-Vale R, Schenk HJ, Kübert A, Lintunen A. Gas phase in plants: integrating physiology, ecology and environmental sciences. Tree Physiol. 2026;46(13):1-4.
- Niinemets Ü. Whole plant photosynthesis. In: Flexas J, Loreto F, Medrano H, editors. Terrestrial Photosynthesis in a Changing Environment A Molecular Physiological and Ecological Approach. Cambridge: Cambridge University Press; 2012. p. 399-423.
Reprints and Permissions
This article has been published
Video Coming Soon