This protocol aims to evaluate melanoma development in zebrafish xenografts using in vivo electron paramagnetic resonance (spectroscopy to detect and analyze melanin radicals), offering a novel approach for preclinical melanoma research and therapeutic assessment.
Method Article
X-Band Electron Paramagnetic Resonance For Monitoring Of Melanin-Associated Radical Changes In Zebrafish Melanoma Xenografts In Vivo
In This Article
Summary
Abstract
This protocol presents a novel in vivo application of X-band (9.5 GHz) electron paramagnetic resonance spectroscopy for monitoring melanin-associated radical dynamics in zebrafish (Danio rerio) melanoma xenograft models. The goal of this method is to enable direct, label-free, and quantitative assessment of melanin-associated redox changes during embryonic development, and tumor–host interactions in a physiologically relevant vertebrate model.
By leveraging the intrinsic paramagnetic properties of melanin, this approach provides complementary biochemical information that cannot be obtained using conventional fluorescence-based imaging alone. Importantly, the detected electron paramagnetic resonance signal reflects the redox-active fraction of the melanin polymer and therefore serves as a redox-sensitive readout rather than a direct measure of total pigment abundance.
Method performance was validated through selective detection of melanin-associated radicals in pigmented wild-type embryos, absence of signal in albino controls, statistically significant developmental changes in normalized electron paramagnetic resonance signal across independent biological replicates, and comparable results obtained using alternative sample holders and frozen samples.
By combining X-band electron paramagnetic resonance spectroscopy with zebrafish xenograft models, this protocol provides a scalable, ethically favorable, and transferable platform for preclinical melanoma research, redox biology studies, and evaluation of melanogenesis-modulating interventions.
Introduction
The overall goal of this study is to develop and validate a reliable in vivo method for the detection and quantification of melanin radicals in zebrafish (Danio rerio) embryos xenograft model combined with X-band (9.5 GHz) electron paramagnetic resonance spectroscopy. This approach aims to enable direct, quantitative assessment of melanin-associated redox processes during melanoma development and in response to pharmacological interventions.
Melanin is a heterogeneous group of biopolymers responsible for pigmentation in skin, hair, and eyes across a wide range of organisms. Among its forms, eumelanin and pheomelanin play distinct roles in biology. Eumelanin exhibits antioxidant and photoprotective properties, whereas pheomelanin can promote reactive oxygen species (ROS) generation, particularly under UV exposure1,2,3. Both antioxidant and prooxidant actions are related to the formation of melanin radicals. At the molecular level, melanin is a heterogeneous redox-active polymer composed of indolic and quinone-containing subunits that can exist in multiple physicochemical states, including fully oxidized quinone, partially reduced semiquinone, and fully reduced hydroquinone forms4,5,6. The relative abundance of semiquinone radical species is dynamic and depends on local physicochemical conditions, including oxygen availability, reactive oxygen species (ROS), metal ion interactions, pH, degree of polymerization, and melanosome maturation7,8,9.
Thus, methods enabling quantitative assessment of these radical concentrations are needed for a better understanding of changes in the redox state of melanin. In melanoma, the dysregulation of melanogenesis in melanocytes contributes to melanoma initiation and progression. This dysregulation is often related to redox state shifts, dependent on local microenvironmental conditions. This makes melanin redox activity an important factor in tumor biology10. Therefore, methods enabling direct assessment of melanin radicals are essential for understanding melanoma pathogenesis and therapeutic response.
Zebrafish embryos represent a powerful in vivo model for studying pigmentation and melanoma. Up to 5 days post-fertilization (120 hours post-fertilization, hpf), they are not classified as protected animals under Directive 2010/63/EU, allowing high-throughput experimentation without formal ethical approval. Rapid development, optical transparency, and established protocols make zebrafish highly suitable for toxicological and pharmacological studies11,12. Importantly, this fish shares significant genetic and physiological similarities with humans, and key pathways involved in melanogenesis are conserved13. While wild-type zebrafish predominantly produce eumelanin and serve as a model for physiological pigmentation, xenograft models—based on the implantation of melanoma cell lines which produce eumelanin and pheomelanin —enable the investigation of mammalian tumor progression and drug responses in a physiologically relevant microenvironment14,15.
Currently, fluorescence-based imaging is the standard method used in zebrafish melanoma xenograft studies. This approach allows real-time visualization of tumor growth, migration, and treatment response through fluorescent dyes, e.g., dichlorodihydrofluorescein diacetate (DCFDA) or transgenic lines (Grx1-roGFP2, HyPer)16,17. However, fluorescence techniques primarily provide morphological and spatial information and are limited in their ability to capture biochemical and redox-related processes. Additionally, their readouts may be affected by photobleaching, dye leakage, interference from fluorescent drug compounds, and potential alterations in cell physiology caused by labeling. Critically, fluorescence-based methods do not provide direct information about melanin radicals or their dynamic redox behavior.
Electron paramagnetic resonance spectroscopy offers a unique and powerful analytical approach, as it enables direct detection and quantification of paramagnetic species, including stable melanin-associated radicals. Both eumelanin and pheomelanin contain semiquinone moieties that generate characteristic electron paramagnetic resonance signals, and the relative contribution of these signals has been explored as a biomarker of pigmentation status and melanoma progression18,19. Importantly, because only the redox-active semiquinone fraction contributes directly to the detected signal, electron paramagnetic resonance spectroscopy provides complementary information to conventional melanogenesis-related assays, such as melanin content quantification, tyrosinase activity, or pigmentation analysis. Accordingly, electron paramagnetic resonance signal intensity should be interpreted as a redox-sensitive readout of melanin functional state, influenced by local physicochemical conditions, rather than as a direct measure of total pigment abundance.
While most in vivo electron paramagnetic resonance studies have been conducted using L-band systems (a form of electron paramagnetic resonance spectroscopy that uses low-frequency microwaves (around 1–2 GHz) to study paramagnetic species, particularly in larger samples where deeper signal penetration is needed)20— X-band electron paramagnetic resonance provides higher spectral resolution and sensitivity for small-volume samples, making it particularly suitable for zebrafish embryos. Furthermore, recent technical developments, including multi-harmonic detection systems, significantly improve signal quality and enable reliable measurements in challenging (small and more hydrated) biological samples21,22. The X-band resonator size is the proper size for a few zebrafish embryos, which, combined with higher resolution than for the L-band system, enables the reduction of the number of animals used. This is especially important when working with xenograft models.
Despite these advantages, the application of X-band electron paramagnetic resonance to living zebrafish embryos and melanoma xenografts in this model remains largely unexplored. In vitro studies using melanoma cell lines, such as B16F10, have provided valuable insights into melanin radical properties; however, they lack the complex physiological context of a living organism23,24. In particular, the zebrafish microenvironment introduces critical factors—such as oxygen gradients, cell–cell interactions, and dynamic metabolic activity—that may significantly influence melanin radical behavior25,26. Therefore, there is a clear need to develop and validate an in vivo methodology that enables direct measurement of melanin radicals under physiologically relevant conditions.
In this study, we present a detailed protocol for applying X-band electron paramagnetic resonance spectroscopy to zebrafish embryos, including xenograft models containing B16F10 and B16F1 melanoma cell lines. This method provides a complementary approach to fluorescence-based imaging by enabling quantitative assessment of melanin radical content, thus giving insight into redox dynamics. By integrating structural and spatial information from fluorescence techniques with biochemical insights from electron paramagnetic resonance, this combined strategy enhances the analytical power of zebrafish models for preclinical melanoma research. Importantly, the electron paramagnetic resonance signal detected in this protocol reflects the redox-active fraction of the melanin polymer. Accordingly, signal intensity should be interpreted as a redox-sensitive readout rather than a direct measure of total melanin content, and considered in combination with the total pigment content as an indication of melanin-associated redox shifts. Due to the whole-organism measurement approach and the limited number of injected melanoma cells, the detected signal primarily represents global melanin-associated radical changes at the level of the entire zebrafish embryo/larva, rather than a melanoma-specific signal originating exclusively from the xenograft. This distinction is particularly relevant in dynamic biological systems, where shifts in melanin oxidation state may occur independently of changes in overall pigment quantity.
Protocol
Zebrafish (Danio rerio) embryos were used in this study up to 5 days post-fertilization (120 hpf). At this developmental stage, embryos are not considered protected animals under Directive 2010/63/EU and therefore experiments do not require formal authorization by an ethics committee. Nevertheless, all work was conducted in accordance with good laboratory practices and institutional guidelines for the care and use of zebrafish.
1. Preparation of reagents and maintenance of B16F1 and B16F10 mouse melanoma cell lines
- Preparation of complete medium
- Add 50 mL of fetal bovine serum (FBS) and 5.5 mL of penicillin-streptomycin solution to 500 mL of Dulbecco's Modified Eagle Medium (DMEM).
- Warm the complete medium to 37 °C before use.
NOTE: Use pre-warmed solutions to minimize thermal stress during cell handling.
- Thawing and starting culture from frozen cells
- Quickly thaw the frozen vial with cells in a 37 °C water bath (~1–2 min).
- Disinfect the exterior of the vial with 70% ethanol. Perform all subsequent steps under aseptic conditions.
- Transfer the cell suspension to a 15 mL conical tube containing 9 mL of pre-warmed complete medium. Retain a small aliquot of the original suspension for mycoplasma testing.
- Centrifuge cells in the centrifuge tube at 200 × g for 5 min at room temperature.
- Aspirate the supernatant to remove residual dimethyl sulfoxide (DMSO; from the freezing medium).
- Resuspend the cell pellet in 10 mL of fresh and pre-warmed complete medium.
- Transfer cells to a ⌀9 cm Petri dish and gently swirl in a figure-eight motion to evenly distribute the cells.
- Incubate cells at 37°C, 5% CO₂, and ≥95% humidity overnight.
- Replace the culture medium with fresh pre-warmed complete medium after 16–24 h.
- Continue incubation until the cells reach >80% confluency. Proceed to subculturing (see step 1.3).
NOTE: Alternatively to Petri dishes, sterile culture vessels (e.g., T-flasks) may be used. If smaller dishes or flasks are preferred, split the cells proportionally to maintain the same relative culture surface area.
- Subculturing of cells
- Remove the culture medium from the cell monolayer. Retain a small aliquot for mycoplasma testing.
- Add 10 mL of phosphate-buffered saline (PBS) to the culture dish.
- Let the PBS sit on the cells at room temperature for 3–5 min to allow complete removal of serum proteins.
- Gently aspirate the PBS, taking care not to dislodge the cells.
- Add 1 mL of cell dissociation reagent and incubate at 37°C until cells round up and detach (do not exceed 5 min incubation time).
- Add 1 mL of pre-warmed complete medium to stop enzymatic dissociation.
- Gently pipette the cell suspension up and down several times to obtain a single-cell suspension.
- Transfer the cells to a new Petri dish or T-flask containing a pre-warmed complete medium at a split ratio of 1:4 to 1:10. Gently swirl in a figure-eight motion to evenly distribute the cells.
- Incubate cells at 37 °C, 5% CO₂, and ≥95% humidity.
NOTE: Use pre-warmed solutions (37 °C) and perform all procedures under aseptic conditions in a Class II biological safety cabinet while wearing appropriate personal protective equipment. Subculture cells every 2–3 days or at 80–90% confluency. Use low-passage cells (<P20 after thawing), record passage number, and routinely monitor cultures for contamination and morphological changes.
- Cryopreservation (Banking) of cells
- Use healthy, exponentially growing cells (~70%–80% confluent).
- Harvest the cells as described in steps 1.3.1–1.3.7 and transfer the cell suspension to a 15 mL conical tube.
- Centrifuge the cells at 300 × g for 2 min.
- Remove the supernatant and resuspend the cells in cryopreservation medium at 1–5 × 10⁶ cells/mL.
- Aliquot cell suspension into labeled cryovials (cell line, passage number, date).
- Freeze vials overnight at -80°C using a controlled-rate freezing container.
- As an alternative, employ a nested insulation method: insert the vials into a small styrofoam rack designed for 1.5/2.0 mL tubes, which is then situated inside a larger polystyrene box.
NOTE: This double-layer configuration is designed to provide the thermal buffering required to achieve a gradual cooling rate, which is critical for successful cryopreservation.
NOTE: Cryogenic materials must be handled with insulated gloves and face protection. Follow institutional guidelines for liquid nitrogen and hazardous waste handling.
- As an alternative, employ a nested insulation method: insert the vials into a small styrofoam rack designed for 1.5/2.0 mL tubes, which is then situated inside a larger polystyrene box.
- Following overnight incubation at -80 °C, transfer vials to liquid nitrogen for long-term storage. Cryovials may be stored at -80 °C for short-term storage.
- Mycoplasma testing
- Collect a small aliquot of culture medium or cell suspension during thawing, subculturing, or cryopreservation.
- Assess mycoplasma contamination using a validated PCR-based or enzymatic mycoplasma detection kit according to the manufacturer's instructions.
- Use mycoplasma-negative cultures for experiments or cell-line banking.
- Record results and discard or isolate any contaminated cultures until cleared.
NOTE: Regularly test for mycoplasma contamination.
2. Cancer cell transplantation into zebrafish larvae
- Prepare cancer cells for transplantation
- Grow cells to ~80% confluency.
- Harvest the cells as described in steps 1.3.1–1.3.7.
- Transfer the cell suspension to a 2 mL microcentrifuge tube.
- Centrifuge the cells at 300 × g for 2 min at room temperature.
- Remove the supernatant and wash the cell pellet with 1 mL of sterile PBS.
- Repeat step 2.1.4–2.1.5 and resuspend the cells in the leftover PBS. More dense suspension will give less sedimentation.
- Pipette the suspension up and down gently until a homogeneous single-cell suspension is obtained.
NOTE: Use of 200 µL pipette tip pre-wetted (primed) with a 45% polyvinylpyrrolidone (PVP) solution as it helps to prevent cell sedimentation within the injection microneedle. - Keep the cell suspension on ice until injection.
NOTE: If cell clumping occurs, pass the cell suspension through a 35–40 µm cell strainer and/or treat the cells with 0.01–0.05 mg/mL DNase I.
- Zebrafish egg production
- On the evening prior to the expected egg collection, place the adult zebrafish in breeding tanks containing system water (set up for spawning).
- Keep the tanks in total darkness overnight; this ensures that spawning is triggered in the morning the next day, when the lights are turned on.
- The fish will spawn after the light onset the following day. Collect the eggs by pouring the tank water thorough tea strainer.
- Rinse the eggs thoroughly with E3 medium (5 mM NaCl, 0.17 mM KCl, 0.33 mM CaCl2, 0.33 mM MgSO4).
- Transfer fertilized eggs to 9 cm Petri dishes containing 20–25 mL of E3 medium. Place no more than 50 embryos in each dish.
- Incubate the embryos at 28 °C until further use.
NOTE: Take care to keep eggs moist at all times.
- Zebrafish embryo preparation
- Remove the chorions manually from embryos at approximately 36 hpf.
- Use two pairs of ultra-fine Jewelry No. 5 forceps. With one pair, firmly but gently pinch the chorion to stabilize the egg. Use the second pair of forceps to grab the chorion near the first pair.
- Gently pull the forceps in opposite directions to create a small tear. Carefully widen the opening until the embryo slides out.
- Anesthetize dechorionated larvae with freshly prepared tricaine solution according to established zebrafish protocols27.
NOTE: Embryos without chorions are fragile, sticky, and must be prevented from exposure to air. Use glass pipettes and agarose-coated Petri dishes while working with zebrafish <3 dpf.
- Remove the chorions manually from embryos at approximately 36 hpf.
- Prepare microinjection needles
- Pull filament-free glass capillaries using a puller with parameters set according to the manufacturer's guidelines.
- Using fine forceps, break the needle tip in two steps: first, make a small break at the needle fine tip. Then, perform a second break exactly where the cells get stuck. This creates an optimal opening that is just large enough for the cells to pass through, while remaining as small as possible.
- Backfill the needle with the cell suspension using a long microlader - a tip for filling glass microcapillaries. Avoid introducing air bubbles.
- Use the highest possible cell density (maximal concentration) for the suspension; the specific cell dose is controlled via the injector settings.
- Load the needle frequently with small aliquots, limiting the suspension column within the needle to a maximum height of 2 mm. This minimizes cell sedimentation within the needle, ensuring a more homogenous distribution and consistent delivery during injections.
- Mount the loaded needle onto a holder of the microinjection apparatus.
- Adjust the injection pressure and pulse duration to deliver the desired number of cells per injection (the total volume of the injected cell suspension should not exceed the size of the eye of the zebrafish embryo at the injection time).
NOTE: Detailed examples of zebrafish xenograft microinjection methodology were described previously by other authors28.
- Microinjection procedure
- Inject the cell suspension into either the yolk sac or the circulation according to the experimental design.
- Deliver more than 1000 cells per embryo under calibrated injection conditions.
NOTE: Include phosphate-buffered saline (PBS)-injected embryos as negative controls.
- Post-injection handling
- Maintain injected embryo/larvae at 28-32 °C
- Monitor larval survival and developmental progression daily under a dissecting scope.
- Assess tumor cell proliferation and migration at the selected experimental time points.
- Proceed with electron paramagnetic resonanse (EPR) measurement as described in section 3.1 or store sample as described in section 2.7
NOTE: Discard larvae with injection trauma or improper injection. Follow all institutional biosafety and animal care guidelines. Handle tricaine and biological waste according to safety protocols. Dispose of hazardous materials according to regulations.
- Sample collection for freezing
- Euthanize the larvae by immersion in a chilled tricaine solution for at least 3 min.
- Transfer groups of 10 larvae to 1.5 mL microcentrifuge tubes. Remove the excess medium from each tube.
- Store samples at -20 °C until electron paramagnetic resonance analysis.
3. Melanin radical detection by electron paramagnetic resonance spectroscopy
- Melanin radical detection in zebrafish larvae in vivo
- Turn on the X-band electron paramagnetic resonance spectrometer and allow the system to stabilize according to the manufacturer's instructions.
- Transfer 20–30 zebrafish larvae (3–5 days post-fertilization, dpf) to a 1.5 mL microcentrifuge tube.
- Fill the flat capillary for zebrafish larvae with 100 µL of E3 medium.
- Seal one end of the capillary with a plastic cap and ensure that the liquid column remains confined to the flat chamber.
- Transfer several larvae together with a small volume of E3 medium into a 100 µL hematocrit capillary.
- Gently deposit larvae from hematocrit capillary at the top of the flat part.
NOTE: Take care to preserve the continuity of the solution. No air bubbles should be present in the flat part or near the top of the flat part. - Remove excess liquid from the outer tubular section of the capillary while maintaining continuous liquid contact within the flat chamber.
- Repeat steps 3.1.5–3.1.7 until 20–30 larvae are loaded into the flat capillary.
- Remove residual liquid from the tubular sections of the capillary.
- Insert the capillary into the electron paramagnetic resonance spectrometer and position the sample at the center of the resonator.
- Set the acquisition parameters in the spectrometer software as follows: center field = 335 mT; sweep width = 10 mT; modulation amplitude = 500 µT; microwave power = 1.6 mW; number of scans = 32; sweep time = 11 s; time constant = 0.
- Acquire the electron paramagnetic resonance spectrum.
- Remove the capillary from the resonator and release the larvae into fresh E3 medium in a Petri dish.
NOTE: Avoid introducing air bubbles during sample loading, as discontinuities in the liquid column may reduce signal reproducibility. If multiharmonic detection is not available, reduce the modulation amplitude and optimize the acquisition parameters to maximize signal intensity without spectral distortion.
- Melanin radical detection in frozen zebrafish larvae
- Thaw a frozen sample containing 10 euthanized zebrafish larvae at room temperature for 5–10 min.
- Add 100 µL of E3 medium to the thawed sample.
- Transfer the larvae together with the medium into a 100 µL hematocrit capillary.
- Remove excess liquid from the capillary until the sample occupies only the active resonator volume (about 1 cm length).
- Seal the capillary with a sealing compound.
- Insert the capillary into the electron paramagnetic resonance spectrometer and position the sample at the center of the resonator.
- Set the acquisition parameters in the spectrometer software as follows: center field = 335 mT; sweep width = 10 mT; modulation amplitude = 500 µT; microwave power = 1.6 mW; number of scans = 32; sweep time = 11 s; time constant = 0.
- Acquire and save the electron paramagnetic resonance spectrum.
NOTE: Ensure that the upper edge of the sample remains below the upper edge of the resonator to avoid signal distortion. If multiharmonic detection is not available, reduce the modulation amplitude and optimize microwave power to maximize signal intensity without spectral distortion.
- Extracting electron paramagnetic resonance data from multiharmonic analyzer software and post-processing of spectra
- Open the recorded electron paramagnetic resonance spectrum in the multiharmonic analysis software.
- Enable dual-channel signal processing by selecting Use two channels.
- Set the number of processed harmonics to 30.
- Adjust the Microwave phase/deg parameter until symmetrical absorption and dispersion components are obtained.
- Adjust the Modulation phase/deg parameter until Channel 1 displays a pure absorption signal and Channel 2 displays a pure dispersion signal.
- Adjust the Modulation amplitude/G parameter until the narrowest undistorted spectral line is obtained.
- Set the Low pass/Hz parameter to reduce high-frequency noise while preserving spectral line shape.
- Select the Noise suppression tab and click Enable noise suppression. Adjust the Smoothing factor and Narrow line refinement parameters until the signal-to-noise ratio is improved without visible distortion of the spectral line.
- Select the Artifacts tab and enable Outlier correction and Bandwidth correction.
- Save spectra in a format used by the data analysis software for further analysis.
- Calculate the double-integrated signal intensity using numerical integration in suitable data analysis software.
NOTE: When working with high-Q resonators, bandwidth correction improves reconstruction of higher harmonic components. Multiharmonic reconstruction enables recovery of undistorted spectra from overmodulated raw data and improves signal-to-noise ratio in low-intensity biological samples.
Results
A schematic overview of the experimental workflow is presented in Figure 1. Zebrafish embryos were collected, transplanted with B16F10 melanoma cells, incubated under controlled conditions, and monitored by bright-field or fluorescence microscopy prior to X-band electron paramagnetic resonance analysis. Living embryos were subsequently loaded into a flat capillary/sample holder for whole-organism electron paramagnetic resonance measurements, enabling non-invasive detection of melanin-associated radical signals. Following electron paramagnetic resonance acquisition, embryos were released into fresh E3 medium, allowing longitudinal measurements in the same biological specimens.
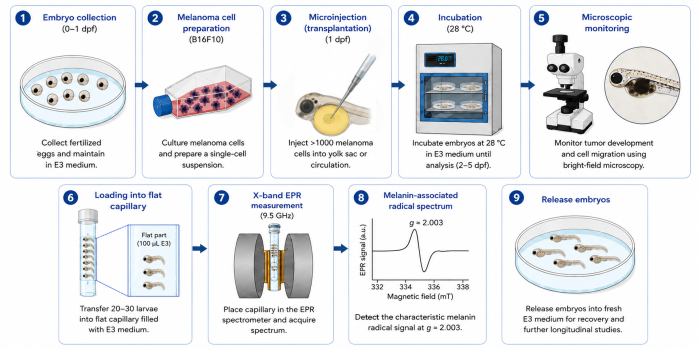
Figure 1: Graphical overview of the experimental workflow for in vivo monitoring of melanin-associated radicals in zebrafish melanoma xenografts using X-band electron paramagnetic resonance (EPR) spectroscopy. Zebrafish embryos are collected, transplanted with melanoma cells, incubated, and monitored microscopically before loading into a custom flat capillary for whole-organism EPR measurements. Following detection of the characteristic melanin-associated radical signal (g ≈ 2.003), larvae are released for longitudinal follow-up measurements. Please click here to view a larger version of this figure.
To validate the specificity of the method, measurements were performed on wild-type (WT) and albino zebrafish embryos. WT embryos begin to develop visible pigmentation at approximately 27 hpf. Correspondingly, electron paramagnetic resonance spectra acquired from WT embryos exhibit a characteristic single-line signal centered at g ≈ 2.003, consistent with eumelanin-derived semiquinone radicals (e.g., DHI/DHICA). In contrast, albino embryos, which lack functional melanin synthesis, show no detectable electron paramagnetic resonance signal in the same spectral region even at 5 days post-fertilization (dpf). This confirms that the observed signal originates specifically from melanin radicals and represents a negative control validating method selectivity (Figure 2).
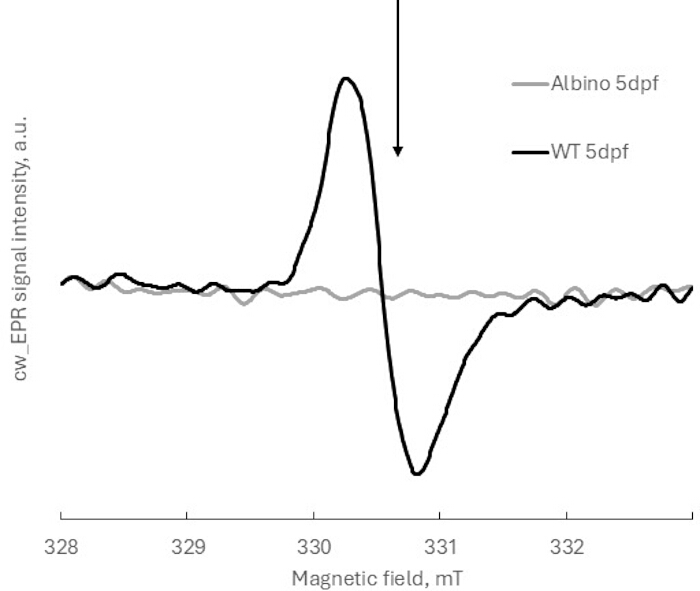
Figure 2: Representative X-band electron paramagnetic resonance spectra of wild-type (WT) and albino zebrafish embryos at 5dpf. The arrow indicates the resonance position (g ≈ 2.003) of the melanin-associated radical signal from 5dpf WT zebrafish embryos. Please click here to view a larger version of this figure.
The method enables quantitative monitoring of melanin radical formation during development. As pigmentation progresses, a clear increase in electron paramagnetic resonance signal intensity is observed. Comparison of WT embryos from 2 dpf to 5 dpf shows a substantial increase in the double-integrated electron paramagnetic resonance signal normalized per embryo. The normalization was done by dividing the raw electron paramagnetic resonance signal intensities by the number of embryos in the sample prior to calculating the double integral (Figure 3A).
Statistical analysis was performed using the Kruskal–Wallis test followed by Dunn's multiple comparisons test. Analysis across six independent biological replicates (each comprising 7–10 embryos) demonstrated statistically significant differences in the normalized electron paramagnetic resonance signal between developmental stages (p < 0.05), confirming the sensitivity of the method.
The double integral of the electron paramagnetic resonance spectra is proportional to the number of unpaired electron spins. Thus, its increase indicates an increase in the population of melanin-associated radicals during development. Importantly, this increase likely reflects changes in melanin redox equilibrium associated with progressive melanogenesis, rather than pigment accumulation alone.
Reproducibility of the protocol was further evaluated by comparing representative electron paramagnetic resonance spectra acquired from samples containing different numbers of embryos (7 versus 10) at the same developmental stage (5 dpf). As expected, raw spectra showed differences in signal amplitude proportional to sample size (Figure 3B). After normalization of each spectrum to the number of embryos per sample, the spectra overlapped almost completely (Figure 3C), and inter-batch variability remained below 10%. These results highlight the importance of per-embryo normalization and confirm the robustness of the method for comparative studies.
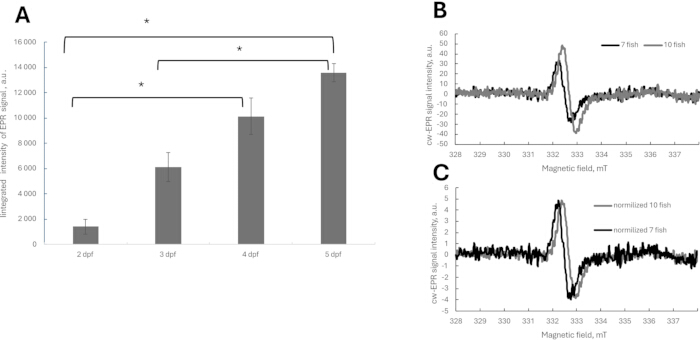
Figure 3: Quantitative monitoring of developmental melanin-associated radical dynamics and normalization of electron paramagnetic resonance spectra. (A) Double-integrated X-band electron paramagnetic resonance signal obtained from wild-type (WT) zebrafish embryos at 2, 3, 4, and 5 days post-fertilization (dpf). Signal intensity was normalized to the number of embryos per sample. Data represent mean ± SD of six independent biological replicates, each comprising 7–10 embryos. Statistically significant differences - *p < 0.05. (B) Representative raw electron paramagnetic resonance spectra acquired from 5 dpf WT embryos using samples containing 7 and 10 embryos. Signal amplitude increases proportionally with the number of embryos in the sample. (C) The same electron paramagnetic resonance spectra shown in panel B after normalization, i.e., the raw spectral intensities are divided by the number of embryos in the capillary. Please click here to view a larger version of this figure.
To evaluate whether the protocol depends on the custom flat capillary used for in vivo zebrafish measurements, melanin-associated radical detection was performed using both the custom flat capillary and a standard commercially available capillary for ex vivo analysis. Representative electron paramagnetic resonance spectra acquired using both sample holders showed highly comparable line shape and resonance position (Figure 4A), indicating that reliable detection of melanin-associated radicals is not restricted to the custom capillary design. Signals from the flat capillaries, after normalization per embryo, were 2 times lower than those recalculated from the standard capillary.
To further assess sample handling flexibility, zebrafish embryos were measured immediately after collection and after freezing, followed by ex vivo analysis using standard capillaries. No statistically significant differences were observed between fresh and frozen samples across six independent biological replicates (Figure 4B). These results demonstrate that the protocol can be adapted to commonly available electron paramagnetic resonance sample holders and supports delayed ex vivo analysis, significantly increasing the accessibility, flexibility, and reproducibility of the method across laboratories with different electron paramagnetic resonance spectrometers.
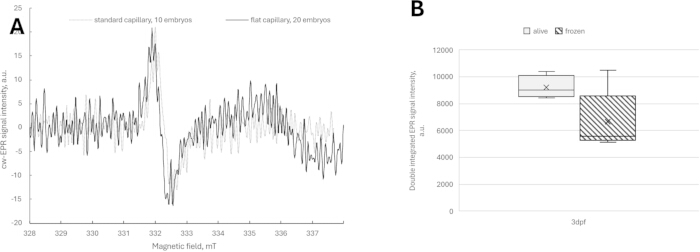
Figure 4: Compatibility of the protocol. (A) Raw electron paramagnetic resonance spectra measured in standard and flat capillaries of 2dpf WT zebrafish. (B) Comparison of the same biological replicates (3 dpf WT zebrafish) measured alive and frozen in standard capillaries. Please click here to view a larger version of this figure.
To determine whether the detected electron paramagnetic resonance signal could be attributed directly to melanoma-derived melanin radicals, albino zebrafish embryos were used as a melanin-free background and injected with B16F10 melanoma cells. Electron paramagnetic resonance measurements were performed at 4 days post-fertilization (dpf) under the same acquisition conditions used for wild-type embryos. As expected, non-injected albino embryos showed no detectable electron paramagnetic resonance signal in the melanin-specific spectral region. Importantly, no detectable melanin-associated electron paramagnetic resonance signal was observed in albino embryos with injected B16F10 cells (Figure 5A), despite successful cell engraftment confirmed by bright microscopy (Figure 5B).
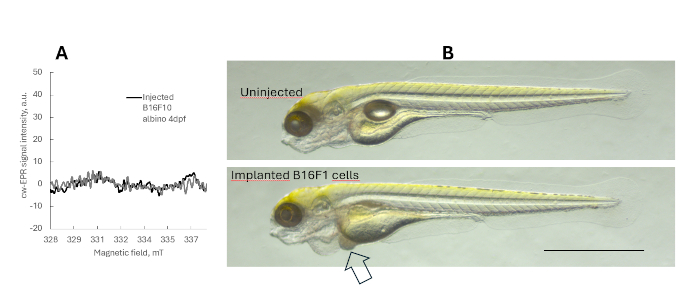
Figure 5: Evaluation of direct melanoma-derived melanin-associated radical detection in albino zebrafish B16F10 xenografts. (A) Melanin-associated electron paramagnetic resonance signal in 4df albino and albino B16F10 xenograft measurements measured with an X-band electron paramagnetic resonance spectrometer. Three biological replicates of 10 embryos each were used. (B) Bright-field image of 4 dpf albino and albino xenograft with B16F10 three days after cancer cell implantation. Please click here to view a larger version of this figure.
These results indicate that, under the current experimental conditions, the number of injected melanoma cells is below the direct detection threshold of X-band electron paramagnetic resonance. Therefore, the melanin-associated signal detected in whole-organism measurements primarily reflects global changes in the melanin redox status of the zebrafish embryo/larva, rather than a melanoma-specific signal originating exclusively from the xenograft.
In xenograft experiments, the efficiency of melanoma cell engraftment and growth was strongly dependent on the injection site. Injection into the circulation (bloodstream) resulted in more consistent tumor development and allowed reliable electron paramagnetic resonance signal detection associated with melanoma cells. In contrast, injection into the yolk sac led to impaired embryo development and poor tumor growth, resulting in weak or inconsistent signals. Therefore, bloodstream injection is recommended for obtaining robust and interpretable results (Figure 6).
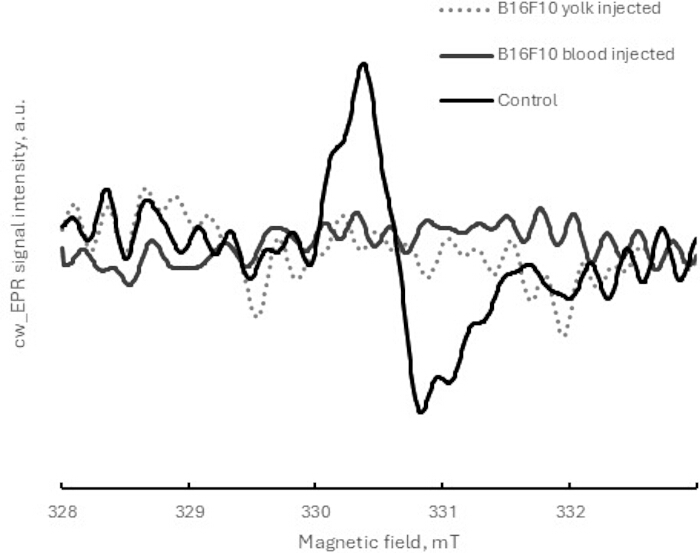
Figure 6: Effect of melanoma cell injection site on 2 dpf zebrafish embryo and xenograft development measured with X-band electron paramagnetic resonance. Representative electron paramagnetic resonance spectra from zebrafish embryos injected with B16F10 melanoma cells into the yolk sac or circulation. Please click here to view a larger version of this figure.
To further demonstrate the applicability of the method in melanoma models, we compared the electron paramagnetic resonance signal obtained from wild-type (WT) zebrafish embryos and WT embryos injected with B16F10 melanoma cells across different developmental time points.
In WT embryos, the electron paramagnetic resonance signal increased progressively with time, reflecting the natural accumulation of eumelanin during development. In contrast, embryos bearing B16F10 xenografts exhibited altered signal dynamics, with a modified electron paramagnetic resonance signal compared to WT at corresponding time points (Figure 7). These differences likely reflect tumor-induced modulation of host melanogenesis and systemic redox conditions, rather than direct detection of melanoma-derived melanin radicals alone. Since B16F10 cells produce mostly eumelanin, no pheomelanin signal was detected.
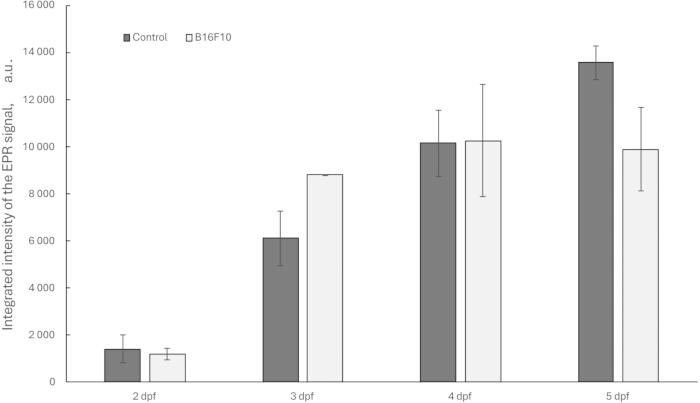
Figure 7: Representative comparison of whole-organism EPR signal dynamics in control WT and WT B16F10-bearing zebrafish embryos. Double-integrated X-band electron paramagnetic resonance signal obtained from control wild-type (WT) zebrafish and WT B16F10 xenografts embryos at 2, 3, 4, and 5 days post-fertilization (dpf). Signal intensity was normalized to the number of embryos per sample. Data represent mean ± SD of six independent biological replicates (for control) and three for B16F10 xenografts, each comprising 7–10 embryos. Please click here to view a larger version of this figure.
Overall, the successful implementation of this protocol is indicated by: (i) detection of a clear single-line electron paramagnetic resonance signal at g ≈ 2 in pigmented embryos, (ii) absence of signal in albino controls, (iii) increase in signal intensity with developmental stage, and (iv) reproducibility across biological replicates after normalization.
Discussion
This study presents a robust and sensitive protocol for in vivo detection of melanin-associated radicals in zebrafish embryos using X-band electron paramagnetic resonance spectroscopy. The method enables non-invasive, label-free monitoring of melanin-associated redox changes during physiological melanogenesis, melanoma xenograft development, and pharmacological intervention. By combining the high sensitivity of X-band electron paramagnetic resonance spectroscopy with the zebrafish xenograft platform, this approach extends the analytical capabilities of current zebrafish melanoma models beyond conventional morphological imaging toward direct biochemical characterization of redox-active melanin species. Unlike fluorescence-based imaging, which primarily provides structural and spatial information, electron paramagnetic resonance spectroscopy directly detects stable paramagnetic semiquinone radicals, providing complementary functional insight into melanin redox biology.
The presented workflow has broad applicability in pigmentation and melanoma research. Potential applications include evaluation of anti-melanoma therapies, investigation of drug-induced changes in redox balance, assessment of melanogenesis-modulating compounds such as depigmenting or UV-response agents, and analysis of tumor-host interactions in vivo. Furthermore, integration with fluorescence imaging and other phenotypic assays may provide a multimodal platform combining spatial, morphological, and biochemical information, thereby enhancing the predictive value of zebrafish models in preclinical research and therapeutic development.
Several experimental parameters are critical for obtaining reliable results. In xenograft experiments, injection into the circulation provided more consistent engraftment and reproducible electron paramagnetic resonance measurements than yolk sac injection, which is in agreement with previous studies29,30. The choice of incubation temperature plays an important role. While zebrafish xenografts might typically be maintained at 32 °C to favor mammalian cell kinetics31, the murine B16F10 melanoma lines employed in this study appear sufficiently aggressive to demonstrate robust proliferative and migratory capacities at 28 °C. Because a 32 °C environment could significantly accelerate zebrafish development—potentially leading to independent feeding behavior before the fifth day post-fertilization—maintaining the larvae at 28 °C would ensure the organisms remain within non-protected developmental stages32. Consequently, this temperature choice could allow for the successful observation of tumor progression and metastasis while remaining compliant with animal welfare regulations that protect larvae once they reach the independent feeding stage. Another critical point is that accurate normalization to embryo number and consistent developmental staging are essential for minimizing biological variability. Weak or inconsistent signals may result from insufficient pigmentation, low tumor burden, suboptimal sample positioning within the resonator, or incomplete capillary filling. In such cases, increasing the number of embryos per sample, optimizing transplantation efficiency, and verifying sample placement within the active resonator volume may improve signal detection. Higher numbers of embryos are required for in vivo measurements in a flat capillary due to dielectric losses and reduced filling factor associated with whole-organism measurements in aqueous biological samples. Still this method could be used with standard capillaries ex vivo. These findings demonstrate that the protocol is compatible with commonly available X-band electron paramagnetic resonance spectroscopy configurations and supports delayed ex vivo analysis, increasing accessibility and reproducibility across laboratories using different instrumentation.
Despite its advantages, the method has several limitations. An important biological consideration is that the detected electron paramagnetic resonance signal reflects the redox-active fraction of the melanin polymer rather than total pigment content alone15,21,33. Accordingly, changes in electron paramagnetic resonance signal intensity should be interpreted as changes in melanin-associated redox equilibrium rather than as a direct surrogate of melanin abundance. The albino xenograft experiments further demonstrated that, under the current experimental conditions, the number of injected melanoma cells remained below the direct detection threshold of X-band electron paramagnetic resonance spectroscopy. Therefore, the whole-organism signal detected in xenograft-bearing larvae primarily reflects global changes in host melanin-associated redox status induced by tumor–host interactions rather than melanoma-specific signal originating exclusively from the xenograft. Importantly, the zebrafish microenvironment introduces dynamic oxygen gradients, metabolic interactions, and oxidative stress conditions that may additionally modulate melanin radical populations in vivo19,20. In xenograft applications, the method is currently limited to highly pigmented melanoma models, as sufficient melanin concentration is required for reliable signal detection. Amelanotic or weakly pigmented tumors may not produce detectable signals27. Additionally, the melanoma cell lines used in this study (B16F10) predominantly produce eumelanin, resulting in a single electron paramagnetic resonance line. In models with significant pheomelanin contribution, spectral overlap may occur13. In such cases, advanced spectral simulation and deconvolution would be required to distinguish between eumelanin and pheomelanin signals.
Nevertheless, the presented workflow offers broad potential for studying melanoma biology, drug-induced modulation of melanogenesis, oxidative stress, and tumor-host interactions in vivo. Integration of electron paramagnetic resonance spectroscopy with fluorescence imaging, genetic reporters, and other phenotypic assays may further enhance the predictive value of zebrafish models in preclinical melanoma research and therapeutic development.
Disclosures
Author Mikołaj Baranowski is employed by Novilet, which manufactures components of the spectrometer used in this study (multiharmonic analyzer). The remaining authors declare no competing interests.
Acknowledgements
The "A new capillary and a method for determining the melanin radical for use in preclinical studies of potential drugs for melanoma in the Danio rerio embryo model" FENG.02.07-IP.05-0059/23 project was carried out within the FENG POC program of the Foundation for Polish Science, cofinanced by the European Union under the European Funds for Smart Economy 2021–2027 (FENG). This research was supported by the European Union under the Smart Growth Operation Program (project number POIR.01.02.00-00-0077/18).
Materials
| Name | Company | Catalog Number | Comments |
|---|---|---|---|
| 1.5 mL or 0.5 mL eppendorf tubes | Eppendorf | 0030120086, 0030121023 | For transferring zebrafish larvae to capillary |
| 3 mL disposable Pasteur pipettes | Medlab Products | 76-1303-2 | For sorting and transferring embryos and larvae |
| Benchtop X-band EPR spectrometer MiniScope MS200 | Magnettech | Bruker.com | EPR spectra registration |
| Calcium chloride, dihydrate | Chempur | 363-118748706 | To prepare E3 medium |
| Cell counting slides (e.g., EVE or EVE PLUS) | Nanoentek Inc | NC2200445 | For cell counter |
| CellTracker Green | Thermo Fisher | C2925 | Fluorescent cell tracker dye, for cell labeling |
| CM-DiI | Thermo Fisher | C7000 | Fluorescent cell tracker dye, for cell labeling |
| CO2 incubator ICO240med | Memmert | N/A | For cell maintaining, set to 37°C, 5% CO2, ≥95% humidity |
| Countess II Automated Cell Counter | Invitrogen | AMQAX1000 | To count cells and cell density |
| Cryogenic storage boxes CryoKING | Biologix | BGX-ID81 | For storage of zebrafish with xenografts |
| Cryopreservation medium CM-1 | Cytion | #800150 | To freeze cancr cells |
| Dulbecco's Modified Eagle Medium (DMEM), high glucose, glutamine, without sodium pyruvate | Gibco | #11965-092 | for cell culture maintaining |
| E3 medium | In house | N/A | For zebrafish embryos/larvae keeping, prepared according to Cold Spring Harb Protoc 2011, doi: 10.1101/pdb.rec066449 |
| Egg incubator | Incubato | 10130024 | For the incubation of zebrafish embryo/larvae, set to 28–32°C |
| eSpect+ software | Novilet | https://novilet.eu/products/espect/ | For multiharmonic analyser |
| Fetal Bovine Serum (FBS) | Gibco | A5256701 | Supplement for DMEM |
| Fine forceps, ceramic coated, Dumont #5, 11 cm | Dumont SA | 11252-50 | For zebrafish embryos dechorionation |
| Flat glass capillaries designed for zebrafish (Application No.: 21 736) | N/A | N/A | For EPR measurements of zebrafish embryos |
| Glass capillary needles | Harvard Apparatus | GB100-10 | Filament-free, for microinjections |
| Hematocrit capillaries (BRAND disposable BLAUBRAND micropipettes), volume 50 and 100 μL | BRAND | 41121500 | For EPR measurements or for transferring zebrafish larvae into flat capillary |
| Magnesium chloride, hexahydrate | Chempur | 363-116120500 | To prepare E3 medium |
| Microinjection system with micromanipulator FemtoJet | Eppendorf | EPE5252000021 | To load cells into microneedles |
| Microloader tips for needle loading | Eppendorf | #5242956003 | For microinjection system |
| Mouse melanoma cell line B16-F1 | Cytion | CLS-400122 | For xenografts |
| Mouse melanoma cell line B16-F10 | Cytion | 305157 | For xenografts |
| Multiharmonic analyser eSpect+ | Novilet | https://novilet.eu/products/espect/ | For EPR spectrometer, to increase sensitivity |
| Penicillin-Streptomycin solution | Sigma | P0781-50ml | Optional, supplement for DMEM for cell culture |
| Petri dish, 55 mm | Medlab Products | 51-0056-0A-NX | For incubation of zebrafish eggs, embryos and larvae |
| Phosphate Buffered Saline (PBS), calcium and magnesium free | Sigma | D8537-500ml | For rinsing cells |
| Potassium chloride | Chempur | 363-117397402 | To prepare E3 medium |
| Sealing kit for hematocrit capillaries - Critoseal | Noxygen | NOX-A.3-VPC | For EPR measurements of zebrafish embryos |
| Sodium chloride | Chempur | 363-117941206 | To prepare E3 medium |
| Static Storage Liquid Nitrogen Container | Biobase | YDS-47-127-FS | For banking cell culturs |
| Stereomicroscope | Optatech | SK Series | For zebrafish embryos development assesssment |
| Sterile 15 mL Falcon tubes | SPL Life Sciences | S50015 | For cell harvesting (centrifuging) |
| Sterile 90 nm Petri dishes | Googlab Scientific | GP508 | For cell cutures |
| Sterile cryovials: CryoPure Tube 1.0 mL | Sarstedt | 72.377 | To freeze cells |
| Tissue culture sterile Pasteur pipettes (Corning Falcon Serological Pipettes), volume 5, 10, 25 mL | Corning | 357543, 356551, 356535 | For cell cutures |
| Tricaine (MS-222) | Sigma | 886-86-2 | Freshly prepared 4 g/L solution, for zebrafish anesthesia and euthanasia |
| TrypLE Express (1×) or Trypsin-EDTA (0.05%) | Gibco | #12605-010 | For cell detaching during passaging |
| Water bath Precision GP 05 | Thermo Scientific | N/A | Set to 37 °C, for warming cell medium |
| Zebrafish embryos | ZIRC | https://zebrafish.org/documents/fees.php | 1 day post-fertilization, preferably pigment-free strains (e.g., albino) |
References
- Karkoszka, M., Rok, J., Wrześniok, D. Melanin biopolymers in pharmacology and medicine–skin pigmentation disorders, implications for drug action, adverse effects and therapy. Pharmaceuticals. 17 (4), 521(2024).
- Song, W., et al. Melanin: Insights into structure, analysis, and biological activities for future development. J Mater Chem B. 11 (32), 7528-7543 (2023).
- Terranova, M. L. Physiological roles of eumelanin- and melanogenesis-associated diseases: A look at the potentialities of engineered and microbial eumelanin in clinical practice. Bioengineering. 11 (8), 756(2024).
- Mostert, A. B. Melanin, the what, the why and the how: An introductory review for materials scientists interested in flexible and versatile polymers. Polymers. 13 (10), 1670(2021).
- Mostert, A. B. On the free radical redox chemistry of 5,6-dihydroxyindole. Chem Phys. 546, 111158(2021).
- Sealy, R. C. Radicals in melanin biochemistry. Methods Enzymol. 105, 479-483 (1984).
- Seagle, B. -L. L., et al. Time-Resolved Detection of Melanin Free Radicals Quenching Reactive Oxygen Species. J Am Chem Soc. 127 (32), 11220-11221 (2005).
- Qin, W., et al. Evidence for the generation of reactive oxygen species from hydroquinone and benzoquinone: Roles in arsenite oxidation. Chemosphere. 150, 71-78 (2016).
- Slominski, R. M., et al. Melanoma, melanin, and melanogenesis: The yin and yang relationship. Front Oncol. 12, 842496(2022).
- Becker, A. L., Indra, A. K. Oxidative stress in melanoma: Beneficial antioxidant and pro-oxidant therapeutic strategies. Cancers (Basel). 15 (11), 3038(2023).
- Cassar, S., et al. Use of zebrafish in drug discovery toxicology. Chem Res Toxicol. 33 (1), 95-118 (2020).
- Horzmann, K. A., Freeman, J. L. Making waves: New developments in toxicology with the zebrafish. Toxicol Sci. 163 (1), 5-12 (2018).
- Van Rooijen, E., Fazio, M., Zon, L. I. From fish bowl to bedside: The power of zebrafish to unravel melanoma pathogenesis and discover new therapeutics. Pigment Cell Melanoma Res. 30 (4), 402-412 (2017).
- Tao, J., et al. Apoptosis-sensing xenograft zebrafish tumor model for anticancer evaluation of redox-responsive cross-linked pluronic micelles. ACS Appl Mater Interfaces. 14 (35), 39775-39786 (2022).
- Hason, M., Bartůněk, P. Zebrafish models of cancer–new insights on modeling human cancer in a non-mammalian vertebrate. Genes (Basel). 10 (11), 935(2019).
- Hamre, K., et al. Systemic and strict regulation of the glutathione redox state in mitochondria and cytosol is needed for zebrafish ontogeny. Biochim Biophys Acta Gen Subj. 1868 (6), 130603(2024).
- Gauron, G., et al. Hydrogen peroxide (H2O2) controls axon pathfinding during zebrafish development. Dev Biol. 414 (2), 133-141 (2016).
- Cesareo, E., et al. An endogenous electron spin resonance (ESR) signal discriminates nevi from melanomas in human specimens: A step forward in its diagnostic application. PLoS One. 7 (11), e48849(2012).
- Nakagawa, K., Minakawa, S., Sawamura, D., Hara, H. Characterization of melanin radicals in paraffin-embedded malignant melanoma and nevus pigmentosus using X-band EPR and EPR imaging. Anal Sci. 33 (12), 1357-1361 (2017).
- Mignion, L., et al. Noninvasive detection of the endogenous free radical melanin in human skin melanomas using electron paramagnetic resonance (EPR). Free Radic Biol Med. 190, 226-233 (2022).
- Wehbi, M., Mignion, L., Joudiou, N., Harkemanne, E., Gallez, B. Highly sensitive detection of melanin in melanomas using multi-harmonic low frequency EPR. Mol Imaging Biol. 26 (3), 484-494 (2024).
- Chlewicki, W., Baranowski, M., Czechowski, T., Szczepanik, P. Performance of image reconstrucion algorithms in electron paramagnetic resonance tomography with multiharmonic analysis. 2017 IEEE 37th International Conference on Electronics and Nanotechnology (ELNANO), , 292-295 (2017).
- Beaumont, K. A., Mohana-Kumaran, N., Haass, N. K. Modeling melanoma in vitro and in vivo. Healthcare (Basel). 2 (1), 27-46 (2014).
- Marconi, A., Quadri, M., Saltari, A., Pincelli, C. Progress in melanoma modelling in vitro. Exp Dermatol. 27 (5), 578-586 (2018).
- Yin, J., et al. Zebrafish patient-derived xenograft model as a preclinical platform for uveal melanoma drug discovery. Pharmaceuticals. 16 (4), 598(2023).
- Fazio, M., Ablain, J., Chuan, Y., Langenau, D. M., Zon, L. I. Zebrafish patient avatars in cancer biology and precision cancer therapy. Nat Rev Cancer. 20 (5), 263-273 (2020).
- The Zebrafish Information Network (ZFIN) Community. Tricaine. , ZFIN. Available from: https://zfin.atlassian.net/wiki/spaces/prot/pages/362220023/TRICAINE (2026).
- Martinez-Lopez, M., Póvoa, V., Fior, R. Generation of zebrafish larval xenografts and tumor behavior analysis. J Vis Exp. (172), e62373(2021).
- Vargas-Patron, L. A., et al. Xenotransplantation of human glioblastoma in zebrafish larvae: In vivo imaging and proliferation assessment. Biol Open. 8 (5), bio043257(2019).
- Schueler, J., et al. Impact of the injection site on growth characteristics, phenotype and sensitivity towards cytarabine of twenty acute leukaemia patient-derived xenograft models. Cancers (Basel). 12 (5), 1349(2020).
- Cabezas-Sáinz, P., Pensado-López, A., Sáinz, B. Jr, Sánchez, L. Modeling cancer using zebrafish xenografts: Drawbacks for mimicking the human microenvironment. Cells. 9 (9), 1978(2020).
- Miller, A., et al. Temperature-dependence of early development of zebrafish and the consequences for laboratory use and animal welfare. PLoS One. 20 (12), e0340193(2025).
- Godechal, Q., Ghanem, G. E., Cook, M. G., Gallez, B. Electron paramagnetic resonance spectrometry and imaging in melanomas: Comparison between pigmented and nonpigmented human malignant melanomas. Mol Imaging. 12 (4), 218-223 (2013).
Reprints and Permissions
This article has been published
Video Coming Soon