This retrospective study identified immune dysfunction and extrapulmonary complications as independent predictors of poor prognosis in children with severe Mycoplasma pneumoniae pneumonia. Serum IgA, IgG, IgM, and C-reactive protein (CRP) showed exploratory prognostic value, although prospective studies are needed to validate their clinical applicability.
Research Article
Exploratory Analysis of Factors Associated with Poor Prognosis in Children with Severe Mycoplasma pneumoniae Pneumonia
In This Article
Summary
Abstract
Severe Mycoplasma pneumoniae pneumonia (MPP) in children is associated with immune dysregulation and unfavorable outcomes; however, the clinical significance of routinely measured immune and inflammatory markers remains uncertain. This retrospective exploratory study evaluated factors associated with poor prognosis and the individual discriminatory performance of immunoglobulin A (IgA), immunoglobulin G (IgG), immunoglobulin M (IgM), and C-reactive protein (CRP). A total of 172 children with MPP treated between April 2018 and April 2021, and 40 healthy controls were included. Biomarker levels were compared across disease severity and prognostic groups. Individual receiver operating characteristic (ROC) curve analyses and exploratory logistic regression were performed. Serum IgA, IgG, and IgM levels were significantly lower, whereas CRP levels were significantly higher, in children with severe disease and in those with poor prognosis than in the corresponding comparison groups (P < 0.05). The areas under the ROC curve (AUCs) for IgA, IgG, IgM, and CRP were 0.788, 0.707, 0.696, and 0.796, respectively. Fever duration, lesion type, immune dysfunction, elevated CRP, and extrapulmonary complications differed significantly between the prognostic groups. Exploratory multivariable analysis identified immune dysfunction and extrapulmonary complications as independent factors associated with poor prognosis. These findings support further investigation of immune and inflammatory biomarkers for risk stratification in children with severe MPP; however, prospective studies are needed to validate their clinical utility, and the present results should not be interpreted as a validated clinical prediction model.
Introduction
Severe pneumonia remains a major cause of morbidity in children and results from complex interactions among the infecting pathogen, host immune responses, and the inflammatory cascade1,2,3. Mycoplasma pneumoniae (MP) is a common cause of community-acquired pneumonia in children, and M. pneumoniae pneumonia (MPP) accounts for a substantial proportion of pediatric pneumonia cases4. Although most children recover with appropriate treatment, some develop severe or refractory disease characterized by persistent fever, progressive pulmonary lesions, extrapulmonary complications, and other unfavorable outcomes5,6,7,8. Early identification of children at increased risk of poor outcomes is therefore of considerable clinical importance.
Previous studies have investigated inflammatory biomarkers, imaging findings, and clinical characteristics associated with MPP severity and prognosis; however, the reported prognostic value of immune indices has been inconsistent9. Rather than developing a clinical prediction model, the present study provides a stratified comparison of routinely measured immunoglobulin A (IgA), immunoglobulin G (IgG), immunoglobulin M (IgM), and C-reactive protein (CRP) levels across healthy controls, children with mild-to-moderate MPP, children with severe MPP, and prognostic groups. In addition, an exploratory analysis of factors associated with poor prognosis in children with severe MPP was performed. The primary objective was to determine whether these routinely measured biomarkers and clinical characteristics were associated with poor prognosis. It was hypothesized that lower immunoglobulin levels, higher CRP, immune dysfunction, and extrapulmonary complications would be associated with unfavorable outcomes.
Protocol
This retrospective study was conducted in accordance with institutional requirements and the Declaration of Helsinki and was approved by the Ethics Committee of Nanjing Tongren Hospital Affiliated to Southeast University Medical School (approval no. 2024-03-039-K001). The requirement for individual informed consent was waived due to the retrospective design and the use of anonymized data.
Clinical data
A total of 172 children with MPP treated between April 2018 and April 2021 were included as the case group, together with 40 healthy children as controls. The case group comprised 103 boys and 69 girls, with a mean age of 7.15 ± 2.97 years; the control group comprised 24 boys and 16 girls, with a mean age of 7.02 ± 2.31 years. Baseline age and sex did not differ significantly between the groups (P > 0.05). According to the criteria described10, MPP was classified as severe when at least two of the following were present: evident dyspnea, heart rate >120 beats/min, fever lasting >10 days, multilobar involvement, or large-area pulmonary infiltration. The remaining cases were classified as mild-to-moderate MPP.
Inclusion criteria
All children with MPP met the clinical diagnostic criteria for MPP11. Diagnosis was supported by an MP antibody titer >1:160, a positive MP DNA test, or a fourfold or greater increase in serum MP-specific IgG between the acute and recovery phases. Clinical manifestations included cough, shortness of breath, tachycardia, cyanosis, or dyspnea, and chest imaging showed unilateral or bilateral pulmonary lesions. Eligible participants were 8 months to 10 years of age.
Children were excluded if they had confirmed viral, bacterial, or fungal pneumonia; severe dysfunction of major organs, including the heart, brain, liver, or kidneys; another pulmonary disease; a malignant tumor; congenital immune dysfunction; or insufficient clinical information for the required analyses.
Children in the control group were 8 months to 10 years of age, were in good health, and had normal findings on physical examination. The control group was used only for biomarker comparisons and did not contribute to the prognostic or regression analyses.
Data collection
The hospital information system was reviewed for age, sex, fever duration, lesion type and location, immune function status, CRP level, extrapulmonary complications, treatment information, and follow-up outcomes. Immune dysfunction was determined from the contemporaneous medical record prior to outcome assessment, based on immunoglobulin values that fell below the hospital laboratory's age-specific reference intervals. Data were initially extracted by Boling Han and cross-checked against the original medical records by Rui Wang. Any discrepancies were resolved through discussion between the two investigators. Data completeness was verified before analysis. The complete variable definitions, coding rules, and de-identified cohort dataset are provided in Supplementary File 1.
Measurement of immune function indicators and inflammatory markers
Within 24 hours after enrollment, 4 mL of fasting venous blood was collected from each participant. Samples were centrifuged at 1,500 × g for 10 min at 4°C, and the resulting serum was stored in accordance with the institutional laboratory protocol until analysis. Serum IgA, IgG, and IgM concentrations were measured by immunoturbidimetry, and CRP was measured by enzyme-linked immunosorbent assay. Specifically, serum samples were stored at –80 °C for no longer than 3 months before analysis, and repeated freeze-thaw cycles were avoided.
Treatment protocol
Treatment was individualized according to clinical severity and the applicable institutional practice. Conventional management included anti-infective therapy and supportive care, including oxygen therapy, nebulized inhalation, fluid administration and maintenance of water and electrolyte balance, antipyretic treatment, and other symptomatic measures as clinically indicated. Children with severe MPP were treated with azithromycin, and methylprednisolone was used as adjunctive anti-inflammatory treatment when clinically indicated. Although all patients were managed according to the same institutional principles, the specific supportive measures were individualized rather than strictly standardized. Because of the retrospective design, exact treatment timing and regimen details were not uniformly available for all participants.
Prognosis follow-up
Children with severe MPP were followed monthly through outpatient visits and telephone contact until April 2022. Prognosis was classified as good when body temperature normalized, respiratory symptoms improved, and pulmonary lesions were absorbed or resolved. Poor prognosis was defined as a composite outcome comprising persistent fever, worsening cough or dyspnea, absent radiographic improvement or radiographic deterioration, transfer to another hospital, or death12. The components could overlap and were not analyzed as mutually exclusive outcomes. All 114 children with severe MPP completed follow-up, and no participants were lost to follow-up.
Statistical analysis
Analyses were performed using IBM SPSS Statistics version 22.0. Continuous variables were summarized as mean ± standard deviation. Two-group comparisons used the independent-samples t test, and comparisons among more than two groups used one-way analysis of variance. Categorical variables were summarized as n (%) and compared using the chi-square test. ROC curves were used to evaluate IgA, IgG, IgM, and CRP individually, with AUCs, 95% confidence intervals, cutoff values, sensitivity, and specificity reported. The four biomarkers were not combined into a multivariable prediction model. Variables associated with prognosis in univariable analyses were entered into an exploratory stepwise binary logistic regression. Regression results were reported as beta coefficients, standard errors, Wald statistics, odds ratios (ORs), 95% confidence intervals, and P values. Because of the limited number of poor-prognosis events, the regression was interpreted as an exploratory association analysis rather than a validated prediction model. A two-sided P < 0.05 was considered statistically significant. The normality of continuous variables was assessed using the Shapiro-Wilk test, and homogeneity of variance was evaluated using Levene's test. There were no missing values in the variables included in the analyses; therefore, no imputation was performed, and complete-case analyses were used.
Results
Comparison of immune and inflammatory markers among groups
IgA, IgG, and IgM levels were lower in the severe group than in the mild-to-moderate group and were lower in the mild-to-moderate group than in the control group. CRP showed the opposite pattern. Pairwise differences were statistically significant (P < 0.05; Table 1).
Comparison of immune and inflammatory markers between prognostic groups
Among children with severe MPP, IgA, IgG, and IgM levels were lower, and CRP levels were higher in the poor-prognosis group than in the good-prognosis group (all P < 0.05; Table 2).
Discriminative ability of individual immune and inflammatory markers
The AUCs for IgA, IgG, IgM, and CRP were 0.788 (95% CI, 0.659–0.885), 0.707 (95% CI, 0.571–0.820), 0.696 (95% CI, 0.560–0.811), and 0.796 (95% CI, 0.668–0.891), respectively. The corresponding cutoff values were 1.10 g/L, 8.35 g/L, 1.21 g/L, and 51.05 mg/L. Sensitivity and specificity are presented in Table 3. These individual ROC analyses were exploratory. The corresponding ROC curves are shown in Figure 1.
Univariate analysis of factors associated with prognosis
Fever duration, lesion type, immune dysfunction, CRP >51.05 mg/L, and extrapulmonary complications differed significantly between the good- and poor-prognosis groups (all P < 0.05). Age, sex, and lesion location did not differ significantly between the groups (all P > 0.05; Table 4).
Multivariate logistic regression analysis of prognostic factors
Poor prognosis was entered as the dependent variable. Fever duration, lesion type, immune dysfunction, CRP >51.05 mg/L, and extrapulmonary complications were entered as candidate independent variables. Lesion type was coded as 1 for a large patchy shadow and 0 for a patchy or flocculent shadow; immune dysfunction and extrapulmonary complications were coded as 1 when present and 0 when absent; and CRP was coded as 1 for >51.05 mg/L and 0 for ≤51.05 mg/L. Immune dysfunction (OR, 2.061; 95% CI, 1.518–2.798; P < 0.001) and extrapulmonary complications (OR, 1.732; 95% CI, 1.374–2.182; P < 0.001) remained independently associated with poor prognosis in the exploratory multivariable analysis (Table 5).
DATA AVAILABILITY:
The de-identified raw data underlying this study are publicly available in Figshare at https://doi.org/10.6084/m9.figshare.33155195.
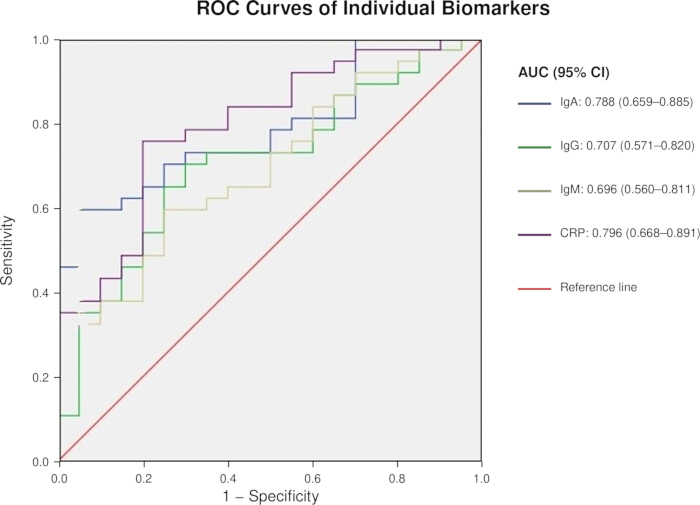
Figure 1: Receiver operating characteristic (ROC) curves of individual biomarkers for predicting poor prognosis in children with severe Mycoplasma pneumoniae pneumonia. ROC curves were generated separately for serum immunoglobulin A (IgA), immunoglobulin G (IgG), immunoglobulin M (IgM), and C-reactive protein (CRP). The y-axis represents sensitivity, and the x-axis represents 1 − specificity. The diagonal line indicates the reference line (AUC = 0.5). Areas under the curve (AUCs) with 95% confidence intervals are shown in the figure. The ROC analyses were performed as exploratory assessments of each biomarker's discriminative ability. Please click here to view a larger version of this figure.
| Group | Number of cases | IgA (g/L) | IgG (g/L) | IgM (g/L) | CRP (mg/L) |
| Severe group | 114 | 0.95 ± 0.31 b | 8.45 ± 1.06 b | 1.24 ± 0.55 b | 49.92 ± 6.25 b |
| Mild to moderate group | 58 | 1.28 ± 0.40 a | 8.97 ± 1.23 a | 1.53 ± 0.63 a | 30.37 ± 6.10 a |
| Control group | 40 | 2.63 ± 0.36 ab | 10.82 ± 1.38 ab | 2.41 ± 0.69 ab | 9.80 ± 4.49 ab |
| F | 350.852 | 60.599 | 56.208 | 730.412 | |
| P | < 0.001 | < 0.001 | < 0.001 | < 0.001 |
Table 1: Comparison of serum immunoglobulin and C-reactive protein levels among the severe Mycoplasma pneumoniae pneumonia (MPP), mild-to-moderate MPP, and healthy control groups. Values are presented as mean ± standard deviation (SD). One-way analysis of variance was used for group comparisons. aP < 0.05 versus the severe MPP group; bP < 0.05 versus the mild-to-moderate MPP group.
| Group | Number of cases | IgA (g/L) | IgG (g/L) | IgM (g/L) | CRP (mg/L) |
| Good prognosis | 75 | 1.12 ± 0.36 | 8.76 ± 1.12 | 1.35 ± 0.62 | 41.89 ± 5.20 |
| Poor prognosis | 39 | 0.63 ± 0.22 | 7.85 ± 0.94 | 1.03 ± 0.42 | 65.36 ± 8.27 |
| t | 7.77 | 4.339 | 2.893 | 18.551 | |
| P | < 0.001 | < 0.001 | 0.005 | < 0.001 |
Table 2: Comparison of serum immunoglobulin and C-reactive protein levels between children with good and poor prognosis among those with severe Mycoplasma pneumoniae pneumonia. Values are presented as mean ± SD. Comparisons were performed using the independent-samples t-test.
| Index | Critical value | AUC | Sensitivity | Specificity | 95 % CI | P |
| IgA (g/L) | 1.10 | 0.788 | 59.5 | 95 | 0.659–0.885 | < 0.001 |
| IgG (g/L) | 8.35 | 0.707 | 70.2 | 70 | 0.571–0.820 | 0.001 |
| IgM (g/L) | 1.21 | 0.696 | 59.5 | 75 | 0.560–0.811 | 0.006 |
| CRP (mg/L) | 51.05 | 0.796 | 75.7 | 80 | 0.668–0.891 | < 0.001 |
| Joint testing | 0.920 | 91.8 | 80 | 0.817–0.975 | < 0.001 |
Table 3: Receiver operating characteristic (ROC) analysis of individual biomarkers for predicting poor prognosis in children with severe Mycoplasma pneumoniae pneumonia. The table summarizes the optimal cutoff values, area under the curve (AUC), sensitivity, specificity, 95% confidence intervals (CIs), and P-values for IgA, IgG, IgM, and CRP.
| Clinical information | Good prognosis (n = 75) | Poor prognosis (n = 39) | χ 2 / t | P | |
| gender | male | 42 (56.00) | 24 (61.54) | 0.323 | 0.570 |
| female | 33 (44.00) | 15 (38.46) | |||
| age) | 7.34 ± 2.36 | 6.96 ± 2.82 | 0.762 | 0.448 | |
| Thermal range (d) | 4.63 ± 1.22 | 7.85 ± 2.34 | 9.676 | < 0.001 | |
| Lesion type | Spotty, flocculent shadows | 52 (69.33) | 10 (25.64) | 19.745 | < 0.001 |
| Large patchy shadows | 23 (30.67) | 29 (74.36) | |||
| Lesion | Left upper lobe | 14 (18.67) | 8 (20.51) | 1.056 | 0.788 |
| Left lower lobe | 23 (30.67) | 14 (35.90) | |||
| Right upper lobe | 16 (21.33) | 9 (23.08) | |||
| Right lower lobe | 22 (29.33) | 8 (20.51) | |||
| Immune dysfunction | yes | 15 (20.00) | 32 (82.05) | 40.772 | < 0.001 |
| no | 60 (80.00) | 7 (17.95) | |||
| C RP | > 51.05 mg /L | 14 (18.67) | 26 (66.67) | 25.955 | < 0.001 |
| < 51.05 mg /L | 61 (81.33) | 13 (33.33) | |||
| Extrapulmonary complications | have | 12 (16.00) | 28 (71.79) | 35.069 | < 0.001 |
| none | 63 (84.00) | 11 (28.21) | |||
Table 4: Univariate analysis of clinical characteristics associated with prognosis in children with severe Mycoplasma pneumoniae pneumonia. Continuous variables are presented as mean ± SD, and categorical variables are presented as n (%). Group comparisons were performed using the independent-samples t-test or the chi-square (χ2) test, as appropriate.
| Risk factors | Beta value | SE value | w ald 2 | 95 % CI | OR | P |
| Immune dysfunction | 0.723 | 0.156 | 21.48 | 1.518–2.798 | 2.061 | < 0.001 |
| Extrapulmonary complications | 0.549 | 0.118 | 21.646 | 1.374–2.182 | 1.732 | < 0.001 |
Table 5: Exploratory multivariable logistic regression analysis of factors associated with poor prognosis in children with severe Mycoplasma pneumoniae pneumonia. Regression results are presented as regression coefficients (β), standard errors (SE), Wald χ2 statistics, odds ratios (ORs), 95% confidence intervals (CIs), and P values. Immune dysfunction and extrapulmonary complications remained independently associated with poor prognosis in the exploratory multivariable analysis.
Supplementary File 1: Cohort dataset and variable dictionary. This supplementary file contains the de-identified study dataset (Cohort_Data) and the accompanying variable dictionary, including variable definitions, coding rules, data types, and availability for all study variables used in the analyses.Please click here to download this file.
Discussion
The present retrospective study examined routinely available immune and inflammatory markers, as well as clinical factors, associated with poor prognosis in children with severe MPP. The principal contribution is not a new validated prediction tool, but a stratified description of IgA, IgG, IgM, and CRP across severity and prognostic groups, together with an exploratory assessment of clinical factors associated with unfavorable outcomes. This positioning is important because similar biomarkers have been investigated previously, and their clinical utility remains dependent on prospective validation13,14,15.
IgA, IgG, and IgM levels decreased, and CRP increased with greater disease severity, and the same pattern was observed when the poor-prognosis group was compared with the good-prognosis group. These findings are consistent with evidence that MPP severity is related to both host immune responses and systemic inflammation16. CRP reflects the acute inflammatory response and has been associated with disease burden in pediatric pneumonia17,18,19. However, CRP and other inflammatory markers are not pathogen-specific and may have limited ability to distinguish infections with similar clinical presentations. Accordingly, the individual ROC results in this study should be interpreted as exploratory discrimination within this cohort rather than as evidence of diagnostic specificity or immediate clinical applicability.
The individual AUCs ranged from 0.696 to 0.796, suggesting modest-to-moderate discrimination. Fever duration, lesion type, immune dysfunction, elevated CRP, and extrapulmonary complications differed between prognostic groups, whereas immune dysfunction and extrapulmonary complications remained associated with poor prognosis in the exploratory multivariable analysis. Previous studies have similarly linked persistent fever, extensive radiographic abnormalities, and extrapulmonary involvement with refractory or severe MPP20,21,22. CRP was significant in the univariable analysis but was not retained in the multivariable analysis. This difference may reflect a correlation between CRP and other indicators of disease severity, limited statistical power, dichotomization at 51.05 mg/L, or cohort-specific variation. Other studies have reported CRP as an independent factor, emphasizing that its prognostic role remains uncertain23.
This study has several limitations. It was retrospective and conducted at a single center, the number of poor-prognosis events was limited, and the exploratory regression was not internally or externally validated. Treatment timing, macrolide resistance, corticosteroid timing, disease duration before admission, coinfections, and baseline comorbidities were not consistently available and could not be included as covariates, leaving the possibility of residual confounding. The composite poor-prognosis outcome included heterogeneous and potentially overlapping components, and follow-up duration may have varied among participants. Therefore, the findings establish associations rather than causality and should not be used as a stand-alone clinical decision rule.
In conclusion, lower immunoglobulin levels, higher CRP, immune dysfunction, and extrapulmonary complications were associated with unfavorable outcomes in this cohort. These findings are exploratory and should not be implemented clinically until they have been validated in larger prospective multicenter studies using standardized outcomes.
Disclosures
The authors declare that they have no competing interests related to this study. No financial or non-financial conflicts exist, including employment, consultancies, stock ownership, honoraria, or paid expert testimony.
Acknowledgements
Not applicable. This study received no specific funding.
Materials
| Name | Company | Catalog Number | Comments |
|---|---|---|---|
| Clinical chemistry/immunoturbidimetric analyzer | Siemens Healthineers | BN II | Instrument used for IgA, IgG, and IgM testing |
| C-reactive protein ELISA kit | Thermo Fisher Scientific / Invitrogen | BMS288INST | Routine clinical laboratory measurement of serum CRP |
| IBM SPSS Statistics | IBM Corp. | Version 22.0 | Statistical analysis |
| IgA immunoturbidimetric assay/reagent | Siemens Healthineers | NA | Routine clinical laboratory measurement of serum IgA |
| IgG immunoturbidimetric assay/reagent | Siemens Healthineers | NA | Routine clinical laboratory measurement of serum IgG |
| IgM immunoturbidimetric assay/reagent | Siemens Healthineers | NA | Routine clinical laboratory measurement of serum IgM |
| Microplate reader | Thermo Fisher Scientific | Multiskan FC | Instrument used for ELISA measurement |
| Microsoft Excel | Microsoft Corporation | Version 2024 | Data organization and table preparation |
| Microsoft Word | Microsoft Corporation | Version 2024 | Manuscript preparation |
References
- Charatdao B, et al. Etiology and clinical characteristics of severe pneumonia among young children in Thailand: Pneumonia Etiology Research for Child Health (PERCH) case-control study findings, 2012-2013. Pediatr Infect Dis J. 2021;40(9):S91-S100.
- Meng F, et al. Correlations between serum P2X7, vitamin A, 25-hydroxyvitamin D, and Mycoplasma pneumoniae pneumonia. J Clin Lab Anal. 2021;35(5):e23760.
- Yang H, et al. Circulating microbial cell-free DNA is associated with inflammatory host responses in severe pneumonia. Thorax. 2021;76(12):1231-1235.
- Min SS, et al. Analysis of risk factors and establishment of a risk assessment model for refractory Mycoplasma pneumonia in children. J Clin Mil Med. 2022;50(1):46-50.
- Xue B, Kang T, Xie M. Analysis of serum FKN and p53 expression levels and their correlation with prognosis in patients with severe Mycoplasma pneumonia. Labeled Immunoassay Clin. 2021;28(11):1851-1855.
- Wang CJ, et al. Clinical and prognostic analysis of 46 children with severe Mycoplasma pneumoniae pneumonia and pleural effusion. J Clin Pediatr. 2020;38(4):269-274.
- Lee KL, et al. Severe Mycoplasma pneumoniae pneumonia requiring intensive care in children, 2010-2019. J Formos Med Assoc. 2020;120(1):281-291.
- Yang N, Shan L, Zhang H, et al. Analysis of the characteristics of refractory Mycoplasma pneumonia in children and observation of the efficacy of hormone therapy. Int J Pediatr. 2017;44(12):882-886.
- Li Y, et al. Correlation between CT manifestations and prognosis of severe Mycoplasma pneumonia in children. Radiol Pract. 2020;35(2):234-237.
- National Health Commission of the People's Republic of China, State Administration of Traditional Chinese Medicine. Guidelines for the diagnosis and treatment of community-acquired pneumonia in children (2019 edition). Chin J Clin Infect Dis. 2019;12(1):6-13.
- Hu YM, Jiang ZF. Zhu Futang's Practical Pediatrics. People's Medical Publishing House; Beijing; 2002.
- Chen GD, Liang SY, Feng BC. Analysis of clinical manifestations, laboratory tests, and imaging characteristics of Mycoplasma pneumonia in children. Chin Gen Pract. 2015;18(1):59-64.
- Chen J, et al. Time to Mycoplasma pneumoniae RNA clearance for wheezy vs non-wheezy young children with community-acquired pneumonia. J Trop Pediatr. 2020;67(1):fmaa109.
- Yuan XX, Jia CM, Jiang CR. Significance of hepatocyte growth factor in early diagnosis and dynamic monitoring of severe Mycoplasma pneumonia in children. J Clin Pediatr. 2021;39(11):855-859.
- Wu JC, et al. Acute hypoxic respiratory failure and septic shock secondary to Mycoplasma pneumoniae pneumonia complicated by heroin overdose. Cureus. 2020;12(10):e11903.
- Li YJ. Clinical characteristics and risk factors of refractory Mycoplasma pneumonia in school-age children. Infect Inflamm Repair. 2021;22(1):24-29.
- Zhang JH, et al. Prediction of risk factors for bronchial mucus plugs in children with Mycoplasma pneumoniae pneumonia. BMC Infect Dis. 2021;21(1):67.
- Florin TA, et al. Biomarkers and disease severity in children with community-acquired pneumonia. Pediatrics. 2020;145(6):e20193728.
- Zhang C, et al. Correlation between clinical severity, bacterial load, and inflammatory reaction in children with Mycoplasma pneumoniae pneumonia. Curr Med Sci. 2020;40(5):822-828.
- Zhang YK, et al. Changes in D-dimer, CRP, and LDH in children with severe Mycoplasma pneumonia and their diagnostic value. Clin Misdiagn Treat. 2022;35(5):78-81.
- Cheng S, et al. Development and validation of a simple-to-use nomogram for predicting refractory Mycoplasma pneumoniae pneumonia in children. Pediatr Pulmonol. 2020;55(4):968-974.
- Leha S, Vier J, Hacker G, et al. Activation of neutrophils by Chlamydia trachomatis-infected epithelial cells is modulated by the chlamydial plasmid. Microbes Infect. 2018;20(5):284-292.
- Chang CX. Analysis of laboratory indicators and clinical characteristics of children with refractory Mycoplasma pneumonia. Chin J Matern Child Health. 2019;34(5):1086-1089.