This protocol integrates Baidu heatmap data, points of interest, street-view imagery, and multiscale geographically weighted regression to quantify urban vitality and evaluate how urban spatial structure influences daytime and nighttime vitality patterns in Yantai, China.
Research Article
Spatial Analysis of the Impact of Urban Spatial Structure on Urban Vitality in Yantai, China Using Multiscale Geographically Weighted Regression
In This Article
Summary
Abstract
Understanding how urban spatial structure influences urban vitality is essential for developing human-centered urban planning strategies. However, the spatial heterogeneity of these relationships and the relative contributions of different urban spatial structure elements to daytime and nighttime vitality remain insufficiently understood. This study aimed to quantify urban vitality and investigate how urban spatial structure affects its spatiotemporal variation in the main urban area of Yantai, China. Multisource spatial datasets, including Baidu heatmap data, points of interest, street-view imagery, road networks, building information, and land-use data, were integrated to characterize urban vitality and urban spatial structure. Kernel density estimation, spatial autocorrelation analysis, and multiscale geographically weighted regression (MGWR) were employed to evaluate the spatial distribution of urban vitality and the scale-dependent effects of urban spatial structure variables. The results demonstrated that urban vitality exhibits a pronounced spatial polarization characterized by a composite “center–periphery” and “one core with multiple points” pattern, together with significant positive spatial autocorrelation. The influence of urban spatial structure varied considerably across space and between daytime and nighttime. Points of interest diversity and proximity were the dominant drivers of daytime vitality, whereas residential function and points of interest diversity exerted the greatest influence on nighttime vitality. Walkability consistently showed a positive association with urban vitality during both periods, highlighting the importance of human-centered street environments. These findings demonstrate the value of integrating multisource spatial data with MGWR for evaluating urban vitality and provide a practical framework to support evidence-based urban planning and spatial optimization.
Introduction
Urban vitality is a core indicator for measuring the level of sustainable urban development, residents’ quality of life, and the effectiveness of high-quality urban construction. It has long attracted considerable attention from scholars in urban geography and urban and regional planning1,2. During the stage of incremental urbanization and rapid spatial expansion, problems associated with unbalanced urban spatial development have become increasingly prominent. Inefficient land-use allocation, environmental pollution, traffic congestion, and persistent urban challenges, such as the separation of jobs and housing, have continued to weaken neighborhood vitality3. At present, China has entered a new stage of urbanization, in which the focus of urban development is shifting from extensive “city building” to refined “city management,” with people-centered spatial development becoming a key priority. The human-centered scale focuses on micro-spatial units that residents can directly perceive and represents an extension and refinement of traditional parcel- and neighborhood-scale analyses. Since the 18th National Congress of the Communist Party of China, people-centered development has become a fundamental principle of territorial spatial governance, and improving the quality of living environments has become a primary objective of urban planning. Against this background, accurately characterizing the spatiotemporal patterns of urban vitality and clarifying the heterogeneous mechanisms through which the human-centered built environment influences vitality can provide a scientific basis for refined planning practices, including street-level urban renewal and neighborhood improvement. Meanwhile, Yantai City has launched a series of urban renewal initiatives under its 14th Five-Year Plan, was selected in 2021 as one of the first national urban renewal pilot cities by the Ministry of Housing and Urban-Rural Development, and received additional central fiscal support for urban renewal in 2026. These policy and financial advantages provide favorable conditions for improving the quality of existing urban spaces in Yantai and exploring distinctive urban renewal strategies for coastal cities, thereby promoting high-quality urban development.
The concept of urban vitality was first proposed by the American scholar Jane Jacobs, who argued that functional diversity, small blocks, buildings of different ages, and high density constitute the four essential conditions for vibrant cities4. Early studies established theoretical frameworks based primarily on field investigations and questionnaire surveys, whereas subsequent research gradually shifted toward the micro scale, focusing on the spatial concentration of human activities5. Increasing evidence has demonstrated that fine-scale temporal dynamics and spatial variation play an important role in understanding urban vitality6. The rapid development of high-resolution geospatial big data has created new opportunities for large-scale, dynamic monitoring of urban vitality. Consequently, researchers increasingly rely on multisource datasets, including mobile phone signaling data, location trajectories, social media check-ins, heatmap data, and points of interest (POIs), to quantify human activity intensity across different spatial units and investigate urban vitality at multiple scales7,8,9,10,11,12. Among these data sources, heatmap data can accurately capture the spatial distribution and temporal dynamics of population concentration and have been widely applied to quantify urban vitality at the plot, block, and city scales13,14,15. For example, Wang Chenggang et al.16 used heatmap data to identify the vitality patterns of central Guangzhou, quantify the nonlinear relationships and threshold effects of the built environment, and distinguish the different influences of working-day time periods, thereby providing valuable empirical evidence for urban vitality research.
Urban vitality is fundamentally shaped and constrained by the urban spatial structure that accommodates human activities. Understanding the mechanisms through which urban spatial structure influences urban vitality provides important support for refined urban planning and evidence-based urban governance. Existing studies have developed multidimensional evaluation systems for urban spatial structure, encompassing urban scale, functional layout, spatial form, compactness, and socioeconomic characteristics. These studies have consistently demonstrated that location conditions, population density, building form, mixed land use, facility diversity, economic development, functional diversity, street configuration, accessibility, and walkability are among the principal factors influencing the spatial differentiation of urban vitality17,18,19,20,21,22. Nevertheless, most previous studies have focused on macroscale relationships among physical, social, place-based, and mobility spaces, with relatively limited attention given to refined analyses at the human-centered scale. The emerging research paradigm based on multisource open geospatial data and intelligent analytical algorithms provides new opportunities for spatial perception and quantitative analysis at this finer scale23. By integrating machine-learning techniques with street-view image analysis, this approach combines extensive spatial coverage with human-centered analytical precision while reducing the subjectivity and limited accuracy associated with traditional spatial evaluation methods. Methodologically, previous studies have primarily employed ordinary least squares and geographically weighted regression models to examine relationships between the built environment and urban vitality24,25. However, these approaches generally focus on static spatial characteristics and often overlook both the spatial heterogeneity and the day–night temporal differentiation in the relationships between urban spatial structure and urban vitality.
In summary, research on urban vitality has evolved from traditional macro-scale theoretical investigations toward spatiotemporal quantitative analyses supported by geospatial big data. Nevertheless, important limitations remain. Existing studies continue to emphasize the macro-level quantification of physical spatial characteristics while paying relatively little attention to the spatiotemporal heterogeneity of how urban spatial structure influences urban vitality. Furthermore, refined measurements that incorporate the human perception dimension remain limited, restricting the ability of existing approaches to support detailed planning practices such as street-level urban renewal. Based on these knowledge gaps, this study proposes the following hypotheses: (1) urban spatial structure exerts significant spatiotemporally differentiated influences on urban vitality; and (2) the effects of urban spatial structure indicators on urban vitality exhibit significant spatial non-stationarity.
The principal innovations of this study are threefold. First, by integrating multisource geospatial datasets, including Baidu heatmap data and street-view imagery, this study quantifies urban vitality from the perspective of residents’ daily activities, enabling refined and objective measurement at the human-centered scale. Building upon the traditional “5D” framework, the study incorporates a human perception dimension and develops a six-dimensional urban spatial structure indicator system comprising functionality, architectural form, accessibility, socioeconomic characteristics, ecological space, and human perception. This framework addresses limitations of previous studies that primarily emphasized physical spatial and socioeconomic variables and enables the integration of macro-scale spatial analysis with micro-scale human-centered measurement. Second, this study employs the multiscale geographically weighted regression (MGWR) model to overcome the global stationarity assumption of conventional regression approaches. The model enables identification of local spatial effects and scale-dependent relationships between urban spatial structure and daytime and nighttime urban vitality, thereby revealing the spatiotemporal non-stationary coupling between urban spatial structure and urban vitality. Third, using Yantai as a representative coastal city, this study systematically investigates the differentiated mechanisms driving daytime and nighttime urban vitality from a human-centered perspective within the context of coastal urban spatial characteristics. The findings provide empirical evidence and a methodological framework for spatial optimization, urban vitality enhancement, and urban renewal in comparable coastal cities, while also contributing quantitative evidence to support human-centered and refined urban spatial governance.
Protocol
This study used anonymized and aggregated heatmap data at the spatial grid level. The data do not contain personal identifiers or individual-level information, and no human subjects were directly involved. Therefore, ethics approval, exemption, or institutional review was not required.
Research Framework
To explore the influence mechanism of urban spatial structure under the human-centered scale on the spatiotemporal differentiation of urban vitality, this study proposes a research framework as shown in Figure 1. Firstly, based on the heat map data measuring the spatiotemporal attributes of daily and nighttime urban activities of urban residents, the daily and nighttime urban vitality of the main urban area of Yantai City is measured; secondly, a multidimensional urban spatial structure index system including functionality, accessibility, architectural form, social economy, ecological space, and human perception is constructed; finally, the MGWR model is used to reveal the influence mechanism of urban spatial structure on the spatiotemporal differentiation of urban vitality. Detailed workflows for data acquisition, preprocessing, indicator calculation, image analysis, and model implementation are provided in Supplementary Files 1–4, and the corresponding computational workflows are provided in Supplementary Codes 1–4. The aim is to provide a theoretical basis and reference for urban renewal and the creation of vibrant cities under the new urbanization strategy.
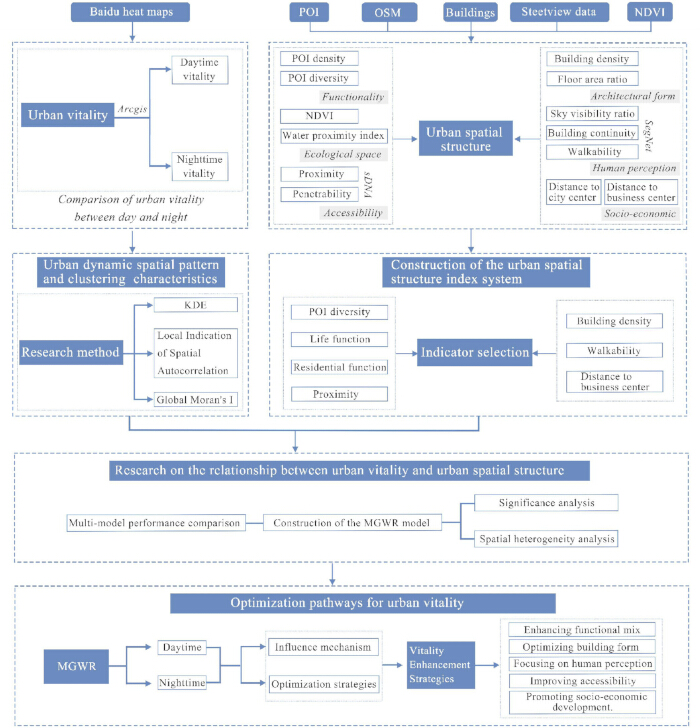
Figure 1. Research framework diagram. This diagram summarizes the complete analytical workflow, including multisource spatial data acquisition, data processing, urban spatial structure indicator construction, urban vitality measurement, multiscale geographically weighted regression (MGWR) modeling, and vitality optimization strategies. Please click here to view a larger version of this figure.
Overview of the Study Area
Yantai City is located in the northeastern part of the Shandong Peninsula, bordering the Yellow Sea and the Bohai Sea. It is an important port city in Shandong Province. It has five districts and six county-level cities under its jurisdiction, with a total area of 13,930.1 km2. This study selects the main urban area of Yantai City (Zhifu District) as the research area. The district covers 179.18 km2, has a registered population of 707,700, and comprises 12 subdistricts (Figure 2).
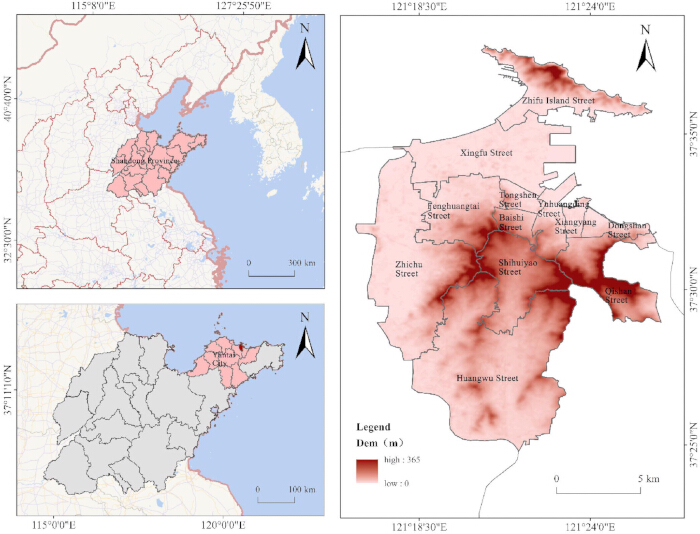
Figure 2. Schematic diagram of the study area. The maps show the location of Yantai City, the main urban study area in Zhifu District, subdistrict boundaries, and terrain elevation. Darker colors indicate higher elevation. Please click here to view a larger version of this figure.
Given that this study focuses on the urban core, where the study area is relatively small and the road network is dense, the traditional block scale is insufficient for accurately characterizing urban vitality. By contrast, the 300 m scale aligns closely with the spatial extent of the “5-minute living circle” and can better represent the basic spatial unit of residents’ daily activities. The selection of grid scale essentially involves a trade-off between information granularity and statistical stability: a smaller scale preserves more spatial details but reduces the sample size within each unit, increases statistical noise, and may fragment contiguous walking activity spaces, whereas a larger scale tends to smooth local variations and obscure spatial heterogeneity. A 300 m grid can retain fine-grained spatial characteristics while improving statistical stability and reducing analytical errors caused by scale selection. In addition, this scale is well matched to the spatial resolution of multisource data, including Baidu heatmap data, points of interest, and street-view imagery, thereby enhancing analytical accuracy and result reliability. Therefore, this study divided the research area into 2,221 cells using a 300 m × 300 m grid to visualize the spatiotemporal patterns of urban vitality at a fine scale and explore their relationship with urban spatial structure. The grid was generated in ArcGIS 10.4 using the Create Fishnet tool under the CGCS2000 three-degree Gauss coordinate system. The fishnet was anchored at the minimum XY coordinate of the study area and clipped to the study boundary, resulting in 2,221 analysis units.
Construction of the Indicator System
Constructing an index system for urban spatial structure is an important part of evaluating urban vitality. It reflects the comprehensive characteristics of a city in terms of spatial layout, functional mixture, accessibility, and related characteristics. This study is based on the “5D” theory of density, design, diversity, distance to transit, and destination accessibility. It expands the representation method of urban spatial structure elements on the basis of existing research and divides them into six categories and 15 factors: functionality, architectural form, accessibility, social economy, ecological space, and human perception. Each factor is analyzed individually (Table 1). The complete definitions, computational equations, parameter settings, preprocessing procedures, and normalization methods for all indicators are provided in Supplementary File 2.
Table 1: Urban spatial structure indicator system. The table summarizes the six dimensions and 15 indicators used to characterize urban spatial structure, including functionality, architectural form, accessibility, socioeconomic characteristics, ecological space, and human perception. Definitions and computational equations are provided for each indicator. Abbreviations: POI, point of interest; FAR, floor area ratio; NDVI, normalized difference vegetation index. Please click here to download this Table.
Among them, functionality is one of the important indicators for measuring urban spatial vitality, reflecting the degree of interconnection and integration between different functional areas. High functional mixture means that residential, economic, and living functional areas are evenly distributed and interwoven, thereby promoting human activities and enhancing urban vitality26. The evolution of architectural form is associated with vitality, and building density and floor area ratio are important indicators reflecting urban compactness. Accessibility directly affects the connectivity and transportation efficiency of urban space. This study selects proximity and permeability indicators to represent accessibility. Social economy reflects the concentration of economic activities and the level of regional economic development. The distance to the city center and commercial center is used to characterize socioeconomic activity, with shorter distances generally indicating more active economic activities27. Ecological space is an important factor affecting the economic, social, and cultural vitality of the city. This study uses the near-water index and normalized difference vegetation index (NDVI) to represent environmental quality and ecological vitality. Human perception focuses on the urban spatial forms and related environmental characteristics that residents frequently encounter in their daily lives, including urban public spaces and the external interfaces of buildings (such as streets, buildings, greenery, and parks) and their associated economic, social, and ecological impacts. In this study, building continuity, sky view factor, and walkability are selected to represent this dimension. These indicators better capture the contribution of human perception to urban vitality and complement conventional indicator systems that rely primarily on objective variables.
Notably, the measurement of traditional built environments differs fundamentally from the human-oriented urban spatial structure assessment adopted in this research. Traditional methods use macro-scale physical units, including land parcels and districts, as the analytical units. Relying on static datasets such as land-use classification, building footprints, and road network data, they quantify development intensity and functional layout. These conventional evaluations assess spatial physical conditions from a top-down planning perspective. While such methods accurately characterize the material attributes of urban space, they fail to capture residents’ on-site perceptions and micro-scale walking experiences. By contrast, the human-oriented framework shifts the research focus from inherent spatial attributes to human-environment interactions. This paradigm transformation includes three major changes. First, in terms of measurement content, the study extends beyond conventional physical indicators such as building density and land-use proportion by incorporating experiential dimensions including visual perception, walkability, safety, and comfort. Three corresponding indicators are selected in this study: building continuity, sky view factor, and walkability. Second, with regard to data sources, planning maps and remote sensing data are supplemented with street-view images and deep-learning semantic segmentation, which capture spatial characteristics from the eye-level perspective of pedestrians. Third, the analytical unit is further refined from the block scale to street segments or individual visual fields. It should be emphasized that the human-oriented measurement does not replace traditional built-environment evaluation but instead complements it by changing the research perspective and spatial scale. The two approaches differ in research focus, indicator system, analytical scale, and practical objectives, and together provide a comprehensive analytical framework for evaluating urban spatial structure.
Data Sources and Processing
Baidu Heatmap Data:
The urban thermal heat data adopted in this research originates from the open location service of Baidu Maps, which is generated by mining massive anonymous user behavioral records. The dataset captures real-time population distribution by aggregating location information from mobile app users and mapping such geographic coordinates onto spatial grids via real-time location service requests.
We retrieved heatmap data covering Yantai’s central urban area from June 13 to 17, 2022 (five consecutive working days) by invoking the API of the Baidu Map Open Platform (https://lbsyun.baidu.com/). Data was collected every 2 h from 07:00 to 24:00 each day. The complete workflow for data acquisition, preprocessing, denoising, temporal classification, spatial transformation, kernel density estimation, and urban vitality calculation is provided in Supplementary File 1, and the corresponding preprocessing script is provided in Supplementary Code 1. We further divided each day into daytime (07:00–18:00) and nighttime (18:00–24:00) periods to quantify diurnal variations in urban vitality separately. API requests included the Baidu Maps access key (AK) and a BD09-defined study-area boundary. The map zoom level was fixed at 16 with a tile size of 256 × 256 pixels, and the interface returned heat map data in JSON format. During post-processing, all BD09 coordinates were converted to the WGS84 coordinate system to ensure spatial accuracy and consistency for subsequent analyses. The remaining preprocessing workflow is provided in Supplementary File 1 and Supplementary Code 1. All spatial visualization was completed in ArcGIS (v10.4) (RRID: SCR_011081).
June represents early summer in Yantai, with mild weather conducive to outdoor activities, and residents’ daily travel patterns in this month reflect regular average activity levels. All sampling days were clear and cloudless, eliminating disturbances to human mobility caused by extreme weather and making population heatmaps suitable for identifying routine urban vitality patterns.
To verify the reliability of heatmap-derived vitality measurements, we incorporated NPP-VIIRS nighttime light data for cross-comparison. The nighttime light dataset was published by Chen Zuqi et al. in Earth System Science Data, entitled Cross-sensor calibrated extended time series of global NPP-VIIRS-like nighttime light data (2000–2018), and is publicly accessible via the Harvard Dataverse repository (https://dataverse.harvard.edu/dataset.xhtml?persistentId=doi:10.7910/DVN/YGIVCD).
Spatial comparison results demonstrated high consistency between hotspots of urban vitality identified from nighttime light imagery and the high- and low-vitality zones extracted from the heat map data in this study. The comparison between nighttime light intensity and heat map-derived urban vitality is presented in Supplementary Figure 1. To evaluate data reliability, outliers were first removed and the datasets were normalized before being reprojected to the WGS84 coordinate system. The nighttime light data were then resampled to a 300 m × 300 m grid using bilinear interpolation to ensure spatial alignment with the heat map data. Agreement between the two datasets was evaluated using the Pearson correlation coefficient (r ≥ 0.6) and the spatial overlap rate of LISA clusters (≥70%) as the acceptance criteria.
From the perspective of data sources, mobile-phone signaling data offer comprehensive population coverage and fine-grained trajectory information, but they are difficult to obtain and require complex preprocessing, making them less suitable for long-term, fine-scale studies. Social media check-in and review data, meanwhile, mainly capture consumption- and leisure-oriented activities, with pronounced behavioral bias and relatively poor temporal stability. In contrast, the Baidu heatmap data used in this study are easy to access, temporally continuous, and available at a higher spatial resolution, making them well suited for grid-scale monitoring of day–night vitality dynamics in the main urban area. Combined with POI and street-view data to enrich spatial attribute representation, this framework can more accurately reflect residents’ everyday activity patterns and is well aligned with the research scale and analytical objectives of this study.
Urban Spatial Structure Elements:
Basic Urban Spatial Data:
Based on the online map service interface, a total of 37,851 points of interest (POIs) were collected, spanning 11 functional categories, including accommodation, shopping, dining, residential areas, transportation infrastructure, daily-life facilities, sports and leisure venues, and public service facilities. Additional preprocessing procedures and computational details are provided in Supplementary File 2. POI data were retrieved in July 2024 using the Baidu Map API with a 500 m grid-based search strategy. During preprocessing, duplicate records were removed, and invalid records were excluded based on the Zhifu District administrative boundary, missing attribute labels, and substantial coordinate offsets to ensure the spatial accuracy and integrity of the dataset.
Urban building footprints and road network data were obtained from OpenStreetMap (OSM; RRID: SCR_007854), an open-source geospatial platform (https://www.openstreetmap.org). Land-use data were acquired from the National Basic Geographic Information Center (https://www.gscloud.cn/search).
As presented in Table 1, the spatial density of each facility type reflects the functional character of individual spatial units through clustering patterns; meanwhile, entropy values quantify the degree of functional diversity within each unit. The complete computational equations, preprocessing procedures, parameter settings, and normalization methods are provided in Supplementary File 2.
Building vector data were analyzed from both two-dimensional (2D) and three-dimensional (3D) perspectives to assess urban construction intensity—specifically, via building density and floor area ratio (FAR) metrics. Using the urban road network data, accessibility for each spatial unit was computed with the spatial design network analysis (sDNA) toolkit (RRID: SCR_017646)28, incorporating both proximity and betweenness indicators.
Selecting a 300-m radius as the analytical scale for this indicator, this distance is defined based on street segments and encompasses all topologically connected roads within the radius. This enables a comprehensive statistical analysis of changes in road network morphology—including corner density and node connectivity—within the designated spatial extent. The approach deliberately emphasizes local spatial correlation patterns among streets, thereby facilitating precise identification of highly connected streets at the block level—a methodological choice aligned with the theoretical framework of urban spatial vitality focused on the block scale29,30. A topological road network was constructed from OSM vector road data by collapsing bidirectional road segments into a single centerline. Accessibility was calculated using the sDNA plugin in ArcGIS 10.4 based on the proximity and betweenness indices, with grid-based POI totals applied as weights to represent spatial activity potential. All sDNA parameters were kept at their default values except for a user-defined search radius of 300 m. Moreover, this spatial scale corresponds closely to the “5-minute living circle” concept and is well matched to both the physical dimensions of historic blocks in Zhifu District, Yantai City, and the typical range of residents' daily walking activities.
Street View Image Data:
Combining OSM road network data with GIS technology, street-view image sampling points were laid out. Firstly, the centerlines of roads in the study area were extracted, and the two-way roads were simplified into single lines. Sampling points were evenly spaced at 50 m intervals along the centerlines of the roads. Then, all sampling points were assigned the same projection coordinate system used for the GIS analysis to ensure precise spatial position matching.
Using Python (RRID: SCR_008394), the Street View Image API (http://api.map.baidu.com/lbsapi/) was used to collect images. The complete acquisition workflow is provided in Supplementary File 3 and Supplementary Code 3. A total of 1,599 sampling points were generated. During image acquisition, the perspective width of each image was set to 90°, and the horizontal viewing angle was set to 0°. Images were collected in the front, back, left, and right directions at each sampling point, and image acquisition was performed only under clear weather conditions, without rain, snow, or heavy fog, to ensure image quality. Finally, the OpenCV program was used to stitch multidirectional images and optimize image transitions, generating panoramic images that achieved full-view coverage of the street spatial environment. The study area covered a total of 3,251 street segments. The API request parameters included the developer access key (AK), point coordinates, image viewpoint, and shooting orientation. Captured images were uniformly resized to 480 × 360 pixels (RGB) for subsequent analysis. Image quality was ensured through weather-based screening, multidirectional image acquisition, and subsequent SegNet-based semantic segmentation to verify image usability and extract street-view indicators.
We adopted the deep learning SegNet network (RRID: SCR_017042), a fully convolutional neural network, to extract streetscape features. The model classifies image pixels into five categories: sky, sidewalks, road lanes, buildings, and green space. The pixel classification results were then used to calculate the area proportion of each spatial element within every street-view image. Detailed model implementation, semantic segmentation workflow, validation procedures, and calculation of the human-perception indicators are provided in Supplementary File 3, Supplementary Code 2, and Supplementary Code 4. SegNet was implemented in PyTorch (v1.0) using publicly available pretrained weights trained on the MIT ADE20K dataset. During inference, images were processed individually to generate pixel-level semantic segmentation maps, which were subsequently used to calculate the proportional area of each streetscape element. Model performance was evaluated using five-fold cross-validation.
Research Methods
Quantitative Methods for Measuring Urban Vitality:
Kernel density analysis estimates the density of point or line features using a moving search window, enabling intuitive and accurate representation of the spatial clustering characteristics of urban elements and the concentration and dispersion of urban vitality. This study used kernel density estimation to perform continuous interpolation of heat map data to characterize the spatial aggregation of users and the spatiotemporal dynamics of urban vitality. Gaussian kernel density estimation was applied using a primary search radius (bandwidth) of 500 m. To evaluate the robustness of the results, eight additional bandwidths (200, 300, 400, 600, 700, 800, 900, and 1,000 m) were also tested, and the resulting mean RV values for each 300 m × 300 m grid cell showed high consistency across bandwidths. The interpolation used the Value field as the weighting variable, no edge correction was applied, and all kernel density analyses were performed in ArcGIS 10.4 (RRID: SCR_011081). Its mathematical expression is given as follows (Equation 1):
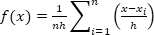 (1)
(1)
Here, n represents the number of data points; h is the bandwidth; and (x − xi) denotes the distance from the estimation point x to sample xi.
Analysis Method for Urban Dynamic Spatial Pattern:
Spatial autocorrelation is used to characterize the degree of spatial association among identical attribute values across different spatial units. It is divided into global autocorrelation and local autocorrelation.
Global Spatial Autocorrelation:
Global spatial autocorrelation (Global Moran’s I) was used to evaluate the degree of spatial association across the entire study area. It measures the similarity or correlation of variables in space by quantifying the relationship between the attribute value at one location and those of neighboring locations, represented by the Global Moran’s I coefficient. A spatial weights matrix was constructed using the 300 m × 300 m analysis grid with Queen contiguity to define neighboring units, and the weights were row-standardized. Global Moran’s I was calculated using the Spatial Statistics tools in ArcGIS 10.4 (RRID: SCR_011081), and statistical significance was assessed using the normal approximation (z-test) at the 95% confidence level. Its mathematical expression is given as follows (Equation 2):
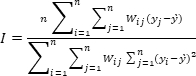 (2)
(2)
Here, I represents the autocorrelation index; n is the total number of study units; yi and yj are the classification indicators of regions i and j, respectively; y′ is the average of the classification indicators; and Wij is the spatial weight matrix representing the degree of association among different regions.
Local Spatial Autocorrelation:
Local spatial autocorrelation (LISA) measures the degree of spatial association exhibited by the study object at the local level, allowing the identification of local clusters and spatial outliers within the study area and providing a more detailed understanding of spatial heterogeneity31. The most commonly used local statistic is Local Moran’s I. A spatial weights matrix was constructed using Queen contiguity, whereby neighboring grid cells were defined as those sharing either a common boundary or a vertex. Statistical significance was assessed at the 0.05 level using 999 random permutations. No multiple-testing correction was applied, and all analyses were performed using ArcGIS 10.4 (RRID: SCR_011081). The mathematical expression is given as follows (Equation 3):
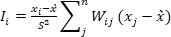 (3)
(3)
Here, xi and xj represent the urban vitality values of regions i and j, respectively; x′ is the mean urban vitality across all regions; S2 is the variance; and Wij is the spatial weight matrix representing the degree of spatial association between regions.
Research Methods for Spatial Heterogeneity of Urban Vitality:
Multiscale Geographically Weighted Regression (MGWR)
The MGWR model employs the Golden Section Search algorithm to iteratively narrow the search interval and identify the optimal bandwidth for each regression coefficient. This approach minimizes noise during parameter estimation and improves model predictive performance. Detailed information on the bandwidth selection method (adaptive or fixed), kernel function, bandwidth search range, convergence criteria, stopping tolerance, and predictor standardization procedures is provided in Supplementary File 4. The computation formula is as follows (Equation 4):
 (4)
(4)
Here, bwj represents the bandwidth used for the regression coefficient of the j-th variable; k denotes the number of explanatory variables; xij refers to the j-th predictor for the i-th grid; (ui, vi) represent the centroid coordinates of the i-th grid; β(bwj) is the regression coefficient estimated using the corresponding bandwidth; and εi is the random error term.
Detailed model configuration, bandwidth optimization procedures, and implementation workflow are provided in Supplementary File 4, while complete daytime and nighttime model outputs are available in Supplementary Files 5 and 6, respectively. Ordinary least squares regression diagnostics are provided in Supplementary File 7.
From the perspectives of urban development theory, research scope, and practical applicability, MGWR offers distinct advantages over both ordinary least squares regression (OLS) and conventional geographically weighted regression (GWR). OLS employs a global modeling framework, assuming uniform effects of all explanatory variables across the entire study area. This assumption overlooks the inherent spatial heterogeneity of urban systems, yielding averaged parameter estimates that often fail to capture localized realities and thus provide limited support for context-sensitive policy formulation. While traditional GWR accounts for spatial non-stationarity, it imposes a single bandwidth—that is, a uniform spatial scale—for all variables. This constraint contradicts empirical evidence indicating that different urban elements (e.g., transit infrastructure, land-use mix, or green space) exert influence over markedly different spatial extents. Consequently, such oversimplification may introduce model bias and compromise analytical validity. MGWR overcomes this limitation by estimating individual, variable-specific bandwidths based on the empirically observed spatial influence range of each predictor. As a result, it more faithfully captures the scale-dependent mechanisms through which urban spatial structure shapes urban vitality. This advancement not only enriches the theoretical understanding of human–environment interactions in cities but also enhances practical utility by enabling differentiated prioritization of spatial interventions and providing quantitative, evidence-based support for urban vitality enhancement. The computational workflows are provided in Supplementary Codes 1–4.
Results
Analysis of the Spatial Pattern of Urban Vitality
Spatial Distribution Characteristics of Urban Vitality:
To better examine the spatiotemporal evolution of urban vitality in the main urban area of Yantai during both daytime and nighttime, we conducted a kernel density analysis based on heatmap data, combined with residents’ daily activity patterns, and used geographic information system (GIS) software to visualize urban vitality across different time periods. As shown in Figure 3, urban vitality in Yantai’s main urban area exhibits a distinct spatiotemporal dynamic characterized by an aggregation–dispersion–aggregation pattern from 07:00 to 23:00. The spatial distribution of high- and low-vitality areas during the day and at night is highly similar, indicating that fluctuations in urban vitality between these periods are relatively stable.
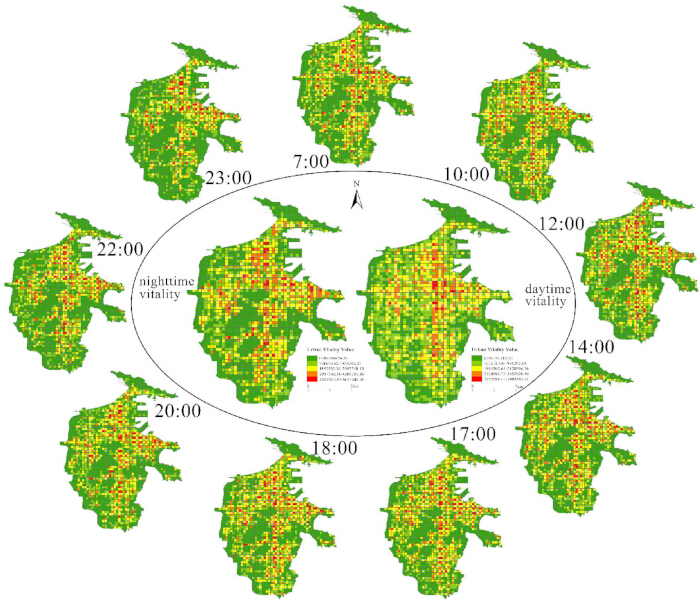
Figure 3. Spatiotemporal distribution of urban vitality in Yantai’s main urban area. The peripheral maps show urban vitality at different time points, and the central maps summarize daytime and nighttime vitality patterns. Warmer colors indicate higher vitality. Please click here to view a larger version of this figure.
From a spatial perspective, urban vitality in Yantai’s main urban area is generally higher in the northeast and lower in the southwest, exhibiting a complex spatial structure characterized by both a “center–periphery” pattern and a “multicore” configuration. Areas with high levels of urban vitality are mainly concentrated in the northeastern section, including Tongshen Street, Yuhuangding Street, and Xiangyang Street, as well as along Dahaiyang Road and Airport Road. In addition, vitality is relatively high in the eastern part of Zhichu Street and the central part of Fenghuangtai Street. Urban vitality in Yantai’s main urban area is also strongly shaped by topographic conditions. Mountainous areas in the central region, such as Huangjinding, Zhenshan, and Jinkuangding, are classified as low-vitality zones. During the daytime, vitality in these areas is somewhat enhanced by activities such as hiking and leisure, whereas nighttime vitality is extremely low. This pattern indicates a pronounced spatial disparity in the distribution of urban vitality, which tends to cluster in high-density residential areas, recreational destinations, and locations with strong transportation accessibility. This composite spatial structure confirms the coupling relationship between urban functional zoning and population mobility. Moreover, the important roles of terrain and transportation further support the hypothesis that multiple urban spatial structures jointly shape urban vitality.
From a temporal perspective, urban vitality in Yantai’s main urban area is shaped primarily by residents’ work and leisure activities. The period from 07:00 to 18:00 covers the morning peak and the daytime hours of work and study, during which residents typically commute from home to their workplaces, causing the spatial pattern of urban vitality to shift from aggregation to dispersion. The period from 18:00 to 23:00 includes the evening peak and leisure hours. In particular, after 22:00, the spatial distribution of urban vitality becomes more concentrated, while overall vitality levels decline. This reflects the fact that, on the one hand, residents return home after work and leisure activities and, on the other hand, previously active urban spaces gradually wind down for the night. Overall, the daytime–nighttime variation in urban vitality is clearly driven by residents’ daily work–rest routines. Daytime hours (07:00–18:00) represent the peak period of urban vitality, characterized by higher vitality levels, broader spatial coverage, and very few low-vitality areas. By contrast, nighttime hours (18:00–23:00) are marked by a gradual reduction in the activity range, with vitality increasingly concentrated in residential areas. These findings clearly demonstrate the time-dependent influence of work–rest activities on urban vitality in Yantai’s main urban area, reveal its diurnal evolution characteristics, fulfill the core objective of identifying the spatiotemporal pattern of urban vitality, and support the hypothesis that residents’ daily activity rhythms are closely related to urban vitality.
Spatial Clustering Characteristics of Urban Vitality:
The global Moran’s I index was employed to examine the spatial autocorrelation of urban vitality in the main urban area of Yantai City. The results show that the Moran’s I values for daytime and nighttime urban vitality are 0.722 and 0.736, respectively. The significance test indicates that urban vitality in the main urban area of Yantai City exhibits significant clustering during both the daytime and nighttime, with a more pronounced clustering effect at night than during the day.
As shown in Figure 4, urban vitality in Yantai’s main urban area mainly follows two clustering patterns: “high–high” clustering and “low–low” clustering. Although the overall spatial distribution presents an irregular composite pattern combining “center–periphery” and “one core with multiple points,” the “center” and “periphery” are spatially separated, and the transitional zones between them contain a large number of areas with no significant clustering. The results of the spatial autocorrelation analysis clearly identify the clustering patterns and spatial differentiation of urban vitality, thereby fulfilling the research objective of pattern recognition. These findings also support the relevant research hypotheses, align closely with the overall analytical framework of this study, and provide a foundation for further analysis of the differentiated effects of spatial structure.
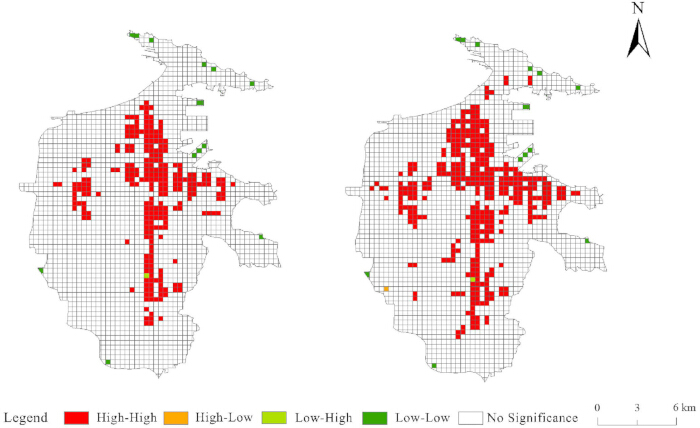
Figure 4. Daytime and nighttime local spatial aggregation of urban vitality. Local indicators of spatial association (LISA) maps show high-high, high-low, low-high, low-low, and non-significant spatial clusters for daytime and nighttime vitality. Please click here to view a larger version of this figure.
MGWR-based Spatial Heterogeneity Effects of Urban Spatial Structure on Urban Vitality
To avoid estimation bias caused by the mutual influence among the various factors of the urban spatial structure, the variance inflation factor (VIF) was used to test all explanatory variables. The larger the VIF value, the greater the multicollinearity. Generally, a VIF value greater than 7.5 indicates that the explanatory variable is redundant32. The test results are shown in Table 2. All VIF values are less than 7.5, indicating that the selected indicators do not exhibit multicollinearity. The indicators with p > 0.05 were then removed because they were considered to have no significant impact on urban vitality. Following variable selection, the final seven factors—POI diversity, life function, residential function, building density, proximity, distance to business center (DBC), and walkability—were selected as explanatory variables to construct the MGWR model (RRID: SCR_017651). This step completed the variable selection process, and the retained core factors are consistent with the research framework, ensuring that the subsequent model analysis can effectively verify the research hypothesis.
| Variable | p-value | Variance Inflation Factor (VIF) |
| POI diversity | 0 | 1.946 |
| Economic function | 0.025 | 3.15 |
| Life function | 0.004 | 3.834 |
| Residential function | 0.001 | 1.925 |
| Building density | 0 | 3.062 |
| Floor area ratio | 0.084 | 5.723 |
| Proximity | 0 | 1.732 |
| Betweenness | 0.952 | 2.022 |
| Distance to city center | 0.458 | 1.407 |
| Distance to business center | 0.009 | 1.498 |
| Near-water index | 0.06 | 1.132 |
| Normalized Difference Vegetation Index (NDVI) | 0.118 | 1.049 |
| Building continuity | 0.364 | 2.746 |
| Sky view factor | 0.22 | 1.177 |
| Walkability | 0.004 | 2.094 |
Table 2: Multicollinearity assessment of candidate explanatory variables. The table presents the statistical significance (p-value) and variance inflation factor (VIF) for each candidate explanatory variable used during variable screening prior to multiscale geographically weighted regression (MGWR) analysis. Variables retained for subsequent modeling satisfied the predefined statistical selection criteria. Abbreviation: VIF, variance inflation factor.
Model Fit Effect:
Modeling analysis was conducted using three approaches: the global OLS model, the traditional GWR model, and the MGWR model. Model convergence was based on the SOC-f (smoothing f) criterion, in which the maximum absolute change in all estimated regression coefficients between two successive iterations was used as the convergence criterion. The convergence threshold was set at 1.0 × 10⁻5, and the maximum number of iterations was set at 200. The daytime and nighttime models adopted the same methodological settings, including the kernel function, bandwidth search rule, convergence criterion, and other parameter settings, to ensure comparability of the results; only the dependent variables differed, and thus the estimated optimal bandwidths and regression coefficients also differed. The results show that the daytime model converged after 28 iterations and the nighttime model after 34 iterations. Both models satisfied the convergence threshold, indicating that the estimation results were stable and reliable. The indicators for the three models are reported in Table 3.
| Category | Variable | OLS | GWR | MGWR |
| Model performance | AICc | 6703 | 4417 | 3463 |
| Adjusted R² | 0.62 | 0.56 | 0.8 | |
| Optimal variable bandwidth (MGWR) | POI diversity | — | 53 | 239 |
| Life function | — | — | 724 | |
| Residential function | — | — | 256 | |
| Building density | — | — | 237 | |
| Proximity | — | — | 921 | |
| Distance to business center | — | — | 2220 | |
| Walkability | — | — | 2220 |
Table 3: Comparison of model performance among ordinary least squares (OLS), geographically weighted regression (GWR), and multiscale geographically weighted regression (MGWR). The table compares the performance of the ordinary least squares (OLS), geographically weighted regression (GWR), and multiscale geographically weighted regression (MGWR) models using the corrected Akaike information criterion (AICc) and adjusted coefficient of determination (Adjusted R2). The optimal bandwidth estimated for each explanatory variable in the MGWR model is also reported, illustrating the variable-specific spatial scales of the regression analysis. Abbreviations: AICc, corrected Akaike information criterion; OLS, ordinary least squares; GWR, geographically weighted regression; MGWR, multiscale geographically weighted regression.
As shown in Table 3, the MGWR model has a lower AICc value and a higher adjusted R2 than the OLS and GWR models, demonstrating superior model fit. In addition, compared with the OLS and GWR models, the MGWR model allows each explanatory variable to have its own optimal bandwidth, with bandwidths ranging from 237 to 2,220. This indicates that the effects of different variables on urban vitality vary significantly across spatial scales.
Among the variables, the bandwidths of DBC and walkability are close to the full sample size, suggesting that their effects are mainly global rather than local. This may be because these factors show relatively limited spatial variation across most areas. As indicators representing socioeconomic conditions and street-environment characteristics closely related to human perception, they exert an overall influence on urban vitality. By contrast, the five variables of POI diversity, life function, residential function, building density, and proximity have relatively small bandwidths, indicating that their effects are concentrated at the local spatial scale. These factors reflect residents’ differentiated demands for functional complexity, living environment, and accessibility and may therefore attract or constrain different types of activities in local spaces, thereby shaping urban vitality.
In particular, the bandwidths of POI diversity, residential function, and building density are 239, 256, and 237, respectively, accounting for 11%, 12%, and 11% of the full sample. The bandwidths of life function and proximity cover a larger proportion of the sample, corresponding to 33% and 41%, respectively, suggesting that their effects operate over a broader spatial scale. Overall, the advantages of the MGWR model are evident. The varying effect scales of the explanatory variables further support the hypothesis of spatial heterogeneity and confirm the appropriateness of the model selected for this study.
Significance of the Impact:
The statistical results of the regression coefficients obtained from the MGWR model are presented in Table 4. Based on the absolute values of the average regression coefficients, the contributions of the urban spatial structure variables during the daytime are ranked as follows: POI diversity > accessibility > building density > life function > residential function > walkability > DBC. At nighttime, the ranking shifts slightly to: POI diversity > life function = residential function > building density > walkability > DBC > accessibility.
| Variable | Daytime Mean | Daytime SD | Daytime Median | Nighttime Mean | Nighttime SD | Nighttime Median |
| POI diversity | 0.226 | 0.126 | 0.196 | 0.322 | 0.096 | 0.315 |
| Life function | 0.088 | 0.006 | 0.088 | 0.145 | 0.075 | 0.153 |
| Residential function | 0.019 | 0.158 | 0.004 | 0.145 | 0.173 | 0.123 |
| Building density | 0.132 | 0.029 | 0.131 | 0.070 | 0.126 | 0.053 |
| Proximity | 0.165 | 0.188 | 0.121 | 0.030 | 0.048 | 0.024 |
| Distance to business center | −0.010 | 0.004 | −0.010 | 0.032 | 0.003 | 0.031 |
| Walkability | 0.011 | 0.002 | 0.011 | 0.039 | 0.002 | 0.039 |
Table 4: Summary statistics of regression coefficients estimated by the multiscale geographically weighted regression (MGWR) model. The table summarizes the distribution of regression coefficients estimated by the multiscale geographically weighted regression (MGWR) model for daytime and nighttime urban vitality. For each explanatory variable, the mean, standard deviation (SD), and median regression coefficients are reported, allowing comparison of the magnitude and variability of the effects across the two time periods. Abbreviations: MGWR, multiscale geographically weighted regression; SD, standard deviation.
Notably, POI diversity consistently demonstrates the greatest contribution to urban vitality during both the daytime and nighttime, with a positive effect. This indicates that areas characterized by a diverse range of urban facilities and a high degree of functional mixing are particularly attractive to urban residents, thereby enhancing urban vitality. During the daytime, residents’ activities are primarily oriented toward commuting, office work, and public services; therefore, proximity and building density play important roles. At nighttime, residents’ activities shift toward residence, leisure, and local consumption, and the contributions of life function and residential function increase significantly, whereas the contribution of proximity declines markedly. This day–night difference in ranking directly reflects the structural shift in the mechanisms driving urban vitality as residents’ daily activity patterns change, providing a macroscopic basis for subsequent differentiated planning by zone and time period.
As illustrated in Figure 5, analysis of the variations in regression coefficients and differences in impact zones after screening the influencing factors reveals that the effects of life function, DBC, and walkability are relatively stable during the daytime. Life function and walkability have positive effects, whereas the distance to the business center exhibits both positive and negative effects. The impact ranges of POI diversity, residential function, and accessibility fluctuate substantially and likewise exhibit both positive and negative effects. The influence of building density varies within a certain range but remains positive. At nighttime, the effects of DBC and walkability are more stable and both remain positive. In contrast, the effects of POI diversity, residential function, and building density show considerable variation, with POI diversity exhibiting a positive effect, whereas residential function and building density demonstrate both positive and negative relationships with urban vitality. The effects of life function and accessibility also vary within a certain range.
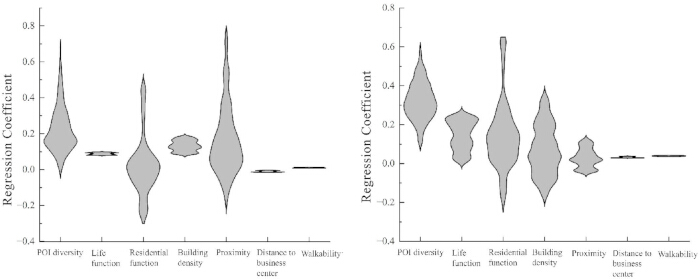
Figure 5. Distribution of regression coefficients from the multiscale geographically weighted regression model. Violin plots compare daytime and nighttime coefficient distributions for each influencing factor. Wider regions indicate higher coefficient density; positive values indicate promoting effects, and negative values indicate inhibitory effects. Please click here to view a larger version of this figure.
Spatial Heterogeneity of Impact
To further analyze the spatial heterogeneity of the effects of urban spatial structure on urban vitality, samples with significant influence levels were selected. The daytime and nighttime regression coefficients of each urban spatial structure element were visualized (Figures 6 and 7). Using the natural breakpoint classification method, the regression coefficients were divided into 10 levels to illustrate the spatial extent, intensity, and directional changes of their effects.
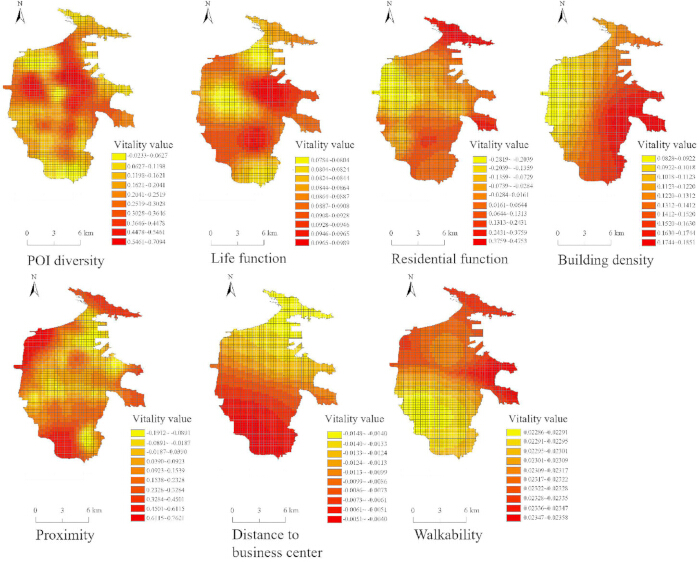
Figure 6. Daytime spatial distribution of multiscale geographically weighted regression coefficients. Maps show the spatial variation in daytime regression coefficients for points of interest diversity, life function, residential function, building density, proximity, S, and walkability. Color gradients indicate coefficient magnitude as shown in each panel legend. Please click here to view a larger version of this figure.
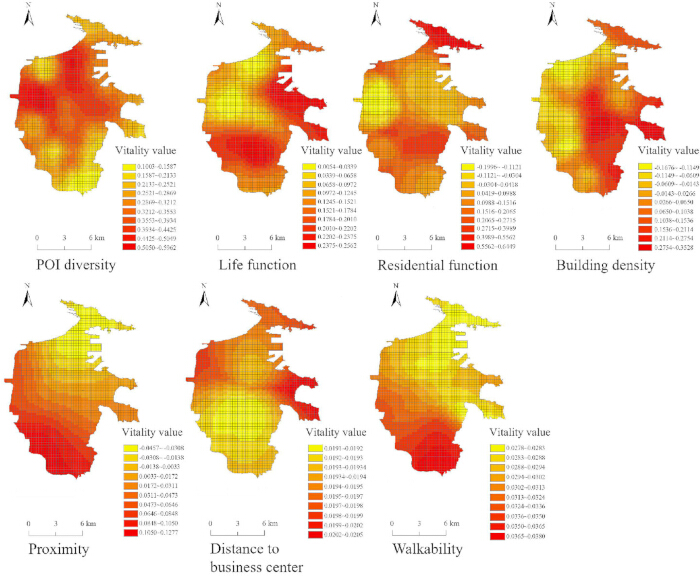
Figure 7. Nighttime spatial distribution of multiscale geographically weighted regression coefficients. Maps show the spatial variation in nighttime regression coefficients for points of interest diversity, life function, residential function, building density, proximity, distance to business center, and walkability. Color gradients indicate coefficient magnitude as shown in each panel legend. Please click here to view a larger version of this figure.
POI diversity measures the diversity and complexity of urban functions within each spatial unit. The core mechanism underlying urban vitality lies in the diversity of destinations and the synergistic effects of activities. The higher the POI diversity of an area, the better it can satisfy residents’ diverse needs for shopping, dining, entertainment, and daily services within the same space, thereby reducing the need for cross-regional travel, prolonging pedestrian stay duration, and enhancing the intensity of spatial utilization. The results show that POI diversity has the strongest influence on urban vitality and exhibits significant spatial variation. Specifically, its distribution is relatively concentrated in areas with high and low effects: stronger influences are mainly observed in the urban center, whereas weaker influences are mainly found in the urban periphery. The overall regression coefficients are predominantly positive, indicating a clear positive relationship, with only a small number of weak negative associations. This suggests that, in most areas, higher POI diversity is associated with greater urban vitality. Moreover, the spatial differentiation in the effects of POI diversity on urban vitality is more pronounced at night than during the day, making it the most influential factor at night. This diurnal difference can be attributed to the structural differentiation of residents’ activity demands between the daytime and nighttime. During the daytime, mixed land use mainly accommodates commuting and short-term, fragmented consumption demands during breaks, and its role in attracting pedestrian activity is relatively limited. At night, however, people’s activities shift toward leisure, social interaction, and experiential consumption. In this context, areas with high POI diversity can provide varied and continuous nighttime consumption scenarios, effectively extending residents’ outdoor stay time and thereby exerting a more prominent driving effect on nighttime vitality.
Life functions encompass facilities related to education, science, culture, health, transportation, and public services that meet residents’ daily needs. Their mechanism of influence lies in the formation of an activity–destination network: these facilities not only attract pedestrian flows themselves but also, through synergy with other functions, generate stable activity flows. The regression results show that the positive effect of life functions on daytime vitality remains stable, with coefficients ranging from 0.078 to 0.098 and only minor fluctuations in effect intensity. By contrast, the coefficient range for nighttime expands to 0.005–0.256, indicating a significantly broader spatial influence. Taking Zhichu Street and Xingfu Street as the core area, the degree of influence gradually increases from the center to the surrounding areas. Although this region is characterized by a concentrated population distribution, its urban planning is relatively outdated and constrained by economic development, resulting in a lower overall provision of entertainment facilities and other life-function amenities than in the eastern part of the city. As a result, its attractiveness to residents is weaker, and its influence on urban vitality is less pronounced. This temporal variation reflects a shift in residents’ activity purposes. During the daytime, life functions are primarily oriented toward public services, and pedestrian flows remain relatively stable. At night, however, they are supplemented by leisure and entertainment demands, forming a complementary relationship with consumption-oriented functions such as dining and shopping, which enables life functions to exert a stronger driving effect on urban vitality over a broader spatial range.
Residential functions constitute the spatial foundation that accommodates residents’ nighttime return and stay. Their relationship with urban vitality follows markedly different patterns during the daytime and nighttime. During the daytime, residential areas serve as the starting point of population outflow; therefore, simply increasing residential density does not necessarily enhance urban vitality. Without supporting commercial and service facilities, high-density residential areas may instead become “sleeping towns” with weak vitality. At night, however, residents return home, and residential areas become the spatial basis for nighttime activities. The results indicate that although the residential function variable exhibits a relatively weak overall average effect, it still shows evident spatial heterogeneity and differentiation in certain areas, and the spatial distribution of this influence is broadly similar during both the daytime and nighttime. In areas around Hongrun Materials Market, Fruit Wholesale Market, Fenghuangtai Primary School, and Jinxiu Xincheng, residential functions are densely distributed, yet their relationship with urban vitality is negative. This suggests that adding more residential functions in these areas does not enhance urban vitality; instead, excessive residential concentration may inhibit nighttime social and consumption activities because of spatial congestion and a lack of supporting facilities. By contrast, in Shihuiyao Street, residential functions are positively associated with urban vitality, indicating that residential facilities in this area play a stronger role in supporting urban vitality and exert greater attraction for residents.
Building density reflects the intensity of development within a given area, and its underlying mechanism lies in providing the physical basis for population aggregation: higher building density indicates greater population-carrying capacity as well as a denser concentration of employment opportunities and commercial outlets. The results of this study show that building density exerts an overall positive effect on urban vitality during the daytime, with its influence gradually weakening from east to west, forming a clear concentric structure. In the western part of the city, the effect of building density on urban vitality is weaker than that in the eastern part, suggesting that increasing building density in western areas is less effective in enhancing urban vitality than in eastern areas. At night, however, the effect displays a bidirectional pattern. The influence of building density on urban vitality is negatively correlated in the western part of Xingfu Street near the Jiahe River and in the low-value clusters of Zhichu Street, with relatively small variations in magnitude. This diurnal difference stems from functional differentiation: during the daytime, high-density built-up areas concentrate office and commercial functions and serve as the primary zones of population inflow; at night, however, some high-density business districts experience a dispersal of people, and urban vitality shifts outward to surrounding residential areas. In this sense, high-density built-up areas function as centers of vitality aggregation during the day, whereas at night they become sources of vitality diffusion, promoting surrounding vitality through outward spillover.
Proximity measures the efficiency of road network connectivity and determines how conveniently residents can reach various types of destinations. Its core mechanism lies in reducing travel-time costs and expanding the spatial range of activities; higher proximity directly increases the likelihood and frequency of place visitation. The results of this study show that proximity is the second most important driving factor during the daytime, ranking only behind POI diversity, whereas its influence declines substantially at night. This marked day–night contrast reflects a fundamental shift in residents’ activity patterns. During the daytime, activities such as commuting, errands, and business affairs place relatively high demands on transportation and depend heavily on accessibility. At night, however, residents’ activities become more home-centered, the activity radius shrinks, and the main purposes of travel shift toward leisure and consumption, making residents significantly less sensitive to road network accessibility. In addition, proximity exhibits a bidirectional local effect: it has a strong positive association with urban vitality along the Jiahe River, as well as in Zhichu Street and Fenghuangtai Street, whereas it shows a weak negative association in sparsely populated areas north of Xingfu Street. This suggests that the vitality-driving effect of proximity depends on the presence of sufficient pedestrian demand.
DBC measures the proximity of each spatial unit to the city’s core commercial district, reflecting locational advantages in terms of access to employment opportunities, consumption settings, and economic externalities. Its underlying mechanism lies in agglomeration economies and consumer accessibility: the closer an area is to the commercial center, the denser the employment opportunities, the richer the consumption choices, and the more active the socioeconomic interactions, thereby attracting greater pedestrian flow. The results of this study show that the influence of DBC on daytime urban vitality decreases from south to north and exhibits a negative correlation. Areas in the south are farther from the commercial center and therefore have a weaker influence on urban vitality, whereas areas north of Kuiyu Road are closer to the commercial center and thus exert a stronger effect. At night, however, the relationship becomes positive, with two annular zones formed on the north and south sides of Hongqi Road, and the influence gradually increases from the center toward the surrounding areas. This day–night reversal reveals the underlying logic of spatial structure: during the daytime, the commercial center serves as the core destination for employment and consumption, driving inward population concentration; at night, residents return to homes distributed throughout the city, and residential areas farther from the commercial center instead experience increased vitality because of population return.
Walkability measures the pedestrian-friendliness of the street environment and serves as a key bridge between the physical space and human perception. Its distinctive mechanism lies not in directly generating pedestrian flows but in improving the walking experience, enhancing feelings of safety and comfort, prolonging pedestrian stay time, and facilitating social interaction, thereby contributing to urban vitality. In this study, walkability shows a stable positive effect on urban vitality during both the daytime and nighttime, indicating that its influence is global in nature and that pedestrian-friendly street environments generally enhance spatial vitality. During the daytime, the influence of walkability on urban vitality forms low-vitality zones in Zhujia Village and Fenghuangtai Street. This may be mainly because pedestrian flows near Zhujia Village are relatively limited and residents there have a lower reliance on sidewalks. In Fenghuangtai Street, building distribution is dense and the street layout is outdated; sidewalks are narrow and frequently encroached upon, resulting in limited support for vitality aggregation through non-motorized travel. At night, the influence of walkability gradually decreases from the southwest to the north, with a stronger effect in the southern part of the city and a relatively weaker effect in the north. This pattern is related to the distribution of pedestrian flows, transportation facilities, and regional development disparities in Yantai’s main urban area. Moreover, the effect of walkability is relatively stronger at night, reflecting the higher dependence of nighttime activities on perceived safety and environmental quality. Good lighting, continuous sidewalks, and well-defined street enclosure can effectively reduce the sense of insecurity during nighttime travel, thereby unlocking the potential of nighttime urban vitality.
Representative Areas and Urban Vitality Optimization Framework
To further illustrate the spatial heterogeneity identified by the MGWR analysis, representative neighborhoods with different urban spatial characteristics were selected for field investigation (Figures 8 and 9). These examples provide visual evidence of the spatial conditions associated with the analytical results.
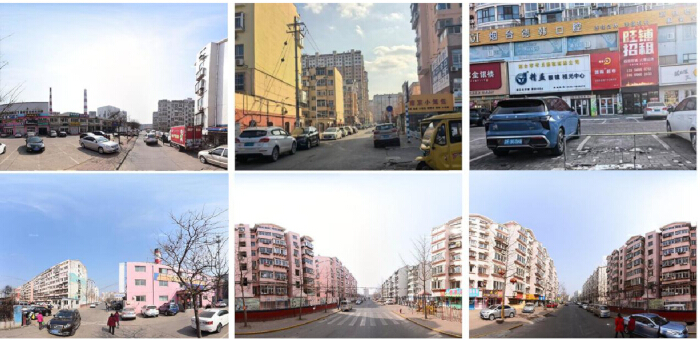
Figure 8. Existing conditions of old blocks in Xingfu New Town. Representative photographs show street and built-environment conditions, including uneven public facility distribution and limited street environmental quality. Please click here to view a larger version of this figure.
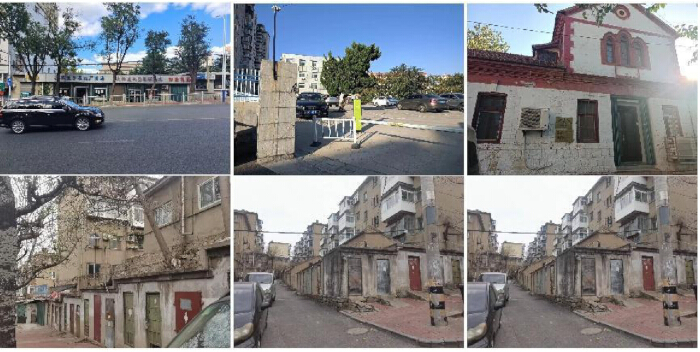
Figure 9. Existing conditions of old communities in Nangou Street-Jinde and Baishi-Huangshan. Representative photographs show dense residential housing, limited public open space, and current neighborhood environmental conditions. Please click here to view a larger version of this figure.
Figure 8 shows Xingfu New Town, a representative older neighborhood characterized by an uneven distribution of public service facilities and relatively poor street environmental quality. Figure 9 presents representative residential neighborhoods in the Nangou Street–Jinde and Baishi–Huangshan areas, which are characterized by dense residential development, limited public open space, and relatively monotonous street interfaces. These observed spatial characteristics are consistent with the analytical results describing differences in the effects of life functions and residential functions on urban vitality.
Figure 10 summarizes the relationships between the major dimensions of urban spatial structure and their influences on urban vitality. Based on the results of the MGWR analysis, the framework integrates the identified driving factors and their interactions to provide an overall conceptual representation of the mechanisms influencing daytime and nighttime urban vitality.

Figure 10. Optimization mechanism for urban spatial structure and vitality enhancement. The diagram summarizes vitality improvement strategies across functional elements, architectural form, accessibility, socioeconomic factors, ecological space, and human perception, with consideration of daytime and nighttime vitality differences. Please click here to view a larger version of this figure.
Data Availability:
All data supporting the findings of this study are provided within the article and its supplementary materials. These include Supplementary Figure 1; Supplementary Files 1–7, which describe the data collection, preprocessing, analytical workflows, model outputs, and regression diagnostics; Supplementary Codes 1–4, which contain the Python scripts and Jupyter notebooks used for data preprocessing and street-view image processing; and Supplementary Data 1–3, which provide the original, standardized, and processed urban spatial structure indicator datasets used in the analyses.
Supplementary Figure 1. Validation of heatmap-derived urban vitality using nighttime light intensity. Comparison of the spatial distribution of nighttime light intensity (left) and nighttime urban vitality derived from Baidu heatmap data (right). Representative hotspot areas are highlighted to demonstrate the spatial agreement between the two datasets, supporting the use of heatmap-derived activity intensity as a proxy for urban vitality in the study area. Please click here to download this file.
Supplementary File 1. Baidu heatmap data collection and processing workflow. This file describes the workflow for Baidu heatmap data acquisition, preprocessing, denoising, temporal classification, spatial transformation, kernel density estimation, and calculation of daytime and nighttime urban vitality at the 300 m × 300 m grid scale. Please click here to download this file.
Supplementary File 2. Urban spatial structure indicator definitions and calculation procedures. This file provides the definitions, computational equations, preprocessing procedures, parameter settings, and normalization methods for all urban spatial structure indicators used in the analysis, including functionality, architectural form, accessibility, socioeconomic characteristics, ecological space, and human perception. Please click here to download this file.
Supplementary File 3. Street-view image acquisition and analysis workflow. This file describes the street-view image sampling strategy, image acquisition parameters, panoramic image generation, semantic segmentation using the SegNet model, model validation, and calculation of the human-perception indicators derived from street-view imagery. Please click here to download this file.
Supplementary File 4. Multiscale geographically weighted regression (MGWR) modeling workflow. This file describes the MGWR modeling procedure, including data preprocessing, variable selection, multicollinearity assessment, model configuration, bandwidth optimization, parameter settings, model implementation, and comparison of ordinary least squares (OLS), geographically weighted regression (GWR), and MGWR model performance. Please click here to download this file.
Supplementary File 5. Daytime multiscale geographically weighted regression (MGWR) output. Complete daytime MGWR model output, including global regression statistics, bandwidth optimization, diagnostic metrics, parameter estimates, and summary statistics used to evaluate the spatial heterogeneity of daytime urban vitality. Please click here to download this file.
Supplementary File 6. Nighttime multiscale geographically weighted regression (MGWR) output. Complete nighttime MGWR model output, including global regression statistics, bandwidth optimization, diagnostic metrics, parameter estimates, and summary statistics used to evaluate the spatial heterogeneity of nighttime urban vitality. Please click here to download this file.
Supplementary File 7. Ordinary least squares (OLS) regression diagnostics and model evaluation. Diagnostic outputs for the OLS model, including multicollinearity assessment, regression diagnostics, residual analyses, and supporting plots used for comparison with geographically weighted regression models. Please click here to download this file.
Supplementary Code 1. Python workflow for Baidu heatmap data preprocessing. Python script used for preprocessing raw heatmap data, including duplicate removal, missing-value filtering, timestamp conversion, daytime/nighttime classification, coordinate standardization, and export of processed datasets for subsequent spatial analyses. Please click here to download this file.
Supplementary Code 2. Street-view image stitching workflow. Jupyter notebook implementing street-view image processing, including image stitching and panoramic image generation for subsequent streetscape analysis. Please click here to download this file.
Supplementary Code 3. Street-view image acquisition workflow. Jupyter notebook used to retrieve street-view images through the Baidu Street View application programming interface (API), organize image metadata, and prepare images for semantic segmentation. Please click here to download this file.
Supplementary Code 4. Street-view image processing workflow. Jupyter notebook used to process and integrate street-view imagery prior to extraction of the human-perception indicators. Please click here to download this file.
Supplementary Data 1. Original urban spatial structure indicator dataset. Raw indicator values compiled before preprocessing and standardization for all spatial units included in the study. Please click here to download this file.
Supplementary Data 2. Standardized urban spatial structure indicator dataset. Standardized predictor variables used as inputs for the multiscale geographically weighted regression analyses. Please click here to download this file.
Supplementary Data 3. Filtered and processed urban spatial structure indicator dataset. Quality-controlled dataset after preprocessing and variable screening, used for statistical analyses and model development. Please click here to download this file.
Discussion
Urban vitality in the main urban area of Yantai exhibits diverse clustering patterns and heterogeneous spatial influences that vary across locations, spatial ranges, and analytical scales. The present study demonstrates that urban vitality is shaped by a composite and nested spatial structure in which multiple dimensions of the built environment jointly influence residents’ daytime and nighttime activities. Using multisource geospatial big data and the MGWR model, this study identified substantial spatial heterogeneity in the effects of functionality, built form, accessibility, socioeconomic conditions, and human perception on urban vitality. Compared with traditional global regression approaches, the MGWR model more effectively captured the spatial non-stationarity of these relationships, providing a more refined understanding of the mechanisms underlying urban vitality. These findings indicate that strategies for cultivating urban vitality should be based on residents’ spatiotemporal activity needs and should adopt equitable, context-specific approaches that vary according to people, time, and place. Furthermore, effective vitality enhancement requires coordinated optimization of both global and local spatial structures while reducing inefficiencies, ineffective interventions, and negative effects associated with resource allocation and environmental constraints. Collectively, these findings provide an evidence-based framework for improving the effectiveness and precision of urban vitality enhancement strategies (Figure 10).
Among the functional elements examined, POI diversity, life functions, and residential functions were identified as the primary determinants of urban vitality. POI diversity exerted the strongest positive influence on urban vitality, consistent with the findings of Ye and Zhuang33 and Cetin et al.34, who demonstrated that mixed urban functions promote population aggregation and increase spatial vitality. In the present study, POI diversity showed a significant positive relationship with urban vitality throughout most of the main urban district during the daytime, whereas only weak negative associations were observed in peripheral areas. This pattern can be explained by the concentration of diverse residential, commercial, leisure, and service functions that create continuous chains of human activities and strengthen both temporal and spatial vitality. In contrast, peripheral districts characterized by single-function land use exhibit fragmented activity chains and reduced temporal use of urban space. This concentric differentiation is also consistent with previous studies by Fang et al.35 and Xu et al.36. Similar patterns have been reported in Beijing and Wuhan, where higher levels of functional integration are associated with stronger pedestrian and commercial vitality37,38. Unlike suburban residential districts in Beijing, which generally possess relatively complete supporting facilities, industrial areas such as Huangwu Street and Wanhua Industrial Park in Yantai lack sufficient everyday POIs, making the negative effects of functional monoculture more pronounced. Accordingly, increasing functional diversity through mixed residential-commercial development, community services, and public open spaces would likely improve vitality in these districts, while expanding nighttime commercial streets and night markets could further strengthen nighttime activity. Life functions also showed consistently positive effects on urban vitality during both daytime and nighttime, particularly in the eastern part of the city. Facilities related to education, healthcare, culture, recreation, transportation, and public services attract repeated daily visits and serve as important destinations for travel and social interaction. The spatial overlap of these facilities with commercial services further increases pedestrian stay duration and activity intensity, thereby sustaining urban vitality. These findings are consistent with Liu and Ge39, who emphasized the importance of public service provision in enhancing community vitality, as well as studies conducted in Nanjing and Wuhan demonstrating that balanced life-support facilities significantly increase residents’ activity intensity throughout the day40,41. Consequently, comprehensive urban renewal should prioritize improvements in both the quantity and quality of life-function facilities. As illustrated in Figure 8, older neighborhoods such as Xingfu Xincheng and surrounding urban villages continue to experience insufficient public services and relatively poor spatial quality. Improving access to education, healthcare, elderly care, public green spaces, and emergency infrastructure, together with the adaptive reuse of former industrial sites such as Zhichu Park into parks and public plazas, would contribute to stronger and more sustainable urban vitality. Residential functions displayed similar spatial patterns during both daytime and nighttime, generally showing weak negative relationships in areas with high concentrations of residential POIs. These areas are often characterized by dominant residential land use, limited public open space, insufficient commercial activities, and relatively few opportunities for social interaction, resulting in environments with strong residential attributes but relatively weak activity intensity. Chen et al.42 similarly demonstrated that urban infrastructure enhances vitality only when appropriate density is accompanied by continuous upgrading and renewal. Research conducted in high-density urban districts of Guangzhou also indicates that increasing residential development alone does not necessarily improve vitality unless supported by public services, commercial facilities, pedestrian infrastructure, and high-quality public spaces. As shown in Figure 9, many residentially concentrated neighborhoods continue to experience shortages of public spaces and inactive street frontages. Therefore, residentially dense districts would benefit from targeted improvements in public service facilities, optimization of residential functions, adoption of green building technologies, strengthened community governance, and careful planning of future residential development to improve both residential quality and urban vitality.
Beyond functional elements, the present study demonstrates that built form, accessibility, socioeconomic conditions, and human perception all contribute to the spatial heterogeneity of urban vitality. Building density emerged as an important determinant of neighborhood vitality. Consistent with the findings of Yang et al.43 in Chongqing, higher building density generally promotes population aggregation and economic activities, thereby enhancing neighborhood vitality. Similarly, the present study showed that the influence of building density increased gradually from west to east, reflecting the concentration of development and commercial activities in the northeastern core of Yantai’s main urban district. Previous studies in Guangzhou further demonstrated that although increasing building density initially promotes urban vitality, this relationship eventually reaches an optimal threshold beyond which additional density provides diminishing returns16. Likewise, studies conducted in Qingdao indicated that areas surrounding ecological spaces are unsuitable for excessively intensive development44 and that coastal linear or free-form spatial layouts often provide more attractive environments than highly compact urban forms. These findings suggest that building density should be optimized rather than maximized. Accordingly, local building density should be appropriately reduced in highly developed commercial and residential districts, including areas surrounding Yantai Railway Station and Haishang World, while increasing public green spaces and leisure areas. Historic districts such as Chaoyang Street and Suochengli should prioritize conservation of historic buildings and avoid excessive redevelopment, whereas development intensity along the coastal tourism belt and around Central Mountain Park should remain carefully controlled to preserve ecological and landscape resources while maintaining urban vitality. Accessibility also showed pronounced spatiotemporal heterogeneity. Consistent with previous studies45,46, daytime proximity exhibited a significant positive relationship with urban vitality, whereas its influence declined from south to north during nighttime hours. Because proximity reflects the connectivity of the road network and residents’ travel costs, higher accessibility facilitates frequent and multipurpose activities by reducing travel time. Previous studies have likewise shown that nighttime vitality is strongly associated with population density and transportation connectivity, particularly in densely developed urban areas47. Wei Wei et al.48 further demonstrated in Wuhan that highly connected road networks and well-developed slow-traffic systems substantially enhance neighborhood vitality, especially during nighttime. These findings suggest that future road network planning should adopt a “small blocks and dense street network” strategy. In older neighborhoods located near mountainous terrain, including Nangou Street–Jinde and Baishi–Hushan, improved connectivity through the elimination of dead-end roads and expansion of pedestrian, bicycle, and roadway infrastructure would strengthen accessibility and overall vitality. Similarly, transportation improvements in northern areas of Xingfu Street would further enhance nighttime vitality. Socioeconomic conditions represented by the DBC also exhibited clear day–night heterogeneity. During the daytime, lower DBC values were associated with stronger population aggregation and higher urban vitality, whereas nighttime vitality showed the opposite pattern, consistent with the findings reported by Wang et al.49 This difference reflects the contrasting spatial organization of daytime commuting and shopping activities compared with nighttime leisure and residential activities. During the daytime, the city’s commercial core functions as the principal destination for employment and consumption, producing strong vitality concentration. At night, however, leisure activities become more dispersed, while peripheral residential areas experience increased vitality as residents return home. This pattern also reflects the imbalance between jobs and housing under Yantai’s predominantly monocentric commercial structure. Consistent with Bianchini’s theory of the nighttime economy50, establishing diversified nighttime commercial activities represents an effective strategy for strengthening vitality in suburban districts. Accordingly, suburban areas such as Huangwu Subdistrict would benefit from the development of secondary commercial centers, diversified nighttime consumption opportunities, and improved transportation links between suburban residential areas and the city center, thereby promoting more balanced vitality throughout the urban area. Finally, human perception, represented by walkability, consistently exerted a positive influence on urban vitality during both daytime and nighttime. Geurs et al.51 demonstrated that higher walkable accessibility increases residents’ willingness to undertake spontaneous walking trips, thereby promoting neighborhood vitality. Mahmood et al.52 further emphasized that nighttime urban activities depend heavily on transport accessibility, pedestrian comfort, and perceived safety, making high-quality walking environments essential for sustaining nighttime vitality. The present findings similarly indicate that daytime walking activity is primarily influenced by facility accessibility, whereas nighttime vitality depends more strongly on environmental comfort, continuity of pedestrian routes, and perceived safety. Si Rui et al.53 likewise reported that safer pedestrian environments promote nighttime vitality, whereas diverse street interfaces enhance daytime vitality. In Yantai, fragmented pedestrian facilities and severe pedestrian–vehicle conflicts remain common in older neighborhoods, limiting the release of all-day vitality. Therefore, future planning should prioritize continuous sidewalks, barrier-free pedestrian facilities, safer crossings, richer street interfaces, improved lighting, and enhanced nighttime environmental quality to extend residents’ outdoor activities, promote social interaction and commercial activity, and strengthen both daytime and nighttime urban vitality. Figure 10 summarizes the proposed optimization strategies derived from these findings.
Overall, the present study advances the understanding of urban vitality by integrating multisource geospatial big data with the MGWR model to quantify how multiple dimensions of urban spatial structure influence vitality across different spatial scales and time periods. Unlike conventional global regression models, the MGWR approach allows each explanatory variable to operate at its own spatial scale, thereby revealing substantial spatial non-stationarity in the relationships between functionality, built form, accessibility, socioeconomic conditions, human perception, and urban vitality. This analytical framework not only improves the interpretation of the mechanisms underlying urban vitality but also provides practical guidance for evidence-based urban planning and governance. Rather than applying uniform planning interventions throughout the city, the findings support differentiated optimization strategies tailored to local functional characteristics, development intensity, transportation accessibility, socioeconomic context, and pedestrian environments. Consequently, the proposed framework has potential applications in urban renewal, neighborhood regeneration, public space optimization, transportation planning, and the development of sustainable daytime and nighttime economies. By identifying where and how different spatial elements influence vitality, the study provides a scientific basis for implementing precise, people-oriented planning strategies that improve urban spatial quality while promoting balanced and sustainable urban development.
Although the present study establishes an analytical framework for investigating urban vitality using multisource geospatial data and the MGWR model, several limitations should be acknowledged. First, the temporal coverage of the analysis was limited to Heat Map data collected over five consecutive weekdays, which does not capture variations in residents’ behavioral patterns during weekends, holidays, or different seasons and therefore limits the completeness of the temporal analysis. Second, although Heat Map data provide extensive spatial coverage through a large user base, they inevitably contain sampling bias and cannot fully represent the entire urban population, resulting in limitations in sample representativeness. Third, the study focused exclusively on the main urban area of Zhifu District, Yantai; consequently, the findings are closely associated with the characteristics of the local built environment, and their applicability to other urban contexts, including mountainous cities, suburban areas, coastal cities, and megacities, requires further verification through comparative studies. Fourth, the present analysis examined only the influence of urban spatial structure on urban vitality, whereas the potential bidirectional interactions between urban vitality and spatial structure were not investigated. Finally, although the MGWR model effectively captures spatial non-stationarity, it remains fundamentally based on linear assumptions and therefore may not fully characterize the complex nonlinear relationships and interaction effects among urban vitality, human activities, and spatial elements. These limitations provide important directions for further methodological refinement and broader application of the proposed analytical framework.
Future research can extend the present work in several directions. Incorporating Heat Map data collected during weekends, holidays, and different seasons would enable long-term dynamic monitoring of urban vitality and provide a more comprehensive understanding of its spatiotemporal evolution. Comparative analyses across different urban types—including mountainous cities, plain cities, coastal cities, suburban areas, and megacities—would help distinguish universal mechanisms from region-specific characteristics and improve the generalizability of the findings. In addition, integrating socioeconomic information, including population structure, industrial distribution, employment characteristics, and residents’ income, would facilitate a more comprehensive interpretation of the mechanisms underlying urban vitality formation. Future studies may also combine multiple data sources, such as mobile phone signaling data and high-frequency consumption records, with machine learning and other nonlinear analytical approaches to better capture the complex interactions among urban spatial structure, human behavior, and urban vitality. Furthermore, the analytical framework developed in this study has considerable practical value for urban renewal, neighborhood regeneration, public space optimization, and refined urban governance, particularly in aging communities, suburban districts, and areas with relatively weak commercial vitality. By providing quantitative evidence for differentiated planning strategies based on local spatial characteristics, this framework can support more precise, people-oriented, and sustainable urban development. Overall, this study demonstrates that integrating multisource geospatial big data with the MGWR model provides an effective approach for revealing the spatial heterogeneity of urban vitality and offers valuable scientific support for optimizing urban spatial structure and enhancing urban vitality through evidence-based planning and governance.
Disclosures
Conflict of Interest:
The authors declare that they have no conflicts of interest related to the research, authorship, or publication of this article.
Acknowledgements
This research was supported by the Youth Innovation Team Project in Universities of Shandong Province (Grant No. 2022RW026); the National Natural Science Foundation of China (Grant No. 42377207); the Shandong Provincial Humanities and Social Sciences Project (Grant No. 2022-YYGL-31); the Shandong Taishan Scholar Young Expert Program (Grant No. tsqn202306240); the General Project of Undergraduate Teaching Reform in Shandong Province (Grant No. Z2021177); the Key Research and Development Program of Shandong Province (Grant No. 2022RKY07006); the Foundation of School–Land Integration Development in Yantai (Grant No. 2021XDRHXMQT18); the Open Foundation of the State Key Laboratory of Lake Science and Environment (Grant No. 2022SKL005); the Open Foundation of the State Key Laboratory of Loess and Quaternary Geology, Institute of Earth Environment, Chinese Academy of Sciences (Grant No. SKLLQG2024); and the Youth Innovation Team Project for Talent Introduction and Cultivation in Universities of Shandong Province (Grant No. SKLLQG2024).
Materials
| Name | Company | Catalog Number | Comments |
|---|---|---|---|
| ArcGIS | Esri | Version 10.4 (RRID: SCR_011081) | Geographic information system software used for spatial analysis and map visualization |
| Baidu Maps API | Baidu, Inc. | Version 3.0 | Used to acquire heat map, point of interest (POI), and street-view image data |
| MGWR | Arizona State University | Version 2.2 | Software used for multiscale geographically weighted regression analysis |
| National Basic Geographic Information Center Land-use Dataset | National Basic Geographic Information Center | https://www.gscloud.cn/search | Source of land-use data |
| NPP-VIIRS Nighttime Light Dataset | Harvard Dataverse | DOI: 10.7910/DVN/YGIVCD | Used to validate heat map-derived urban vitality patterns |
| OpenCV | OpenCV | Version 4.5.5 | Used for panoramic image stitching and image processing |
| OpenStreetMap | OpenStreetMap Foundation | https://www.openstreetmap.org | Source of building footprint and road network data |
| Python | Python Software Foundation | Version 3.8 (RRID: SCR_008394) | Used for data acquisition, preprocessing, and analysis |
| SegNet | University of Cambridge | PyTorch implementation (Version 1.0) (RRID: SCR_017042) | Deep-learning semantic segmentation network used for streetscape feature extraction |
| Spatial Design Network Analysis (sDNA) | Cardiff University | Version 4.0 | Used to calculate road-network accessibility metrics |
References
- Jin X, et al. Evaluating cities' vitality and identifying ghost cities in China with emerging geographical data. Cities. 2017;63:98-109.
- Montgomery J. Making a city: Urbanity, vitality and urban design. J Urban Des. 1998;3(1):93-116.
- Zhang W. Theoretical basis and methods of city health examination evaluation in China. Sci Geogr Sin. 2021;41(10):1687-1696.
- Jacobs J. The Death and Life of Great American Cities. Random House; New York; 1992.
- Maas PR. Towards a Theory of Urban Vitality. University of British Columbia; Vancouver; 1984.
- Sulis P, Manley E, Zhong C, Batty M. Using mobility data as proxy for measuring urban vitality. J Spat Inf Sci. 2018;16:137-162.
- Jia C, et al. Evaluation of urban vibrancy and its relationship with the economic landscape: A case study of Beijing. ISPRS Int J Geo-Inf. 2021;10(2):72.
- Kim YL. Seoul's Wi-Fi hotspots: Wi-Fi access points as an indicator of urban vitality. Comput Environ Urban Syst. 2018;72:13-24.
- Yue H, Zhu X. Exploring the relationship between urban vitality and street centrality based on social network review data in Wuhan, China. Sustainability. 2018;11(16):4356.
- Zhang L, Chiaradia A. Three-dimensional spatial network analysis and its application in a high-density city area, Central Hong Kong. Urban Plan Int. 2019;34(1):46-53.
- Feng D, Tu L, Sun Z. Research on population spatiotemporal aggregation characteristics of a small city: A case study of Shehong County based on Baidu Heat Maps. Sustainability. 2019;11(22):6276.
- Ye Y, Li D, Liu X. How block density and typology affect urban vitality: An exploratory analysis in Shenzhen, China. Urban Geogr. 2018;39(4):631-652.
- Liu M, Jiang Y, He J. Quantitative evaluation on street vitality: A case study of Zhoujiadu Community in Shanghai. Sustainability. 2021;13(6):3027.
- Wang B, et al. Elaborating spatiotemporal associations between the built environment and urban vibrancy: A case of Guangzhou City, China. Chin Geogr Sci. 2022;32:480-492.
- Hu C, et al. Research on the spatiotemporal pattern and influencing mechanism of coastal urban vitality: A case study of Bayuquan. Buildings. 2024;14(7):2173.
- Wang C, Wang B, Wang Q, Lei Y. Nonlinear associations between urban vitality and built environment factors and threshold effects: A case study of central Guangzhou City. Prog Geogr. 2023;42(1):79-88.
- Huang LS, Han Y, Ye Y. Coastal waterfront vibrancy: An exploration from the perspective of quantitative urban morphology. Buildings. 2022;12(10):1585.
- Yue W, Chen Y, Zhang Q, Liu Y. Spatially explicit assessment of urban vitality using multi-source data: A case of Shanghai, China. Sustainability. 2019;11(3):638.
- Pan J, Zhu X, Zhang X. Urban vitality measurement and influence mechanism detection in China. Int J Environ Res Public Health. 2022;20(1):46.
- Zeng Z, Li Y, Tang H. Multidimensional spatial driving factors of urban vitality evolution at the subdistrict scale of Changsha City, China, based on the time series of human activities. Buildings. 2023;13(10):2448.
- Xia X, Zhang Y, Zhang Y, Rao T. The spatial pattern and influence mechanism of urban vitality: A case study of Changsha, China. Front Environ Sci. 2022;10:942577.
- Ye Y, Zhuang Y, Zhang L, Nes A. Designing urban spatial vitality from a morphological perspective: A study based on quantified urban morphology and activities' testing. Urban Plan Int. 2016;31(1):26-33.
- Long Y, Ye Y. Human-scale urban form: Measurements, performances, and urban planning and design interventions. South Architecture. 2016;(5):41-47.
- Shen T, Li F, Chen Z. The evaluation of urban vitality and spatial correlation based on multi-source data: A case study of the main urban area of Changzhou. Resour Environ Yangtze Basin. 2022;31(5):1006-1015.
- Liu Y, Zhao P, Liang J. A study of urban vitality based on location-based service data: A case study of the area within the Sixth Ring Road of Beijing. Areal Res Dev. 2018;37(6):64-69.
- Zhang F, Liu Q, Zhou X. Vitality evaluation of public spaces in historical and cultural blocks based on multi-source data: A case study of Suzhou Changmen. Sustainability. 2022;14(21):14040.
- Gong Z, Ma Q, Kan C, Qi Q. Classifying street spaces with street view images for a spatial indicator of urban functions. Sustainability. 2019;11(22):6424.
- Ye Y, Zhang L, Yan W, Zeng W. Measuring street greening quality from a humanistic perspective: A large-scale analysis based on Baidu street view images and machine learning algorithms. Landscape Architecture. 2018;25(8):24-29.
- Penn A, Hillier B, Banister D, Xu J. Configurational modelling of urban movement networks. Environ Plann B Plan Des. 1998;25(1):59-84.
- Ye Y, et al. Measuring daily accessed street greenery: A human-scale approach for informing better urban planning practices. Landsc Urban Plan. 2019;191:103434.
- Moran PAP. Notes on continuous stochastic phenomena. Biometrika. 1950;37(1-2):17-23.
- Yang L, Jiao H. Spatiotemporal changes in ecosystem services value and its driving factors in the Karst region of China. Sustainability. 2022;14(11):6695.
- Ye Y, Zhuang Y. A hypothesis of urban morphogenesis and urban vitality in newly built-up areas: Analyses based on street accessibility, building density and functional mixture. Urban Plan Int. 2017;32(2):43-49.
- Cetin M, et al. Evaluation of thermal climatic region areas in terms of building density in urban management and planning for Burdur, Turkey. Air Qual Atmos Health. 2019;12(9):1103-1112.
- Fang C, He S, Wang L. Spatial characterization of urban vitality and the association with various street network metrics from the multi-scalar perspective. Front Public Health. 2021;9:677910.
- Xu Q, Zhou X, Zhou S. Identifying urban fringe boundaries and evaluating urban vitality using multi-source data: A case study of Hangzhou's central urban area. Urban Dev Stud. 2024;31(1):80-88.
- Hao X, Long Y, Shi M, Wang P. Street vibrancy of Beijing: Measurement, impact factors and design implication. Shanghai Urban Plan Rev. 2016;(3):9.
- Zeng C, Song Y, He Q, Shen F. Spatially explicit assessment on urban vitality: Case studies in Chicago and Wuhan. Sustain Cities Soc. 2018;40:296-306.
- Liu S, et al. Urban vitality assessment at the neighborhood scale with geo-data: A review toward implementation. J Geogr Sci. 2023;33(7):1482-1504.
- Tang L, Xu H, Ding Y. Comprehensive vitality evaluation of urban blocks based on multi-source geographic big data. J Geo-Inf Sci. 2022;24(8):1575-1588.
- Yang W, Ren Z, He J. Analysis of spatial disparity based on supply and demand service level of life service facilities: A case of Jianghan District in Wuhan City. Geomat Inf Sci Wuhan Univ. 2024;49(3):473-481.
- Chen Z, Dong B, Pei Q, Zhang Z. The impacts of urban vitality and urban density on innovation: Evidence from China's Greater Bay Area. Habitat Int. 2022;119:102490.
- Yang FF, et al. Understanding urban vitality from the economic and human activities perspective: A case study of Chongqing, China. Chin Geogr Sci. 2024;34(1):52-66.
- Sun X, Yuan Y, Wang J, Dong Q. Research on the influence factors and spatial characteristics of urban coastal space vitality via multi-scale geographically weighted regression: A case study of Tsingtao East Coast. J Qingdao Agric Univ (Soc Sci). 2024;36(1):50-58.
- De Vries S, et al. Local availability of green and blue space and prevalence of common mental disorders in the Netherlands. BJPsych Open. 2016;2(6):366-372.
- Chen Y, et al. Emerging social media data on measuring urban park use. Urban For Urban Green. 2018;31:130-141.
- Li Z, Zhao G. Revealing the spatiotemporal heterogeneity of the association between the built environment and urban vitality in Shenzhen. ISPRS Int J Geo-Inf. 2023;12(10):433.
- Wei W, Zhang Y, Hong M, Xia J. Influence of the built environment on outdoor space fitness vitality and its heterogeneity: A case study of the Wuhan urban area. Prog Geogr. 2024;43(1):93-109.
- Wang B, Lei Y, Wang C, Wang L. The spatiotemporal impacts of the built environment on urban vitality: A study based on big data. Sci Geogr Sin. 2022;42(2):274-283.
- Bianchini F. Night cultures, night economies. Plan Pract Res. 1995;10(2):121-126.
- Geurs KT, Krizek KJ, Reggiani A. Accessibility Analysis and Transport Planning. Edward Elgar Publishing; Cheltenham; 2012.
- Mahmood A, et al. A photovoice documentation of the role of neighborhood physical and social environments in older adults' physical activity in two metropolitan areas in North America. Soc Sci Med. 2012;74(8):1180-1192.
- Si R, Lin Y, Xiao Z, Ye Y. Spatiotemporal analysis of the relationship between the built environment and street vitality based on street-level imagery: A case study of Futian District, Shenzhen. Sci Geogr Sin. 2021;41(9):1536-1545.