Diabetic nephropathy (DN) involves mitochondrial dysfunction. Using transcriptomics, network pharmacology, and machine learning, we identified CAT, FABP1, MAOA, and MAOB as candidate mitochondria-related biomarkers for Ligustri Lucidi Fructus. In db/db mice, LLF upregulated CAT and MAOA, supporting further mechanistic investigation.
Research Article
Identifying Mitochondria-Related Candidate Biomarkers of Ligustri Lucidi Fructus in Diabetic Nephropathy
In This Article
Summary
Abstract
Mitochondrial dysfunction and excessive oxidative stress within mitochondria are key pathological factors driving renal tubular injury in diabetic nephropathy (DN). Although Ligustri Lucidi Fructus (LLF) is traditionally used to treat DN, the mechanisms involved, particularly those relating to mitochondria-associated genes and pathways, remain poorly understood. This study used differential expression analysis of the GSE142025 dataset to identify differentially expressed genes (DEGs) related to DN. Feature genes were selected by cross-referencing the outputs of four machine learning models. Genes that showed significant differential expression and consistent expression patterns in both datasets were further evaluated by receiver operating characteristic (ROC) curve analysis. Those with an area under the curve (AUC) > 0.7 in both datasets were defined as candidate biomarkers. Functional enrichment, immune infiltration, network construction, and molecular docking analyses were performed. A DN mouse model was used to assess blood glucose, urinary microalbumin, histopathology, and RT-qPCR expression of the candidate biomarkers. CAT and MAOA were significantly upregulated in vivo. Candidate biomarkers were enriched in pathways related to ribosome function, valine, leucine, and isoleucine degradation, cytokine-cytokine receptor interactions, and peroxisomes. They were negatively correlated with CD8+ T cells and activated mast cells and positively correlated with activated NK cells and naïve B cells. Taxifolin, beta-sitosterol, and eriodictyol showed binding energies below -5 kcal/mol with the candidate biomarkers. CAT and MAOA are promising candidates that warrant further mechanistic investigation.
Introduction
Diabetic nephropathy (DN), the leading cause of end-stage renal disease worldwide, is one of the most common complications of diabetes mellitus. Pathologically, it is characterized by excessive extracellular matrix accumulation in both the glomerular and tubular compartments, along with thickening and sclerosis of intrarenal blood vessels2. DN is commonly associated with proteinuria and hypertension3. Its development is closely linked to vascular endothelial cell damage, an exacerbated inflammatory response, and heightened oxidative stress resulting from prolonged hyperglycemia4. The incidence of DN is rising worldwide, particularly among middle-aged and elderly diabetic individuals. As the disease progresses, it can lead to end-stage renal failure and even cardiovascular complications, significantly impairing patients' quality of life and prognosis5. Despite advances in diagnostic and therapeutic approaches for DN, early and accurate candidate biomarkers for diagnosis remain elusive, and effective treatment strategies to reverse the pathological processes are still lacking. Hence, there is an urgent need for the development of novel, targeted anti-DN drugs.
Mitochondria are critical for cellular bioenergetics, metabolic precursor synthesis, calcium homeostasis, reactive oxygen species (ROS) production, immune signaling, and apoptosis, all of which are essential for maintaining cellular and organismal stability6. As the cell's powerhouses, mitochondria play a pivotal role in fundamental processes such as glycolysis, the tricarboxylic acid cycle, and oxidative phosphorylation7. Obesity disrupts the Krebs cycle and mitochondrial respiratory chain, leading to mitochondrial dysfunction and increased ROS production. Elevated ROS levels in the mitochondrial respiratory chain can induce oxidative stress, which exacerbates the inflammatory response associated with obesity and promotes apoptosis8. Recent research has highlighted the significant role of mitochondrial dysfunction in the pathogenesis and progression of DN, including disturbances in energy metabolism, excessive ROS generation, and heightened apoptosis signaling9. Chronic mitochondrial dysfunction accelerates kidney disease progression10. Thus, improving mitochondrial function could represent a crucial protective strategy against DN.
Ligustri Lucidi Fructus (LLF) is a dried, ripe fruit from the Luteaceae family that is renowned for its liver- and kidney-nourishing properties, as well as its ability to darken hair and improve vision. A naturally occurring heteropolysaccharide extracted from LLF has been identified, revealing its potential to protect the kidneys from fibrosis11. In recent years, there has been increasing attention to the use of LLF in the treatment of DN, with notable renoprotective effects demonstrated11,12,13. Furthermore, the intricate relationship between LLF and mitochondria has been extensively researched and validated. Notably, a study has shown that LLF exerts its beneficial effects by modulating mitochondrial function through activation of the AMPK signaling pathway14. This mechanism effectively protects mitochondria against damage caused by oxidative stress. These findings further emphasize the vital role of LLF in maintaining cellular energy metabolism and improving cells' resilience to oxidative stress. However, the precise therapeutic mechanism, particularly regarding the recovery of mitochondrial function, remains poorly understood.
The aim of this study was to elucidate the biological mechanisms underlying LLF's therapeutic effect on mitochondrial function in DN. Public databases were searched using bioinformatics tools to identify candidate biomarkers associated with the renal-protective effects of LLF, integrating transcriptomic data and active-ingredient information. Further analyses, including immune infiltration, association with clinical features, m6A RNA modification, functional enrichment, regulatory network construction, and molecular docking, suggested that these candidate biomarkers play a pivotal role in regulating mitochondrial function during DN treatment. In vivo validation further confirmed their significance. This comprehensive analysis deepens our understanding of the mechanisms by which LLF treats DN and provides a solid foundation for developing novel therapeutic targets based on mitochondrial dysfunction.
Protocol
Data collection
The gene expression matrix and the corresponding clinical data for the GSE142025 and GSE96804 datasets, which are related to DN, were retrieved from the Gene Expression Omnibus (GEO) database (https://www.ncbi.nlm.nih.gov/geo/)15. The training set (GSE142025) included kidney tissue samples from 27 patients with DN and nine controls, which were sequenced using the GPL20301 platform. The validation set (GSE96804) comprised sequencing data from 41 DN patients and 20 controls, processed using the GPL17586 platform. Both datasets focus on kidney tissue; the GSE96804 dataset specifically examines the glomerulus, the kidney's primary filtration unit (Figure 1). The GSE142025 dataset (training set) comprises whole kidney tissue samples and provides an extensive overview of the transcriptomic landscape of DN. The GSE96804 dataset (validation set), on the other hand, focuses specifically on glomerular tissue, which is the primary site of glomerular filtration injury. As these two datasets were not directly merged due to differences in platform and tissue, batch effect correction was not applied. Instead, cross-dataset validation was performed independently. Genes with consistent directional changes and an area under the curve (AUC) greater than 0.7 in both datasets were selected as robust candidates, supporting generalizability across kidney compartments.
A total of 1,136 mitochondria-related genes (MRGs) were extracted from the MitoCarta3.0 database (https://www.broadinstitute.org/mitocarta). The active ingredients of LLF were predicted using the Traditional Chinese Medicine Systems Pharmacology (TCMSP) database (http://sm.nwsuaf.edu.cn/lsp/tcmsp.php), based on an oral bioavailability (OB) threshold of ≥30% and a drug-likeness (DL) threshold of ≥0.18. Subsequently, potential target genes for the active constituents were predicted using the Swiss Target Prediction database (http://www.swisstargetprediction.ch/).
Differential expression analysis
Differential expression analysis of GSE142025 (DN vs. control) was performed using the limma package (v3.54.1), with significance criteria set at P.adj < 0.05 and |log2FoldChange| > 0.516 . Volcano plots and heat maps were visualized using the ggplot2 (v 3.3.6) and ComplexHeatmap (v 2.14.0) packages17,18, respectively. DEGs, MRGs, and potential target genes of the active ingredients were intersected, and the overlapping genes were defined as candidate genes. The network linking the active ingredients and candidate genes was constructed using Cytoscape software (v 3.9.0)19.
Functional enrichment analysis and protein-protein interaction (PPI) network construction
Gene Ontology (GO) and Kyoto Encyclopedia of Genes and Genomes (KEGG) enrichment analyses for candidate genes were performed using the clusterProfiler package (v 4.6.2) to explore their biological functions and associated signaling pathways (P.adjust < 0.05). The candidate genes were then input into the STRING database (https://cn.string-db.org/) to retrieve PPI relationships (confidence level ≥ 0.4), followed by the construction of a PPI network using Cytoscape (v 3.9.0)20.
Machine learning
Four machine-learning algorithms, including random forest (RF), k-nearest neighbor (KNN), partial least squares (PLS), and support vector machine with a radial basis kernel (SVM), were implemented using the caret package (v6.0-93) based on the GSE142025 dataset. The candidate genes identified in the preceding analysis were used as predictor variables, and disease status (DN or control) was used as the outcome. For the KNN model, 10-fold cross-validation was implemented using the trainControl function, with tuneLength = 10. The RF model was fitted with 20 trees (ntree = 20); the PLS and SVM models were fitted using the settings implemented in the original caret workflow.
Model residual distributions were evaluated using the DALEX package (v2.4.3). Permutation-based variable assessment was subsequently performed using the DALEX variable_importance function, with root mean square error (RMSE) specified as the loss function. The resulting dropout_loss represents the RMSE obtained after permutation of the corresponding variable21,22. In the original analytical workflow, variables with a dropout loss < 0.281 across all models were retained, and genes common to all four models were defined as consensus feature genes for subsequent validation.
The four machine-learning models were used primarily for feature prioritization rather than for constructing a final clinical classifier. Accordingly, diagnostic discrimination was subsequently evaluated at the individual-gene level using ROC analysis in both the discovery and validation datasets.
Identification of candidate biomarkers
In GSE142025 and GSE96804, expression differences in feature genes between DN and control samples were evaluated using the Wilcoxon test. Only genes with significant differential expression (P < 0.05) and concordant expression trends across the two datasets were selected for receiver operating characteristic (ROC) curve analysis. The pROC package (v1.18.0) was used to generate ROC curves and calculate the area under the curve (AUC), with genes showing AUC > 0.7 in both datasets classified as candidate biomarkers23.
Gene set enrichment analysis (GSEA)
The biological functions and signaling pathways associated with the candidate biomarkers were further explored using GSEA on the GSE142025 dataset. First, Spearman correlation analysis of candidate biomarkers with all other genes was performed using the psych package (v2.2.9)24. Correlation coefficients were calculated and ranked (from high to low). The reference gene set was c2.cp.kegg.v2023.1.Hs.symbols.gmt from the Molecular Signatures Database (MSigDB, https://www.gsea-msigdb.org/gsea/msigdb/). GSEA was then conducted to evaluate the enrichment of ranked genes in the background gene set using the clusterProfiler package (v4.6.2). Multiple testing correction was applied via the FDR method, and adjusted P-values (denoted as P.adjust) were considered significant if < 0.05.
M6A modification analysis
To investigate RNA methylation modifications of candidate biomarkers, the SRAMP database (http://www.cuilab.cn/sramp/) was utilized to predict m6A modification sites on candidate biomarkers, focusing on high-confidence positions within their secondary structures. The ENCORI database (https://starbase.sysu.edu.cn/) was then used to identify m6A-modified proteins that interact with candidate biomarkers, using the |HepG2 (shRNA)| > 1 parameter to screen key proteins. The RPISeq database (http://pridb.gdcb.iastate.edu/RPISeq/) was subsequently used to predict the likelihood of interactions between key proteins and candidate biomarkers. RNA sequences for both were uploaded in plain text format to generate RF and SVM classifier prediction scores. An interaction was considered significant when the score exceeded 0.525. SRAMP analysis was performed with the ‘High’ threshold for m6A site prediction, using ‘Transcript’ mode and default parameters. ENCORI analysis used the ‘miRNA-mRNA’ interaction function with the ‘HepG2 (shRNA)’ parameter > 1. RPISeq analysis used the RF classifier with default parameters; scores > 0.5 indicated positive interaction. These are computational predictions, not experimental evidence of m6A modification or RNA-protein interactions in kidney tissue. The HepG2 shRNA criterion was derived from ENCORI’s precomputed datasets and may not reflect renal-specific regulation.
Immune infiltration analysis
The CIBERSORT algorithm was applied to estimate the proportions of 22 immune cell types in both control and DN samples from GSE142025, with visualization via a heatmap generated using the ggplot2 package (v3.3.6)26. CIBERSORT was run using the LM22 signature matrix, with 1,000 permutations and quantile normalization disabled (as recommended for microarray data). Samples with CIBERSORT p < 0.05 were retained for further analysis. CIBERSORT estimates immune cell fractions from bulk kidney tissue expression, which cannot resolve compartment-specific infiltration (e.g., glomerular vs. tubulointerstitial) nor distinguish infiltrating leukocytes from resident immune cells. Thus, the reported correlations are at the tissue level and should be validated by spatial methods. Spearman's correlation analysis between differentially abundant immune cells and candidate biomarkers was performed using the psych package.
Construction of networks and molecular docking
MicroRNAs (miRNAs) interacting with candidate biomarkers were predicted using the miRNet database (https://www.mirnet.ca). Subsequently, long noncoding RNAs (lncRNAs) targeting the identified miRNAs were predicted through the TarBase (http://www.diana.pcbi.upenn.edu/tarbase) and starbase (http://starbase.sysu.edu.cn/) databases. lncRNAs common to both databases were selected for network construction. A lncRNA-miRNA-mRNA regulatory network was then built using Cytoscape software. Potential active ingredients targeting candidate biomarkers were chosen to construct an active ingredient-biomarker network. Additionally, active ingredients, candidate biomarkers, and pathways identified in GSEA were incorporated into Cytoscape to create an active ingredient-biomarker-pathway network.
Molecular docking analysis was performed to assess the binding affinity between potential active ingredients and candidate biomarkers. The 3D structures of biomarker proteins were obtained from the Research Collaboratory for Structural Bioinformatics Protein Data Bank (RCSB PDB, https://www.rscb.org/pdb) in PDB file format. The 2D structures of potential active ingredients were retrieved in SDF format from the PubChem database (http://pubchem.ncbi.nlm.nih.gov). Molecular docking was conducted using the CB-Dock platform (http://clab.labshare.cn/cb-dock/php/blinddock.php). A binding energy of less than -5 kcal/mol indicated a strong binding affinity27.
Preparation and authentication of Ligustri Lucidi Fructus
Here, Ligustri Lucidi Fructus (LLF) refers to the dried ripe fruit of Ligustrum lucidum W. T. Aiton (Oleaceae). The botanical material was authenticated according to the Chinese Pharmacopoeia, and a voucher specimen No. 20240506,20240911,20241103 was deposited at Shanxi University of Traditional Chinese Medicine.
For decoction preparation, 200 g of qualified LLF slices were soaked in 1,000 mL of distilled water for 30 min at room temperature. The mixture was boiled vigorously and then simmered gently for 60 min. The filtrate was collected, and the residual herb materials were decocted repeatedly with another 1,000 mL of distilled water for 60 min. The two filtrates were combined, filtered, centrifuged, and concentrated under reduced pressure to obtain a final stock concentration of 1 g of crude drug/mL (total volume of 100 mL). The prepared decoction was stored at 4 °C for short‑term use or −20 °C for long‑term preservation. The quality of LLF and its decoction was strictly identified and verified according to the standards of the Chinese Pharmacopoeia to ensure experimental reliability and reproducibility.
For qualitative identification, thin-layer chromatography was performed. Briefly, an appropriate volume of prepared decoction was centrifuged, and the supernatant was extracted with methanol. After filtration, the sample solution and specnuezhenide reference standard solution were spotted on the same silica gel G plate. After developing, drying, and inspecting under ultraviolet light, the spot of the sample solution showed consistent color and position with the reference compound, confirming the existence of the characteristic bioactive component of LLF.
For quantitative quality control, high‑performance liquid chromatography detection was carried out. The analysis was performed using a C18 column with methanol–water as the mobile phase. The detection wavelength was set at 224 nm. The content of specnuezhenide in the decoction was determined based on the standard curve. The results demonstrated stable and uniform chemical composition of the prepared decoction, ensuring consistent drug quality throughout the animal intervention experiment.
Animal experiments
Twelve SPF-grade male db/db mice (8–9 weeks old) and six age-matched db/m mice were maintained in the SPF animal facility of Shanxi University of Traditional Chinese Medicine. Before the experiments, the animals were acclimated for 7 days under a 12 h light/12 h dark cycle with ad libitum access to food and water. The study was approved by the Ethics Committee of Shanxi University of Traditional Chinese Medicine (Approval No. 2022DW167). Animals exhibiting >20% body weight loss, a moribund condition, or an inability to access food or water were humanely euthanized before the planned study endpoint. At the end of the study, all remaining mice were euthanized by intraperitoneal injection of pentobarbital sodium followed by cervical dislocation in accordance with institutional protocols.
Following the acclimatization period, the establishment of a DN model in db/db mice was confirmed by a tail-vein blood glucose level ≥ 16 mmol/L and microalbuminuria, as indicated by a positive urine microalbumin test strip. Upon successful establishment of the DN model, the db/db mice were randomly divided into two groups (n = 6 per group): the DN model group (DN) and the LLF treatment group (Treatment). Moreover, db/m mice (n = 6) were used as the control group (Control). The dosage was selected based on previous pharmacodynamic studies of LLF in diabetic rats and was converted to the human equivalent dose using body surface area normalization28. The Control and DN groups were given distilled water, whereas the treatment group received 3.5 g/kg LLF for 8 weeks. After 8 weeks of administration, all mice were euthanized to collect serum, urine, and kidney tissue for subsequent testing.
Blood and urine indicators
Serum glucose levels were analyzed using a fully Automatic Blood Biochemistry Analyzer. The urinary microalbumin concentration was measured according to the kit instructions (Supplemental File 1).
Pathological observation of mouse kidney tissues
Kidney tissues were processed for histopathological examination. After fixation in 4% paraformaldehyde, the tissues were washed, dehydrated, embedded in paraffin, and sectioned. Hematoxylin and eosin (HE) staining was then performed, and the stained sections were examined under an optical microscope to evaluate pathological changes.
Reverse transcription quantitative polymerase chain reaction (RT-qPCR)
RT-qPCR was used to determine the expression of the candidate biomarkers in mouse kidney tissue. Total RNA was extracted according to the manufacturer's instructions, after which RNA concentration and quality were assessed (Table 1). cDNA was synthesized from the extracted RNA using the cDNA Synthesis Kit. Amplification was performed with the primer pairs listed in Table 1, using GAPDH as the reference gene. Relative expression levels were calculated with the 2−ΔΔCt method13,26.
Statistical analysis
All statistical analyses were carried out using R software (version 4.2.2) together with the software required for the corresponding experimental procedures. Unless otherwise indicated, all statistical tests were two-sided, and differences were considered statistically significant at P < 0.05. Transcriptomic differential-expression analysis was performed using the limma package. Genes with an adjusted P < 0.05 and an absolute log2fold change greater than 0.5 were defined as differentially expressed.
For comparisons of candidate-gene expression between independent DN and control samples, nonparametric Wilcoxon rank-sum tests were used where indicated in the original analytical workflow. Correlations between candidate biomarkers and immune cell fractions were assessed using Spearman's rank correlation.
Experimental data are presented as mean ± SD. Comparisons among the three independent animal groups were performed using one-way analysis of variance when the assumptions of parametric analysis were met. For post hoc comparisons, the least significant difference test was used when variances were homogeneous, whereas Dunnett's T3 test was used when variances were unequal. The baseline and week-8 pharmacodynamic measurements were analyzed and presented separately; no inference regarding a group-by-time interaction was made. The R scripts and source data used for bioinformatics and machine-learning analyses are provided in Supplemental File 1.
Results
To systematically investigate potential mitochondria-related candidate biomarkers for LLF in the treatment of DN, we designed a four-phase analytical workflow (Figure 1). In Phase I, we integrated transcriptomic data from the GSE142025 dataset (training set, whole kidney, n=36) and GSE96804 (validation set, glomerulus, n = 61) with 1,136 mitochondria-related genes from the MitoCarta 3.0 database and 517 predicted targets of 9 active ingredients from the TCMSP database. Overlapping these three gene sets yielded 9 candidate genes. In Phase II, four machine learning models (RF, KNN, PLS, and SVM) were applied to prioritize feature genes using RMSE < 0.281 as the threshold. Cross-dataset validation using ROC analysis (AUC > 0.7 in both datasets) identified four candidate biomarkers: CAT, FABP1, MAOB, and MAOA. In Phase III, we performed GSEA to identify enriched KEGG pathways, immune infiltration analysis using CIBERSORT, m6A modification prediction, and constructed lncRNA-miRNA-mRNA, active ingredient–biomarker, and active ingredient–biomarker–pathway networks, followed by molecular docking. In Phase IV, the pharmacodynamic effects of LLF and changes in mRNA expression of the four candidate biomarkers were evaluated in a db/db mouse model of DN.
Screening of candidate genes for LLF treating DN
In the GSE142025 dataset, 3,810 DEGs were identified between the DN and control groups, including 1,904 upregulated and 1,906 downregulated DEGs (Figure 2A,B). Thirteen active ingredients from LLF were predicted using the TCMSP database, namely beta-sitosterol, kaempferol, taxifolin, Lucidumoside D, Lucidumoside D_qt, (20S)-24-ene-3,20-diol-3-acetate, eriodictyol, syringaresinol diglucoside_qt, Lucidusculine, Olitoriside, Olitoriside_qt, luteolin, and quercetin (Table 2). Four active ingredients—Lucidumoside D_qt, (20S)-24-ene-3,20-diol-3-acetate, syringaresinol diglucoside_qt, and Olitoriside_qt—did not predict any potential target genes, while the remaining nine ingredients predicted 517 potential target genes. By overlapping the 3,810 DEGs, 1,136 MRGs, and 517 potential target genes, nine candidate genes were identified: GPX1, BAX, CASP8, MAOA, MAOB, CAT, AKR1B10, ALDH2, and FABP1 (Figure 2C). An active ingredient-candidate gene network was subsequently constructed (Figure 2D). These nine candidate genes were enriched in 341 GO terms, including response to toxic substances, organic hydroxy compound catabolic process, and cellular detoxification (Figure 2E). Additionally, they were associated with 52 KEGG pathways, such as tryptophan metabolism, neurodegenerative pathways, and histidine metabolism (Figure 2F).
Screening of candidate biomarkers for DN treatment in LLF
The PPI network revealed seven nodes and eight edges, with MAOA, ALDH2, MAOB, and AKR1B10 interacting (Figure 3A). Genes with RMSE values less than 0.281 across four machine learning models were identified as feature genes: CAT, MAOB, MAOA, BAX, and FABP1 (Figure 3B-E). Expression analysis showed that CAT, FABP1, MAOB, and MAOA were significantly different between the DN and control groups and were consistent in both the GSE142025 and GSE96804 datasets (Figure 3F,G). Furthermore, their AUC values in ROC curve analysis exceeded 0.7 in both datasets, indicating that these genes could effectively differentiate DN samples from control samples and serve as candidate biomarkers for DN treatment in LLF (Figure 4A-H).
Significant enrichment of candidate biomarkers in inflammatory and immue-related pathways
GSEA identified four candidate biomarkers prominently enriched in the chemokine signaling pathway and cytokine-cytokine receptor interactions (Figure 5A-D). Among these, the peroxidase signaling pathway showed a significant association with CAT, MAOA, and MAOB.
Correlation of candidate biomarkers with immune cells
Notable differences in the expression of nine immune cell types-naive B cells, M0 Macrophage, M1 Macrophage, M2 Macrophage, activated Mast cell, activated NK cell, resting memory CD4+ T cell, naive CD4+ T cell, and CD8+ T cell—were observed between the DN and control samples (P < 0.05) (Figure 6A,B). A significant positive correlation (cor = 0.6) was found between naive B cells and activated NK cells, while a significant negative correlation (cor = -0.69) was detected between naive B cells and activated Mast cells (Figure 6C). All candidate biomarkers exhibited strong negative correlations with CD8+ T cells and activated Mast cells and positive correlations with activated NK cells and naive B cells (Figure 6D).
Interaction of key modified m6A proteins with candidate biomarkers
The m6A RNA methylation modification profoundly affects RNA synthesis and metabolism and is implicated in the pathogenesis of various diseases29. The locations of the m6A modification sites in the candidate biomarkers and their high-confidence positions in the secondary structures are illustrated in Figure 7A-H. Further analysis revealed that key m6A-modified proteins interacting with CAT included AQR and RBM22, while FABP1 interacted with both SF3A3 and AQR. MAOA was found to interact with IGF2BP3 and IGF2BP2, and MAOB with TIA1 (Table 3).
Favorable in silico binding predictions for taxifolin, beta-sitosterol, and eriodictyol in LLF treating DN
In miRNet, CAT was predicted to interact with 24 miRNAs, while FABP1 was associated with five miRNAs. Additionally, MAOB and MAOA were linked to 29 and 26 miRNAs, respectively. Among these, 23 lncRNAs were identified in both the TarBase and Starbase databases. A lncRNA-miRNA-mRNA regulatory network was then constructed, incorporating four candidate biomarkers, 74 miRNAs, and 23 lncRNAs (Figure 8A). Potential active ingredients targeting the candidate biomarkers included luteolin, beta-sitosterol, eriodictyol, kaempferol, quercetin, and taxifolin (Figure 8B). Moreover, an active ingredient-biomarker-pathway network was established based on the active ingredients, candidate biomarkers, and the top five pathways identified in GSEA (Figure 8C). For instance, taxifolin targeted CAT in the peroxisome pathway. The binding energies between CAT and taxifolin (-8.8 kcal/mol), FABP1 and beta-sitosterol (-8.1 kcal/mol), and MAOB and eriodictyol (-9.8 kcal/mol) were all below -5 kcal/mol, suggesting strong affinities between these candidate biomarkers and their respective active ingredients27. Taxifolin, beta-sitosterol, and eriodictyol were identified as potential active ingredients with favorable in silico binding predictions in LLF treating DN (Figure 8D-F). However, they are presented as database-predicted constituents rather than confirmed bioactive intermediates of the observed in vivo effects.
Validate candidate biomarkers in the DN mouse model
Pharmacodynamic evaluation of LLF in treating DN mice
During the administration period, blood glucose and urinary microalbumin levels in mice were monitored (Figure 9A-D). Compared with the control group, blood glucose and urinary microalbumin in DN model group was significantly increased (P < 0.01); compared with the DN model group, blood glucose of the mice in the treatment group were significantly decreased after 4 weeks of administration (P < 0.01) and urinary microalbumin of the mice in the treatment group were significantly decreased after 8 weeks of administration (P < 0.05). The results suggest that LLF could be beneficial in treating DN.
Pathological evaluation of LLF in treating DN mice
Following HE staining, the control group exhibited clear glomerular structures in kidney tissue. In contrast, the DN model group showed glomerular nuclear pyknosis and hyperchromasia, along with inflammatory cell infiltration around the glomeruli, compared to the normal group. Treatment with LLF ameliorated pathological damage in the kidneys of db/db mice (Figure 9E).
RT-PCR analysis of the expression of candidate biomarkers in DN mice
Following the successful establishment of a DN mouse model and the observation of significant improvement in symptoms with LLF treatment, RT-qPCR was further used to analyze the changes of candidate biomarkers. Compared to the control group, the DN group exhibited significantly reduced expression of CAT and MAOA (P < 0.05 or P < 0.001). Conversely, the treatment group showed significantly higher CAT and MAOA expression than the DN group (P < 0.05). However, no statistically significant differences were observed in the expression of MAOB and FABP1 among the groups (Figure 9F-I).
Data availability
Gene expression datasets analyzed in this study are publicly available from the Gene Expression Omnibus (GEO) under accession numbers GSE142025 and GSE96804. The R scripts used for the bioinformatics analyses, together with the experimental source data (blood glucose, urinary microalbumin, and RT-qPCR data), are provided in Supplemental File 1. All other databases, software, and web resources used in this study are listed in the Table of Materials.
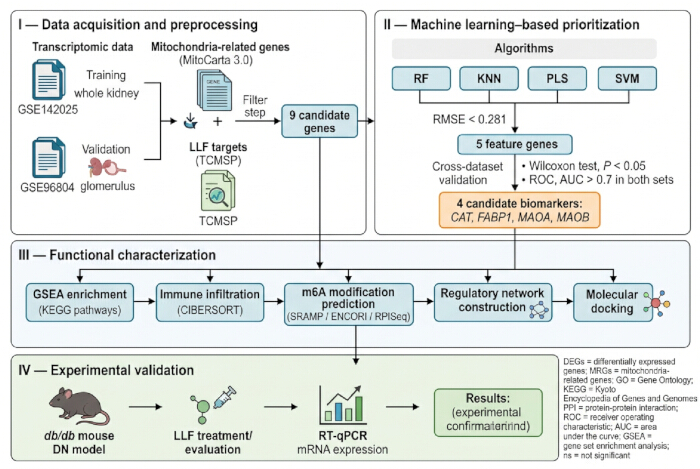
Figure 1: Workflow of the study. Transcriptomic datasets, mitochondria-related genes, and predicted targets of Ligustri Lucidi Fructus were integrated to identify candidate genes. Four machine-learning algorithms were then used to prioritize feature genes, followed by cross-dataset validation, functional characterization, and experimental validation in db/db mice. Abbreviations: DN = diabetic nephropathy; DEGs = differentially expressed genes; MRGs = mitochondria-related genes; LLF = Ligustri Lucidi Fructus; RF, random forest; KNN = k-nearest neighbor; PLS = partial least squares; SVM = support vector machine; RMSE = root mean square error; GSEA = gene set enrichment analysis; RT-qPCR = reverse transcription quantitative polymerase chain reaction. Please click here to view a larger version of this figure.
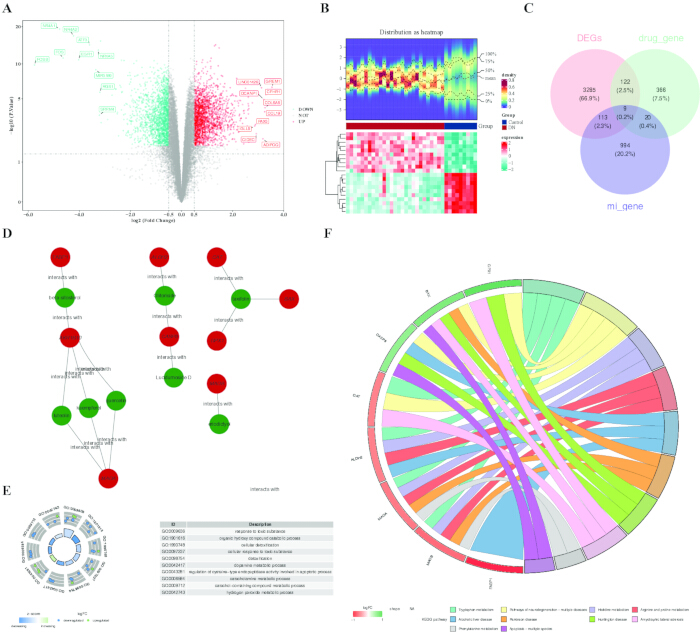
Figure 2: Screening and functional characterization of candidate genes for LLF treatment of DN. (A) Volcano plot showing differentially expressed genes between DN and control samples in GSE142025. (B) Heatmap of the top 10 upregulated and top 10 downregulated genes ranked by |log2FC|. (C) Venn diagram showing the intersection of DEGs, MRGs, and predicted LLF target genes. (D) Active ingredient–candidate gene network. (E) Gene Ontology enrichment analysis of candidate genes. Bar height represents enrichment significance, and the z-score indicates the predicted direction of functional regulation. (F) Kyoto Encyclopedia of Genes and Genomes pathway enrichment analysis of candidate genes. Abbreviations: DN = diabetic nephropathy; LLF = Ligustri Lucidi Fructus; DEGs = differentially expressed genes; MRGs = mitochondria-related genes; GO = Gene Ontology; KEGG = Kyoto Encyclopedia of Genes and Genomes. Please click here to view a larger version of this figure.
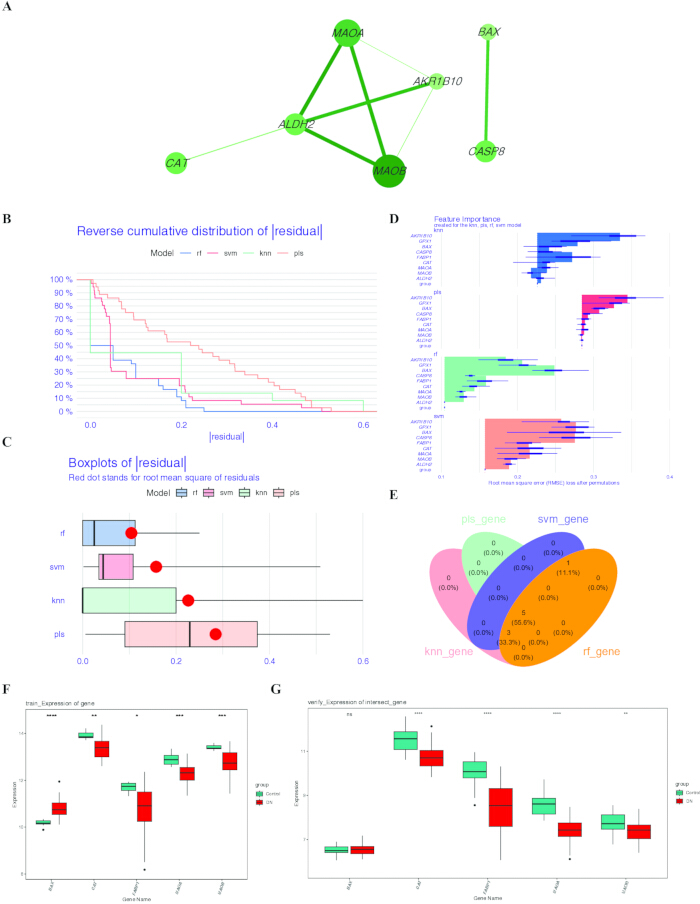
Figure 3: Machine-learning-based identification of candidate biomarkers. (A) Protein–protein interaction network of proteins encoded by the candidate genes. (B) Reverse cumulative distribution of residuals for the RF, KNN, PLS, and SVM models. (C) Boxplots showing residual distributions of the four models; the red point indicates the root mean square error. (D) RMSE-based importance of candidate genes across the four machine-learning models. (E) Intersection of feature genes meeting the RMSE < 0.281 criterion across all four models. (F,G) Expression of the selected feature genes in GSE142025 and GSE96804, respectively. Abbreviations: RF = random forest; KNN = k-nearest neighbor; PLS = partial least squares; SVM = support vector machine; RMSE = root mean square error. Please click here to view a larger version of this figure.
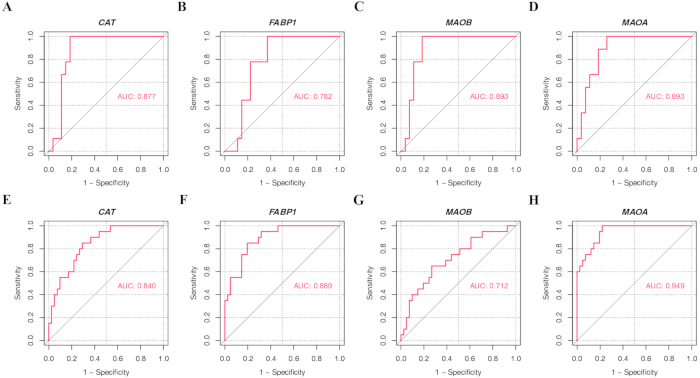
Figure 4: Receiver operating characteristic curves of the four candidate biomarkers. ROC curves for CAT, FABP1, MAOB, and MAOA in the (A-D) GSE142025 training dataset and (E-H) GSE96804 validation dataset. The AUC represents the area under the receiver operating characteristic curve. Abbreviations: ROC = receiver operating characteristic; AUC = area under the curve. Please click here to view a larger version of this figure.
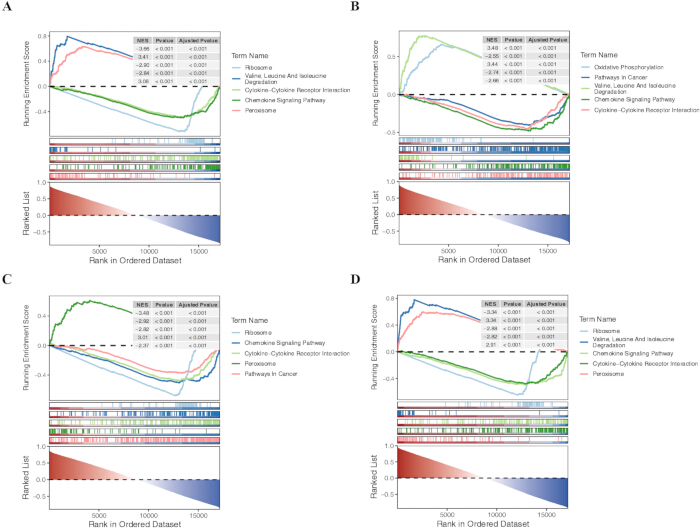
Figure 5: Gene set enrichment analysis of candidate biomarkers. GSEA showing significantly enriched KEGG pathways associated with (A) CAT, (B) FABP1, (C) MAOA, and (D) MAOB in the GSE142025 dataset. Abbreviations: GSEA = gene set enrichment analysis; KEGG = Kyoto Encyclopedia of Genes and Genomes. Please click here to view a larger version of this figure.
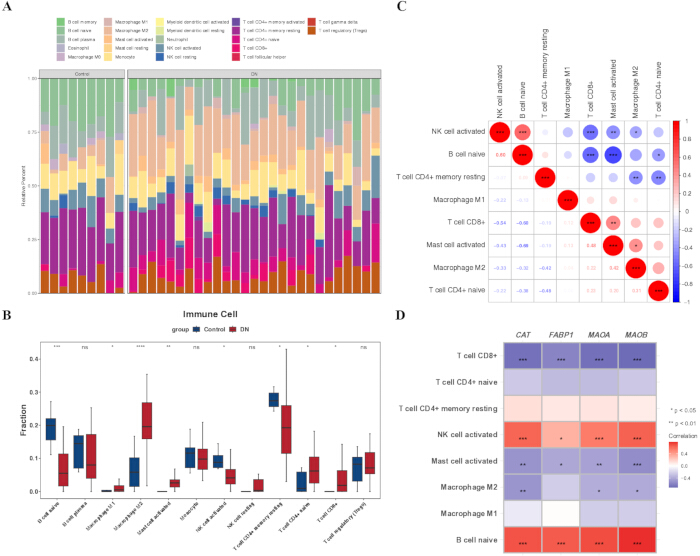
Figure 6: Immune-cell infiltration and its association with candidate biomarkers in DN. (A) Relative proportions of 22 immune cell types estimated by CIBERSORT in DN and control samples. (B) Comparison of significantly different immune-cell fractions between DN and control groups. (C) Correlation matrix among the differentially abundant immune cell types. (D) Spearman correlations between the expression of CAT, FABP1, MAOA, and MAOB and the differentially abundant immune cell types. Abbreviations: DN = diabetic nephropathy. Please click here to view a larger version of this figure.
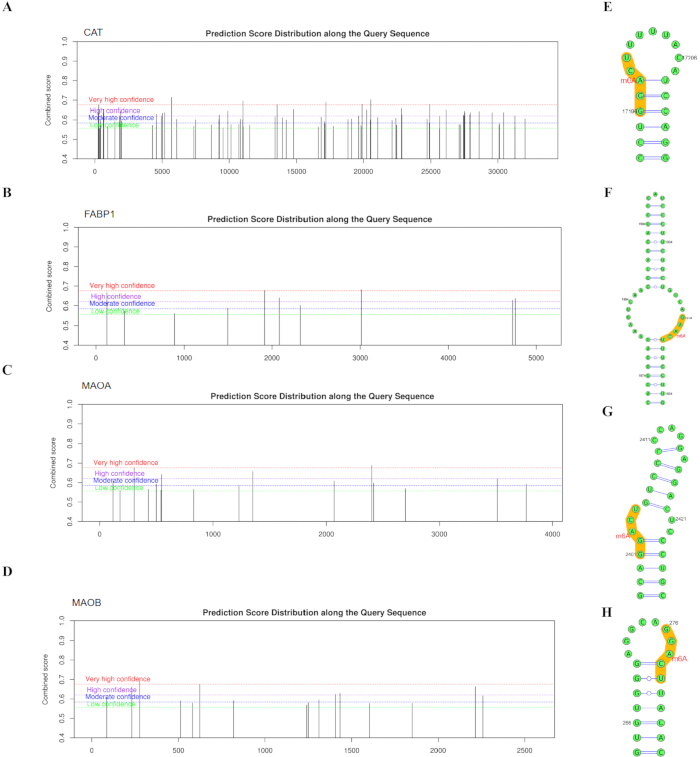
Figure 7: Predicted m6A modification sites and RNA secondary structures of candidate biomarker transcripts. Predicted m6A modification sites in (A) CAT, (B) FABP1, (C) MAOA, and (D) MAOB. Predicted RNA secondary structures showing high-confidence m6A-associated regions of (E) CAT, (F) FABP1, (G) MAOA, and (H) MAOB. Yellow-highlighted regions indicate the predicted sequence regions containing m6A modification sites. Abbreviation: m6A = N6-methyladenosine. Please click here to view a larger version of this figure.
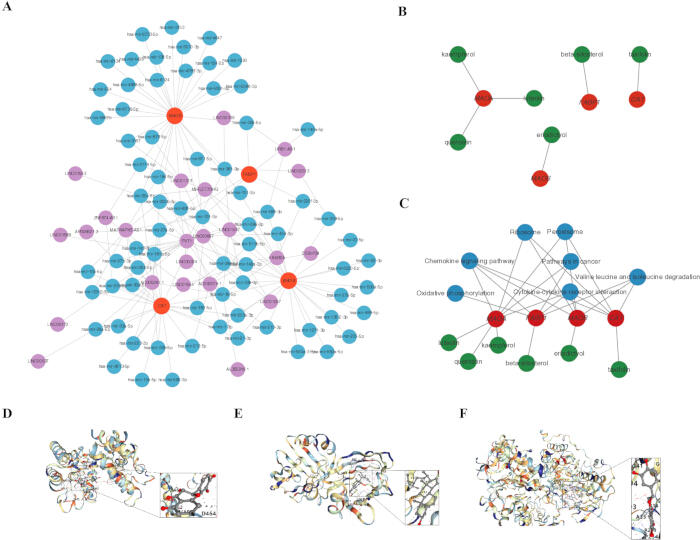
Figure 8: Regulatory networks and molecular docking of potential active ingredients of LLF. (A) Predicted lncRNA–miRNA–mRNA regulatory network involving the candidate biomarkers. (B) Network of potential LLF active ingredients and candidate biomarkers. (C) Active ingredient–biomarker–pathway network based on the GSEA results. (D-F) Predicted molecular docking conformations of (D) CAT with taxifolin, (E) FABP1 with beta-sitosterol, and (F) MAOB with eriodictyol. Abbreviations: LLF = Ligustri Lucidi Fructus; lncRNA = long noncoding RNA; miRNA = microRNA; GSEA = gene set enrichment analysis. Please click here to view a larger version of this figure.
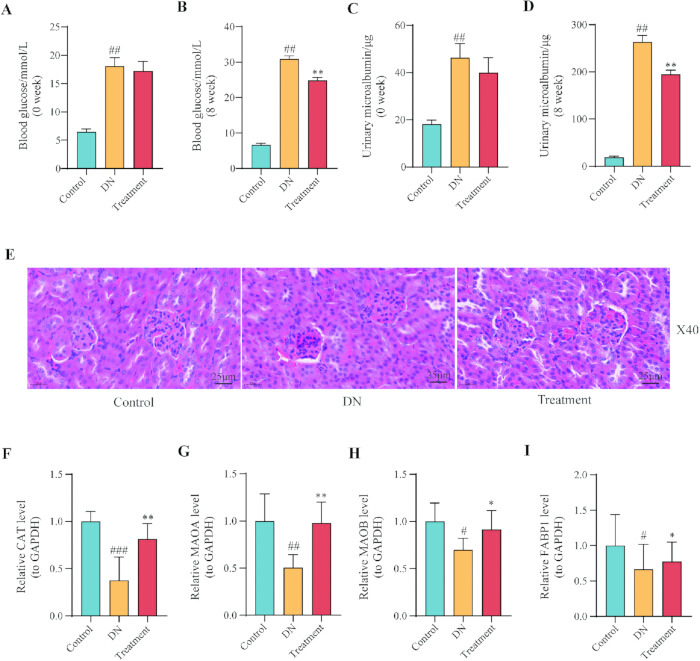
Figure 9: Effects of LLF treatment on biochemical indicators, renal histopathology, and candidate biomarker expression in db/db mice. (A,B) Blood glucose levels at baseline and week 8, respectively. (C,D) Urinary microalbumin levels at baseline and week 8, respectively. (E) Representative hematoxylin and eosin-stained kidney sections from the Control, DN, and Treatment groups (magnification, ×40; scale bar = 25 µm). (F-I) Relative renal mRNA expression levels of Cat, Maoa, Maob, and Fabp1, respectively, measured by RT-qPCR. #P < 0.05, ##P < 0.01, and ###P < 0.001 versus the Control group; *P < 0.05, **P < 0.01, and ***P < 0.001 versus the DN group. Abbreviations: LLF = Ligustri Lucidi Fructus; DN = diabetic nephropathy; RT-qPCR = reverse transcription quantitative polymerase chain reaction. Please click here to view a larger version of this figure.
| primer | sequences |
| CAT F | TCACTGACGAGATGGCACAC |
| CAT R | ATCGAACGGCAATAGGGGTC |
| FABP1 F | CAATAGGTCTGCCCGAGGAC |
| FABP1 R | GTCATGGTCTCCAGTTCGCA |
| MAOB F | GCACTGAAACAGCCTCACAC |
| MAOB R | TCGTGCAGGGACATCCAAAG |
| MAOA F | ACTTACCCATTCCGTGGTGC |
| MAOA R | ACCACAGGGCAGATACCTCA |
| M-GAPDH F | CCTTCCGTGTTCCTACCCC |
| M-GAPDH R | GCCCAAGATGCCCTTCAGT |
Table 1: Primer sequences used for RT-qPCR analysis of mouse kidney tissues. Abbreviations: F = forward primer; R = reverse primer; RT-qPCR = reverse transcription quantitative polymerase chain reaction.
| MOL ID | Molecule name | OB (%) | DL | Target number |
| MOL000358 | beta-sitosterol | 36.91 | 0.75 | 100 |
| MOL000422 | kaempferol | 41.88 | 0.24 | 103 |
| MOL004576 | taxifolin | 57.84 | 0.27 | 92 |
| MOL005146 | Lucidumoside D | 48.87 | 0.71 | 104 |
| MOL005147 | Lucidumoside D_qt | 54.41 | 0.47 | 0 |
| MOL005169 | (20S)-24-ene-3,20-diol-3-acetate | 40.23 | 0.82 | 0 |
| MOL005190 | eriodictyol | 71.79 | 0.24 | 101 |
| MOL005195 | syringaresinol diglucoside_qt | 83.12 | 0.8 | 0 |
| MOL005209 | Lucidusculine | 30.11 | 0.75 | 105 |
| MOL005211 | Olitoriside | 65.45 | 0.23 | 100 |
| MOL005212 | Olitoriside_qt | 103.23 | 0.78 | 0 |
| MOL000006 | luteolin | 36.16 | 0.25 | 102 |
| MOL000098 | quercetin | 46.43 | 0.28 | 103 |
Table 2: Thirteen active ingredients of Ligustri Lucidi Fructus identified using the TCMSP database. Abbreviations: OB = oral bioavailability; DL = drug-likeness.
| mRNA | Protein | RF | SVM |
| CAT | AQR | 0.7 | 0.98 |
| CAT | RBM22 | 0.8 | 0.97 |
| FABP1 | AQR | 0.65 | 0.94 |
| FABP1 | SF3A3 | 0.7 | 0.8 |
| MAOA | IGF2BP2 | 0.75 | 0.97 |
| MAOA | IGF2BP3 | 0.75 | 0.97 |
| MAOB | TIA1 | 0.85 | 0.89 |
Table 3: Predicted interactions between four mitochondrial biomarker mRNAs and m6A-related RNA-binding proteins. CAT, FABP1, MAOA, and MAOB denote human biomarker mRNAs; AQR, RBM22, SF3A3, IGF2BP2, IGF2BP3, and TIA1 denote RNA-binding proteins. RF and SVM scores > 0.5 indicate predicted RNA–protein interactions. Abbreviations: RF = random forest; SVM = support vector machine.
Supplemental File 1. Bioinformatics scripts and experimental source data. This archive contains the R scripts used for data processing, differential expression analysis, functional enrichment, machine learning, receiver operating characteristic analysis, gene set enrichment analysis, Spearman correlation analysis, and CIBERSORT immune-cell infiltration analysis, together with the source data for blood glucose, urinary microalbumin, and RT-qPCR experiments. Please click here to download this file.
Discussion
LLF is a commonly used traditional Chinese medicine, primarily employed to nourish the liver and kidneys and to treat diabetes and its complications. Currently, there are no specific drugs or therapies for DN, and its management primarily relies on hypoglycemic, hypolipidemic, and antihypertensive treatments30,31,32. However, these treatments can only slow renal damage progression in a small proportion of patients33. LLF has been demonstrated to exert renal protective effects in DN rat models by correcting glucose and lipid metabolism disorders and alleviating oxidative stress34. Notably, as an organ with exceptionally high mitochondrial content and oxygen consumption, abnormal mitochondrial dynamics in the kidney play a pivotal role in the pathogenesis of DN35. This study reveals a novel mechanism by which LLF may influence mitochondrial function through specific candidate biomarkers (CAT, FABP1, MAOB, and MAOA) in the treatment of DN.
Previous studies have indicated that catalase (CAT), fatty acid-binding protein 1 (FABP1), monoamine oxidase B (MAOB), and monoamine oxidase A (MAOA) are implicated in DN to varying degrees. CAT is involved in the antioxidant defense system, protecting the kidney from oxidative stress-induced damage36. CAT, a core antioxidant enzyme in the body, participates in regulating DN occurrence and progression by modulating mitochondrial-related physiological processes37. CAT specifically catalyzes the decomposition of hydrogen peroxide (H₂O₂) into water and oxygen, effectively scavenging ROS originating from mitochondria. This reduces oxidative stress-induced damage to mitochondrial structure and function, maintains mitochondrial membrane potential stability and oxidative phosphorylation efficiency, thereby mitigating high-glucose-induced renal cell injury and delaying the progression of DN38. Furthermore, downregulation of CAT expression leads to insufficient mitochondrial ROS scavenging, exacerbating mitochondrial fragmentation and cristae disruption. This inhibits mitochondrial fusion while promoting fission, further destabilizing mitochondrial dynamics. Consequently, intrinsic cells such as mesangial cells and podocytes develop metabolic disorders, thereby accelerating renal tissue fibrosis39.
FABP1, as a member of the fatty acid-binding protein family, primarily participates in the transport, metabolism, and intracellular signaling of long-chain fatty acids. Its abnormal expression has been demonstrated to be closely associated with various metabolic diseases and renal injury, playing a crucial regulatory role in the development and progression of diabetic nephropathy (DN)40. Research indicates that FABP1 modulates DN progression by disrupting lipid metabolism. In diabetes, abnormal FABP1 expression disrupts fatty acid transport and metabolism. Excessive free fatty acids and their metabolites accumulate in renal tissue, directly damaging glomerular endothelial and tubular epithelial cells, thereby exacerbating renal inflammation and fibrosis41. Concurrently, FABP1 exacerbates renal tissue injury by mediating oxidative stress and hypoxia-induced damage. Its urinary excretion may increase prior to abnormal urinary albumin levels, offering a novel target for early DN screening and diagnosis41,42. Moreover, FABP1 plays a central regulatory role in mitochondrial fatty acid metabolism43. Studies indicate that upregulation of FABP1 significantly enhances fatty acid transport efficiency into mitochondria, increases mitochondrial β-oxidation activity and tricarboxylic acid cycle enzyme activity, thereby improving cellular energy metabolism44. However, the mechanism by which FABP1 influences DN pathogenesis through its involvement in mitochondrial-related processes remains unclear. In other DN-related conditions, MAOB and MAOA, as enzymes involved in neurotransmitter metabolism, have been associated with DN progression, contributing to an imbalance in the tissue redox state. This study further confirms the pivotal role of these four candidate biomarkers in DN, with their expression levels decreasing in the DN group. It is hypothesized that modulating the expression of these candidate biomarkers may help reduce inflammation and oxidative stress in DN.
Based on GSEA enrichment analysis, four candidate biomarkers—CAT, FABP1, MAOB, and MAOA—were enriched in multiple pathways, including the chemokine signaling pathway, cytokine-cytokine receptor interaction, and peroxisome pathways. Chemokines are key components of the immune response, promoting inflammation. The peroxidase (POD) pathway is linked to oxidative stress45. Baicalin has been reported to alleviate DN by reducing oxidative stress and inflammation, with its mechanism potentially involving activation of the NrF2-mediated antioxidant signaling pathway and inhibition of the MAPK-mediated inflammatory pathway45. Moreover, dysregulation of FABP1 in lipid metabolism may contribute to glomerular sclerosis and interstitial fibrosis in DN9. These findings suggest that the candidate biomarkers play a critical role in the inflammatory and oxidative stress processes in DN. Targeting these candidate biomarkers to modulate the pathways they influence could mitigate the inflammation and oxidative stress associated with DN, thereby alleviating its progression.
Bioinformatics analysis showed that the infiltration levels of immune subsets, such as CD8+ T cells, in DN kidney tissue changed significantly, and the increase in CD8+ T cells was significantly and negatively correlated with the expression of four mitochondrial-related candidate biomarkers (CAT, FABP1, MAOB, MAOA). These computational predictions are consistent with the pathological observation results of animal experiments: HE staining sections of the kidneys of mice in the DN model group showed obvious inflammatory cell infiltration around the glomeruli; after LLF intervention, the infiltration of renal inflammatory cells in the treatment group was significantly reduced, and the pathological damage was improved. This suggests that increased inflammatory cell infiltration is a key feature of DN renal injury, and LLF may play a protective role by regulating immune infiltration. This finding is consistent with previous studies: the infiltration of CD8+ T cells is associated with the development of DN, and inhibition of their response can alleviate the disease46, which also aggravates renal injury in Adriamycin nephropathy47. In addition, a variety of immune cells, such as B cells, M1 / M2 macrophages, and NK cells, are changed in DN pathology48. The biomarker CAT may affect the function of immune cells in DN49, and MAOA may also affect the immune microenvironment by regulating macrophage polarization. These results indicate that the renal protective effect of LLF is closely related to its regulation of abnormal immune infiltration, including CD8+ T cells, thereby reducing inflammatory damage. The negative correlations between four candidate biomarkers and CD8+ T cells and activated mast cells suggest that these genes may modulate the renal immune microenvironment. CAT expression has been linked to macrophage polarization and T cell activity in metabolic tissues. However, our CIBERSORT estimates are derived from bulk renal tissue transcriptomes, which cannot distinguish immune cell subtypes infiltrating glomerular vs. tubulointerstitial compartments. The observed correlations should be interpreted as hypothesis-generating associations rather than as evidence of causal immune regulation. Future studies using multiplex immunohistochemistry or single-cell RNA-seq are required to localize these immune-biomarker interactions.
Previous studies have reported mitochondrial-related biomarkers in DN, including OPA1, MFN2, DRP1, PGC-1α, and SOD2. Our CAT and MAOA findings complement this existing literature by highlighting peroxisomal and monoamine oxidase pathways that have received less attention in the DN mitochondrial context. Notably, while SOD2 and GPX1 are classical ROS-scavenging enzymes, CAT specifically targets peroxisomal H2O2, suggesting a distinct subcellular compartment of oxidative stress regulation.
As a natural flavonoid, Taxifolin (TA) has been shown to significantly reduce blood glucose, uric acid, creatinine, and serum insulin levels in diabetic rats, while also mitigating pathological kidney changes in these animals50. β-sitosterol may improve DN indirectly by regulating lipid balance and exerting anti-inflammatory effects. The β-sitosterol components in Huangqi Gegen decoction (HGD) participate in DN-related pathways, targeting molecules such as Vascular Endothelial Growth Factor A (VEGFA) and Interleukin-6 (IL-6). These effects include anti-inflammatory, anti-apoptotic, antioxidant, and autophagic actions, which reduce renal fibrosis and renal cortical damage and improve renal function, ultimately delaying DN progression51. Eriodictyol, another natural flavonoid, has been shown to protect against ischemic stroke (IS) by balancing oxidative stress and inflammation52. While there are limited studies on eriodictyol in the context of DN, given the disease’s association with inflammation and oxidative stress, it is hypothesized that it may alleviate DN through similar mechanisms. Drug predictions in this study also suggest that Taxifolin, β-sitosterol, and eriodictyol have potential therapeutic effects in DN. Molecular docking predicts possible binding conformations and affinities, but does not establish in vivo target engagement, bioavailability, or pharmacological activity. These results should be interpreted as hypothesis-generating rather than confirmatory.
Previous network pharmacology studies on diabetic nephropathy (DN) have largely focused on individual signaling pathways (e.g., AGE-RAGE, PI3K-AKT, and MAPK) and have not considered mitochondrial dysfunction or employed multi-model machine learning to prioritize biomarkers. Our study introduces three methodological and biological advances: (1) the integration of transcriptome-wide differentially expressed genes (DEGs) with mitochondrial gene sets and drug-target predictions; (2) the application of four distinct machine learning models with cross-dataset validation to prioritize robust candidates; and (3) the identification of peroxisomal (CAT) and monoamine oxidase (MAOA/MAOB) pathways—less studied in DN mitochondrial contexts—as candidate therapeutic axes.
The lack of statistically significant changes in MaoB and Fabp1 expression in the mouse kidney may be due to several factors. First, the two Gene Expression Omnibus (GEO) datasets used for candidate prioritization were derived from human kidney samples (whole kidney and glomerulus, respectively), whereas our animal experiment used mouse renal tissue. Species-specific differences in gene regulation may affect baseline expression levels and drug responsiveness. Second, the relatively small sample size (n = 6 per group) may have limited the statistical power to detect moderate effect sizes. Third, tissue was collected 8 weeks after treatment, which may not have captured the optimal window for detecting transcriptomic changes in MaoB and Fabp1, as these genes may be regulated at the protein or activity level rather than at the mRNA level. Fourthly, tissue heterogeneity—between the whole kidney and specific compartments—may contribute to discrepancies. Further investigation of these possibilities is warranted.
This study used an integrative bioinformatics and machine learning approach to identify CAT, FABP1, MAOA, and MAOB as potential mitochondrial candidate genes for LLF in DN. In vivo experiments confirmed that LLF significantly upregulates CAT and MAOA in kidney tissue, suggesting that these genes are promising targets for further mechanistic and therapeutic investigation. In contrast, MAOB and FABP1 showed non-significant trends in the same direction, emphasizing the importance of experimental validation when prioritizing computational predictions. These findings provide a rationale for future studies to explore mitochondrial-related therapeutic strategies in DN.
Disclosures
The authors have no conflicts of interest to declare.
Acknowledgements
We would like to express our sincere gratitude to all individuals and organizations who supported and assisted us throughout this research. This study was supported by the National Natural Science Foundation of China (No.81973486 and 82173974), the Shanxi Province Traditional Chinese Medicine Administration's research projects (No.2024ZYYA021), the Discipline Project of Shanxi University of Chinese Medicine (No.2026XK24), and the Scientific Research Fund project of Shandong University of Chinese Medicine (No. KYZK2024Q13). We thank Qinqing Li, Associate Professor, Shanxi University of Chinese Medicine, who authenticated the botanical material.
Materials
| Name | Company | Catalog Number | Comments |
|---|---|---|---|
| 4% Paraformaldehyde Tissue Fixative Solution | Saiyin Biotechnology Co., Ltd. | 71033600 | |
| Absolute Ethanol | Sinopharm Chemical Reagent Co., Ltd. | 10009218 | |
| Blood Glucose Meter | Sinocare Inc. | GA-3 | |
| Blood Urea Nitrogen (BUN) Assay Kit | Nanjing Jianwei Bioengineering Institute | C03-2-1 | |
| C57BLKS/J db/db mice | Changzhou Cavens Experimental Animal Co., Ltd. | SCXK (Su) 2021-0013 | |
| C57BLKS/J db/m mice | Changzhou Cavens Experimental Animal Co., Ltd. | SCXK (Su) 2021-0013 | |
| Centrifuge | Hunan Xiangyi Laboratory Instrument Development Co., Ltd. | HI650 | |
| Chloral Hydrate | Shanghai Aladdin Biochemical Technology Co., Ltd. | 302-17-0 | |
| Cytoscape (v3.9.0) | https://cytoscape.org | ||
| Database for m6A modification prediction | http://www.cuilab.cn/sramp/ | ||
| Database of Active Ingredients in Traditional Chinese Medicine | http://sm.nwsuaf.edu.cn/lsp/tcmsp.php | ||
| ENCORI / Starbase | https://starbase.sysu.edu.cn/ | ||
| Gene Expression Omnibus (GEO) | https://www.ncbi.nlm.nih.gov/geo/ | ||
| Hematoxylin and eosin (HE) stain kit | Servicebio | C0105S | |
| High-speed Centrifuge | Labnet, USA | C2500-R-230V | |
| Immune Infiltration Analysis Tool | https://cibersort.stanford.edu/ | ||
| Ligustri Lucidi Fructus | Sichuan Quanyirun Biotechnology Co., Ltd. | 20240506 | |
| Magnetic Stirrer | Jintan Zhongtian Instrument Factory, Jiangsu | T8-1 | |
| Microscope | Olympus | BX53 | |
| Microtome | Leica, Germany | RM 2016 | |
| Micro-volume Spectrophotometer | Hangzhou Aosheng Instrument Co., Ltd. | Nano-300 | |
| miRNet | https://www.mirnet.ca | ||
| MitoCarta 3.0 | https://www.broadinstitute.org/mitocarta | ||
| Model Interpretation R Package | https://cran.r-project.org/package=DALEX | ||
| Molecular Docking Platform | http://clab.labshare.cn/cb-dock/ | ||
| Mouse Microalbuminuria ELISA Kit | Fine Test | EM0632 | |
| Mouse Microalbuminuria Test Strip | Guangzhou Huadu Gaoerbao Biotechnology Co., Ltd. | 20211203 | |
| Mouse Serum Creatinine ELISA Kit | Abmart | AB5990A | |
| MSigDB | https://www.gsea-msigdb.org/gsea/msigdb/ | ||
| PCR Thermal Cycler | Roche | Roche LightCycler 480 | |
| R software (v4.2.2) + R packages | https://www.r-project.org / CRAN/Bioconductor | ||
| RCSB PDB | https://www.rcsb.org | ||
| RNA Extraction Kit | Beijing Jumei Biotech Co., Ltd. | MF-036-01 | |
| RPISeq | http://pridb.gdcb.iastate.edu/RPISeq/ | ||
| RT-qPCR Kit | Beijing Jumei Biotech Co., Ltd. | MF949-T | |
| Salidroside | Sichuan Quanyirun Biotechnology Co., Ltd. | 20211009 | |
| Serum Creatinine Assay Kit | Nanjing Jianwei Bioengineering Institute | C011-2-1 | |
| SPF animal facility | Shanxi University of TCM | ||
| SRAMP | http://www.cuilab.cn/sramp/ | ||
| STRING | https://cn.string-db.org/ | ||
| SwissTargetPrediction | http://www.swisstargetprediction.ch/ | ||
| TCMSP | http://sm.nwsuaf.edu.cn/lsp/tcmsp.php | ||
| Tezhi Pigan | Sichuan Quanyirun Biotechnology Co., Ltd. | 20210602 | |
| Tissue Flotation Bath | Wuhan Junjie | JK-6 |
References
- Thipsawat S. Early detection of diabetic nephropathy in patient with type 2 diabetes mellitus: a review of the literature. Diabetes Vasc Dis Res. 2021;18(6):14791641211058856.
- Kanwar YS, Sun L, Xie P, Liu FY, Chen S. A glimpse of various pathogenetic mechanisms of diabetic nephropathy. Annu Rev Pathol. 2011;6:395-423.
- Santulli G, et al. Prediabetes increases the risk of frailty in prefrail older adults with hypertension: beneficial effects of metformin. Hypertension. 2024;81(7):1637-43.
- Jin Q, et al. Oxidative stress and inflammation in diabetic nephropathy: role of polyphenols. Front Immunol. 2023;14:1185317.
- Alicic RZ, Rooney MT, Tuttle KR. Diabetic kidney disease: challenges, progress, and possibilities. Clin J Am Soc Nephrol. 2017;12(12):2032-45.
- Harrington JS, et al. Mitochondria in health, disease, and aging. Physiol Rev. 2023;103(4):2349-422.
- Peña FJ, et al. An integrated overview on the regulation of sperm metabolism (glycolysis-Krebs cycle-oxidative phosphorylation). Anim Reprod Sci. 2022;246:106805.
- de Mello AH, Costa AB, Engel JDG, Rezin GT. Mitochondrial dysfunction in obesity. Life Sci. 2018;192:26-32.
- Shen Y, et al. Notoginsenoside Fc, a novel renoprotective agent, ameliorates glomerular endothelial cells pyroptosis and mitochondrial dysfunction in diabetic nephropathy through regulating HMGCS2 pathway. Phytomedicine. 2024;126:155445.
- Zhang PN, et al. Mitochondrial dysfunction and diabetic nephropathy: nontraditional therapeutic opportunities. J Diabetes Res. 2021;2021:1010268.
- Zhang JL, et al. Structural characterization and protective effect against renal fibrosis of polysaccharide from Ligustrum lucidum Ait. J Ethnopharmacol. 2023;302(Pt A):115898.
- Luan R, et al. The protective effect of ethyl acetate and n-butanol fractions of wine-steamed Ligustri Lucidi Fructus on diabetic nephropathy in rats. Evid Based Complement Alternat Med. 2021;2021:6512242.
- Luan R, et al. Pharmacodynamics, pharmacokinetics, and kidney distribution of raw and wine-steamed Ligustri Lucidi Fructus extracts in diabetic nephropathy rats. Molecules. 2023;28(2):791.
- Seo HL, et al. Liqustri lucidi Fructus inhibits hepatic injury and functions as an antioxidant by activation of AMP-activated protein kinase in vivo and in vitro. Chem Biol Interact. 2017;262:57-68.
- Yan M, et al. Identification of pyroptosis-related genes and potential drugs in diabetic nephropathy. J Transl Med. 2023;21(1):490.
- Ritchie ME, et al. limma powers differential expression analyses for RNA-sequencing and microarray studies. Nucleic Acids Res. 2015;43(7):e47.
- Gustavsson EK, et al. ggtranscript: an R package for the visualization and interpretation of transcript isoforms using ggplot2. Bioinformatics. 2022;38(15):3844-6.
- Gu Z, Eils R, Schlesner M. Complex heatmaps reveal patterns and correlations in multidimensional genomic data. Bioinformatics. 2016;32(18):2847-9.
- Shannon P, et al. Cytoscape: a software environment for integrated models of biomolecular interaction networks. Genome Res. 2003;13(11):2498-504.
- Wu T, et al. clusterProfiler 4.0: a universal enrichment tool for interpreting omics data. Innovation (Camb). 2021;2(3):100141.
- Dong H, et al. Identification through machine learning of potential immune-related gene biomarkers associated with immune cell infiltration in myocardial infarction. BMC Cardiovasc Disord. 2023;23(1):163.
- Pei B, et al. The development of prediction model for cuffed tracheal tube size from the middle finger in pediatrics: a concise and feasible approach. Transl Pediatr. 2023;12(12):2222-31.
- Robin X, et al. pROC: an open-source package for R and S+ to analyze and compare ROC curves. BMC Bioinformatics. 2011;12:77.
- Robles-Jimenez LE, et al. Worldwide traceability of antibiotic residues from livestock in wastewater and soil: a systematic review. Animals (Basel). 2021;12(1):60.
- Wang Y, et al. Bioinformatics analysis combined with clinical sample screening reveals that leptin may be a biomarker of preeclampsia. Front Physiol. 2022;13:1031950.
- Livak KJ, Schmittgen TD. Analysis of relative gene expression data using real-time quantitative PCR and the 2^−ΔΔCT method. Methods. 2001;25(4):402-8.
- Klejborowska G, et al. Synthesis, anticancer activity and molecular docking studies of N-deacetylthiocolchicine and 4-iodo-N-deacetylthiocolchicine derivatives. Bioorg Med Chem. 2021;32:116014.
- Reagan-Shaw S, Nihal M, Ahmad N. Dose translation from animal to human studies revisited. FASEB J. 2008;22(3):659-61.
- An Y, Duan H. The role of m6A RNA methylation in cancer metabolism. Mol Cancer. 2022;21(1):14.
- Mazzieri A, Porcellati F, Timio F, Reboldi G. Molecular targets of novel therapeutics for diabetic kidney disease: a new era of nephroprotection. Int J Mol Sci. 2024;25(7):3969.
- Breyer MD, Susztak K. The next generation of therapeutics for chronic kidney disease. Nat Rev Drug Discov. 2016;15(8):568-88.
- Leoncini G, et al. Blood pressure reduction and RAAS inhibition in diabetic kidney disease: therapeutic potentials and limitations. J Nephrol. 2020;33(5):949-63.
- Pofi R, et al. Diabetic nephropathy: focus on current and future therapeutic strategies. Curr Drug Metab. 2016;17(5):497-502.
- Arellano Buendía AS, et al. Immunomodulatory effects of the nutraceutical garlic derivative allicin in the progression of diabetic nephropathy. Int J Mol Sci. 2018;19(10):3107.
- Zhang X, Agborbesong E, Li X. The role of mitochondria in acute kidney injury and chronic kidney disease and its therapeutic potential. Int J Mol Sci. 2021;22(20):11253.
- Liu Y, et al. DsbA-L interacting with catalase in peroxisome improves tubular oxidative damage in diabetic nephropathy. Redox Biol. 2023;66:102855.
- Zhong Y, et al. Jujuboside A ameliorates high fat diet and streptozotocin induced diabetic nephropathy via suppressing oxidative stress, apoptosis, and enhancing autophagy. Food Chem Toxicol. 2022;159:112697.
- Zhong Y, et al. Dioscin relieves diabetic nephropathy via suppressing oxidative stress and apoptosis, and improving mitochondrial quality and quantity control. Food Funct. 2022;13(6):3660-73.
- Issac PK, et al. Protective effect of morin by targeting mitochondrial reactive oxygen species induced by hydrogen peroxide demonstrated at a molecular level in MDCK epithelial cells. Mol Biol Rep. 2022;49(6):4269-79.
- Abo El-Asrar M, Ismail EAR, Elnhrawy AM, Thabet RA. Fatty acid binding protein 1 (FABP1) and fatty acid binding protein 2 (FABP2) as a link between diabetic nephropathy and subclinical atherosclerosis in children and adolescents with type 1 diabetes. J Diabetes Complications. 2023;37(3):108414.
- Gholaminejad A, Fathalipour M, Roointan A. Comprehensive analysis of diabetic nephropathy expression profile based on weighted gene co-expression network analysis algorithm. BMC Nephrol. 2021;22(1):245.
- Tanaka M, et al. Urinary fatty acid-binding protein 4 is a promising biomarker for glomerular damage in patients with diabetes mellitus. J Diabetes Investig. 2025;16(4):670-9.
- Liu Y, et al. Gastric cancer adapts high lipid microenvironment via suppressing PPARG-FABP1 axis after arriving in the lymph node. Redox Biol. 2025;85:103759.
- Borús DL, et al. Fatty acid binding protein 1 (FABP1) depletion promotes an oxidative metabolic shift in Caco-2 colorectal cancer cells. Biochim Biophys Acta Mol Cell Biol Lipids. 2025;1870(7):159661.
- Chu Y, et al. Glutathione peroxidase-1 overexpression reduces oxidative stress, and improves pathology and proteome remodeling in the kidneys of old mice. Aging Cell. 2020;19(6):e13154.
- Zhang F, et al. Mesenchymal stem cells alleviate rat diabetic nephropathy by suppressing CD103+ DCs-mediated CD8+ T cell responses. J Cell Mol Med. 2020;24(10):5817-31.
- Cao Q, et al. Renal F4/80+ CD11c+ mononuclear phagocytes display phenotypic and functional characteristics of macrophages in health and in adriamycin nephropathy. J Am Soc Nephrol. 2015;26(2):349-63.
- Zhou W, et al. The landscape of immune cell infiltration in the glomerulus of diabetic nephropathy: evidence based on bioinformatics. BMC Nephrol. 2022;23(1):303.
- Bloch K, Shichman E, Vorobeychik M, Bloch D, Vardi P. Catalase expression in pancreatic alpha cells of diabetic and non-diabetic mice. Histochem Cell Biol. 2007;127(2):227-32.
- Zhao Y, et al. Taxifolin attenuates diabetic nephropathy in streptozotocin-induced diabetic rats. Am J Transl Res. 2018;10(4):1205-10.
- Ding S, Wang W, Song X, Ma H. Based on network pharmacology and molecular docking to explore the underlying mechanism of Huangqi Gegen Decoction for treating diabetic nephropathy. Evid Based Complement Alternat Med. 2021;2021:9928282.
- Guo S, et al. Correction: Eriodictyol: a review of its pharmacological activities and molecular mechanisms related to ischemic stroke. Food Funct. 2023;14(10):4949.