Using an ex vivo explant model, small pieces of the rostral portion of visceral white adipose tissue from lean mice are cultured for 7–10 days, enabling the induction and study of adipose tissue inflammation as it occurs during high-fat diet feeding.
A subscription to JoVE is required to view this content. Sign in or start your free trial.
Method Article
An ex vivo Mouse Model for High-Fat Diet-Like Adipose Tissue Inflammation
* These authors contributed equally
In This Article
Summary
Abstract
This protocol describes an ex vivo mouse model that recapitulates selected cellular and inflammatory features observed in visceral adipose tissue (VAT) following high-fat diet (HFD) feeding, without dietary intervention in vivo. Small VAT explants from lean mice are cultured for 7–10 days, during which they spontaneously develop an inflammatory phenotype that closely resembles that of VAT from HFD-fed animals. Importantly, the model preserves adipose tissue (AT) architecture, enabling the investigation of inflammatory processes in a physiologically relevant context. During culture, key hallmarks of obesity-related inflammation emerge, including the formation of crown-like structures (CLS), the accumulation of metabolically activated macrophages (MMes), and increased inflammatory cytokine production. Despite adipocyte death, other drivers of obesity-related inflammation, including metabolic stressors such as saturated fatty acids, altered lipid handling, glucose excess, oxidative stress, hypoxia, adipokine imbalance, and paracrine adipocyte–immune cell signaling, can be partially represented in the model. The system supports a wide range of downstream applications, including live imaging, flow cytometry, quantitative PCR, ELISA, immunostaining, and bulk or single-cell RNA sequencing. In addition, pharmacological and cytokine-based treatments can be applied to investigate signaling pathways and cell type-specific responses. This easily customizable model aligns with the 3R principles by reducing animal use for in vivo dietary studies. The model is reproducible, cost-effective, and straightforward to implement, providing a versatile platform for studying adipocyte death, immune cell dynamics, and therapeutic strategies in AT inflammation.
Introduction
Adipose tissue (AT) is a metabolically active organ composed of approximately 20% adipocytes and a heterogeneous mixture of immune cells, fibroblasts, progenitor cells, and vascular cells in humans1. AT is classified into unilocular white adipose tissue (WAT), multilocular brown adipose tissue (BAT), and intermediate beige adipose tissue, reflecting heterogeneity in composition, function, and anatomical location. WAT is distributed among subcutaneous (SCAT), visceral (VAT), perivascular, and marrow adipose depots, which differ in developmental origin, gene expression profiles, and metabolic function. Beyond its role in lipid storage, AT functions as an endocrine organ by secreting cytokines, hormones, and adipokines2. Compared with SCAT, VAT is more metabolically active and enriched in inflammatory cells, making it particularly relevant for studies of AT inflammation and metabolic diseases such as type 2 diabetes3,4,5.
AT is a key regulator of metabolic health and plays a central role in obesity, which is associated with numerous comorbidities. Obesity promotes adipocyte hypertrophy, hyperplasia, and proliferation6, while AT expansion and inflammation strongly correlate with hyperglycemia, hyperinsulinemia, hypertriglyceridemia, and impaired glucose tolerance3. AT expansion is presumed to be accompanied by increased adipocyte death, with approximately 10% cellular turnover annually7, triggering macrophage recruitment that is essential for tissue clearance and remodeling8. Because adipocytes are substantially larger (100–200 µm) than macrophages, efficient phagocytosis by these approximately fivefold smaller cells is challenging, thereby impairing tissue homeostasis and promoting chronic AT inflammation9. Adipose tissue macrophages (ATMs) mediate the clearance of oversized dying adipocytes either by fusing into multinucleated giant cells (MGCs) or by forming crown-like structures (CLS) around dead adipocytes and degrading them through lysosomal exocytosis10,11,12. CLS abundance correlates with obesity-associated inflammation11,13.
In healthy AT, ATMs are predominantly anti-inflammatory M2-like macrophages, whereas obesity promotes a shift toward a pro-inflammatory M1-like phenotype14,15. Additional mechanistically distinct macrophage subsets emerge, including metabolically activated macrophages (MMes) and lipid-associated macrophages (LAMs), which play important roles in the clearance of dead adipocytes through lysosomal exocytosis16,17,18.
To investigate AT inflammation in a physiologically relevant multicellular environment, the protocol established an ex vivo mouse model based on organotypic explant cultures of VAT derived from lean mice. VAT explants cultured for 7–10 days develop an inflammatory phenotype comparable to that observed after at least 12 weeks of high-fat diet (HFD) feeding with respect to CLS formation, macrophage phenotype, and inflammatory cytokine production9,19. Importantly, this approach reduces animal use, eliminates the need for dietary intervention approvals, and contributes to the 3R principles by reducing the reliance on long-term dietary intervention studies. Compared with conventional two-dimensional (2D) cell culture systems, such as single-cell culture models (e.g., 3T3-L1 cells or primary adipocyte cultures), this method preserves tissue complexity and cellular diversity, thereby enabling the investigation of physiological cell–cell interactions, including those between immune cells and adipocytes.
Cultured AT explants are compatible with a wide range of analytical approaches. Live confocal imaging enables the monitoring of ATM accumulation, CLS formation, and MGC formation9,19. Collagenase digestion allows isolation of the stromal vascular fraction (SVF) for flow cytometric analyses, including proliferation assays and determination of M1-like, M2-like, or MMe phenotypes12. Gene expression analyses, including quantitative PCR (qPCR) and RNA sequencing, can be performed on whole explants, SVF cells, or sorted macrophages9. Protein expression and enzymatic activity can be assessed by Western blotting or ELISA12,20,21, while tissue architecture and marker expression can be visualized by whole-mount staining and immunofluorescence9,22. In addition, pharmacological and genetic interventions, including ATM depletion and cytokine treatment, are readily feasible21,23,24.
In summary, this ex vivo mouse model of HFD-like AT inflammation enables investigation of adipocyte death, direct in situ observation of cellular behavior, and pharmacological or genetic manipulations relevant to AT immunology (Figure 1).
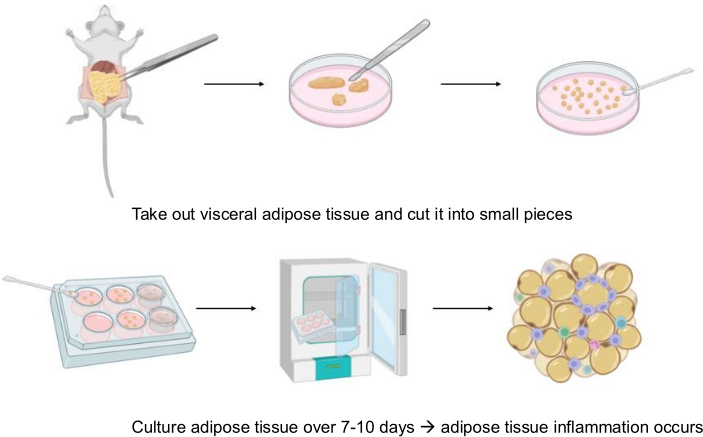
Figure 1: Graphical summary of the workflow. Visceral adipose tissue (AT) is isolated from mice, cut into small explants, and cultured for 7–10 days. During the culture period, explants develop an inflammatory phenotype, enabling the study of adipose tissue inflammation under controlled ex vivo conditions. Please click here to view a larger version of this figure.
Access restricted. Please log in or start a trial to view this content.
Protocol
Animal experiments were performed in accordance with institutional and national guidelines and were approved by the appropriate regulatory authorities. Csf1r-eGFP-Adipoq-ERT2-Cre-CAG-tdTomato mice ("MacFat", RRID: Csf1r-eGFP: RRID:IMSR_JAX:018549, Adipoq-iCreERT2: RRID:IMSR_JAX:025124, CAG-tdTomato: RRID:IMSR_JAX:007914)27,28 were used for representative microscopy experiments. This reporter line enables visualization of macrophages by GFP expression and adipocytes by tdTomato expression. Because tdTomato expression is lost following adipocyte death, adipocyte viability can be monitored during culture. Csf1r-eGFP reporter mice ("MacGreen", RRID:IMSR_JAX:018549)28 were used for macrophage visualization and flow cytometry analyses. C57BL/6J mice (RRID:IMSR_JAX:000664) were used for non-imaging experiments, including scRNA-seq and qPCR analyses. All transgenic lines were maintained as heterozygous mice on a C57BL/6J background.
Animal experiments followed the ‘Principles of laboratory animal care’ (NIH publication no. 85e23, revised 1985) and specific national laws and were approved by the local authorities of the state of saxony: Landesdirektion in Leipzig, Germany (animal experimental application: TV11-21-MEZ). According to local authorities, the experiments described do not constitute animal testing, as it states “if a vertebrate is killed solely for the purpose of using its organs or tissues for scientific purposes, this is not considered animal testing under § 7(2) of the Animal Welfare Act (TierSchG), but rather killing under § 4(3) of the Animal Welfare Act (TierSchG).” The killing of the animals must be reported in an ‘animal report.’ This report is included in the animal experimentation application. The ethics committee of the Faculty of Medicine at the University of Leipzig has also approved the research projects. In accordance with the guidelines of animal experimental application TV11-21-MEZ, the mice are euthanized by an overdose of the inhalation anesthetic isoflurane. An effective gas concentration (5% in O₂ carrier gas) is delivered via an isoflurane vaporizer. The euthanasia procedure is complete when definitive circulatory arrest (absence of breathing [feather test] and heartbeat [palpation]) is confirmed.
Mice were housed in a temperature-controlled (22 ± 2 °C), specific pathogen-free facility at Leipzig University in sibling groups of 3–5 animals under a 12 h light/dark cycle. Animals had ad libitum access to water and a standard chow diet (9% kcal fat; Sniff GmbH, Germany). Representative experiments were performed using male and female mice. The reagents, chemicals, and kits used in the protocol are listed in the Table of Materials.
1. Preparations
- Prepare reagents and equipments
- Prepare the culture medium under sterile conditions by supplementing RPMI-1640 with 10% fetal bovine serum (FBS) and 1% antibiotic solution.
- Warm the culture medium and sterile PBS to 37 °C.
- Clean all equipment and the work area inside the tissue culture hood with 70% ethanol.
- Prepare animals
- Sacrifice mice according to institutional guidelines. Optionally weigh the animals.
- Place the animals in a glass beaker containing 70% ethanol.
- Wipe the exterior of the glass beaker with ethanol and transfer it into the tissue culture hood.
2. Adipose tissue isolation (Figure 2)
- Prepare the mouse
- Place the mouse in a supine position in a glass dish using blunt forceps, or pin it to a dissection board.
- Add a thin layer of pre-warmed PBS to a Petri dish.
- Change to a fresh pair of gloves.
- Lift the lower abdominal skin with forceps and make a small horizontal incision using scissors to open the abdominal cavity.
- Make a vertical incision (~2 cm from caudal to rostral) extending from the initial cut to expose the internal organs.
- Isolate the fat pad
- Using small sharp scissors and pointed forceps, locate and excise the white adipose tissue. Use a separate set of instruments to prevent contamination.
- Male Mice: Gonadal fat is attached only to the epididymis and testis. Carefully lift the fat pad and cut above the epididymis, or excise the epididymis and testis together with the gonadal fat, and remove them afterward.
- Female mice: Gonadal fat is attached to the uterine horn and ovaries and is more prominent than in males. Carefully lift the fat pad and excise along the uterine horn and ovaries.
- Place the isolated fat pads into the PBS-filled Petri dish.
- Remove residual epididymis, testis, ovaries, or blood vessels using a razor blade.
- Transfer the cleaned fat pad into a second Petri dish containing pre-warmed PBS. Optionally weigh the fat pads.
NOTE: Weighing the fat pads before culture allows normalization of tissue mass between experimental conditions.
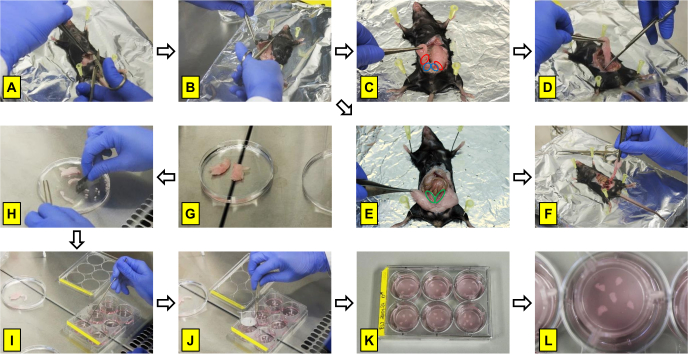
Figure 2: Isolation and culture of visceral adipose tissue explants. (A,B) Opening the abdominal cavity and exposing visceral adipose tissue. (C, D) Isolation of epididymal adipose tissue from male mice, fat is attached to the epididymis (red circles) and the testis (blue circles). (E, F) Isolation of gonadal adipose tissue from female mice, fat is attached to the uterine horn (green circles) and ovaries. (G, H) Preparation and trimming of adipose tissue explants. (I, J) Transfer of explants into culture wells and placement of cell culture inserts. (K, L) Representative images of explants during culture in 6-well plates. Please click here to view a larger version of this figure.
3. Explant preparation and culture
- Prepare explants
CAUTION: Razor blades are sharp and may cause injury. Handle with care and dispose of blades in accordance with institutional safety procedures.- Cut the fat pad into strips and then into cubes of approximately 10 mm3 (~10 mg per explant) using a razor blade.
- Establish explant cultures
- Add 1–1.5 mL of culture medium to each well of a 6-well plate.
NOTE: For normalization, use approximately 50 mg of adipose tissue per 1 mL of culture medium. - Transfer five explants into each well using a sterile spoon or spatula.
- Arrange the explants evenly in a circular pattern.
- Cover the explants with a cell culture insert using sterile forceps.
NOTE: Avoid introducing air bubbles when positioning the inserts, and ensure the explants are centered within them. - Incubate the explants at 37 °C, 5% CO₂, and 21% O₂ for 7–10 days.
NOTE: Use pre-warmed PBS and culture medium to enhance tissue viability. Work quickly to minimize the time that fat pads remain outside the incubator. Avoid contamination with mouse fur. If hair adheres to the tissue, remove it and rinse the tissue with warm PBS.
- Add 1–1.5 mL of culture medium to each well of a 6-well plate.
4. Downstream analyses
- After the 7–10 day culture period, collect explants, stromal vascular fraction cells, or culture supernatants for downstream analyses, including microscopy, flow cytometry, qPCR, ELISA, or RNA sequencing, as required for the experimental endpoint.
5. Statistical analysis
- Perform statistical analyses using GraphPad Prism 10.2. Screen data sets for outliers using the ROUT test (Q = 1%) and assess normality using the Shapiro–Wilk test (α = 0.05).
- Compare two groups using paired Student's t-tests or Wilcoxon matched-pairs tests, as appropriate. Compare multiple groups using one-way ANOVA followed by Dunnett's post hoc test. Consider differences statistically significant at p < 0.05.
- Present data as mean ± SEM. Unless otherwise indicated, define n as the number of biological replicates (individual mice).
Access restricted. Please log in or start a trial to view this content.
Results
General tissue viability was maintained throughout the culture period and was monitored using several complementary approaches. Tissue viability can be assessed by confocal microscopy using viability dyes such as Calcein25, antibody staining against Perilipin to evaluate adipocyte membrane integrity17,26, or transgenic reporter protein expression in adipocytes. Tissue vitality and integrity were preserved for up to 14 days in culture, alth...
Access restricted. Please log in or start a trial to view this content.
Discussion
Given the increasing global prevalence of metabolic diseases and diabetes, understanding the mechanisms underlying adipose tissue (AT) inflammation remains an important research objective. To address this need, an ex vivo explant culture system that enables the induction and analysis of AT inflammation under controlled experimental conditions was developed .
A critical requirement of this method is the preservation of tissue viability throughout the culture period. Using multiple comp...
Access restricted. Please log in or start a trial to view this content.
Disclosures
The authors declare no competing interests.
Acknowledgements
The authors thank Constance Hobusch and Florian Kirmse for excellent technical assistance. Flow cytometry analyses were performed at the Core Unit Fluorescence Technologies, Leipzig University, with technical support from Kathrin Jäger and Pia Glöckner. This work was supported by the Deutsche Forschungsgemeinschaft (DFG, German Research Foundation), Project Number 209933838 – SFB 1052 (Project B09).
Access restricted. Please log in or start a trial to view this content.
Materials
| Name | Company | Catalog Number | Comments |
|---|---|---|---|
| BD OptEIA Mouse TNF ELISA Kit | BD Biosciences | 560478 | |
| Bodipy 558/568 C12 | Flow cytometry: 1:10000; Staining: 1:2000 | Invitrogen | D3835 |
| Bovine Serum Albumin | 3% | Sigma | A9647 |
| CD107a (LAMP1) – AF647 | Staining: 1:100; Flow cytometry: 1:200 | BioLegend | 121610 |
| CD11c – BV605 | Flow cytometry: 1:100 | BioLegend | 117334 |
| CD16/32 | Flow cytometry: 1:100 | Invitrogen | 14-0161-82 |
| CD301 – AF647 | Flow cytometry: 1:50 | Bio-Rad | MCA2392A647 |
| CD36 – PE | Flow cytometry: 1:400 | BioLegend | 102606 |
| CD45 – PE | Flow cytometry: 1:100 | BD Pharmingen | 555483 |
| Click-iT Plus EdU Alexa Fluor 350 Flow Cytometry Assay Kit | EdU: 5 µM | Invitrogen | C10632 |
| Clodronate Liposomes | 500 µg/ml clodronate | Liposoma | |
| Collagenase Type 2 | 1 mg/ml, 315 U/mg | Worthington | LS004176 |
| CyQUANT LDH Cytotoxicity Assay Kit | Invitrogen | C20301 | |
| DAPI | Flow cytometry: 0.2 µg/ml | Thermo Fisher | 62248 |
| Ethanol | 70% | Carl Roth | T913.1 |
| F4/80 – AF647 | Flow cytometry: 1:100 | Invitrogen | MF48021 |
| F4/80 – PE-Cy7 | Flow cytometry: 1:200 | Invitrogen | 25-4801-82 |
| Fetal Calf Serum | 1.10 | Gibco | 10270106 |
| Fetal Calf Serum | 1.20 | Gibco | 10270106 |
| HBSS (-Mg, -Ca) | Gibco | 14170138 | |
| HEPES | 13 mM | Roth | HN77.2 |
| Hoechst 33342 | 1:10,000 | Life Technologies | H3570 |
| LysoTracker – AF647 | Flow cytometry: 1:20000; Staining: 1:10000 | Invitrogen | H34477 |
| MAC-2 | Staining: 1:1000 | Cedarlane | CL8942AP |
| Millicell Cell Culture Insert, 30 mm, hydrophilic PTFE, 0.4 µm | Merck Millipore | PICM0RG50 | |
| PBS (-Mg, -Ca) | Gibco | 14190169 | |
| PBS (-Mg, -Ca) | Gibco | 14190169 | |
| Penicillin/Streptomycin (10,000 U/ml) | 0.111111111 | Gibco | 11548876 |
| Penicillin/Streptomycin (10,000 U/ml) | 0.111111111 | Gibco | 11548876 |
| Perilipin | 2 µg/ml | Abcam | ab3526 |
| Plexxicon 5622 | 40 µM | Plexxicon Inc. | HY-114153 |
| RPMI-Media 1640 | with 11 mM glucose | Sigma Aldrich | R8758 |
| RPMI-Media 1640 | Sigma | R8758 | |
| TC-Insert for 6-well plates | Sarstedt | 83.3930.040 | |
| TPP tissue culture test plate 6 | TPP | 92006 | |
| Triton X-100 | 1% | Carl Roth | 3051.2 |
| Zinc chloride | 0.8 mM | Sigma | Z0152 |
| Zinc formaline | Polyscience | 21516-3.75 |
References
- Massier L, et al. An integrated single cell and spatial transcriptomic map of human white adipose tissue. Nat Commun. 2023;14(1):1438. doi:10.1038/s41467-023-36983-2.
- Rosen ED, Spiegelman BM. What We Talk About When We Talk About Fat. Cell. 2014;156(1-2):20-44. doi:10.1016/j.cell.2013.12.012.
- Ibrahim MM. Subcutaneous and visceral adipose tissue: structural and functional differences. Obes Rev. 2010;11(1):11-18. doi:10.1111/j.1467-789X.2009.00623.x.
- Bruun JM, Lihn AS, Pedersen SB, Richelsen B. Monocyte chemoattractant protein-1 release is higher in visceral than subcutaneous human adipose tissue: implication of macrophages resident in adipose tissue. J Clin Endocrinol Metab. 2005;90(4):2282-2289. doi:10.1210/jc.2004-1696.
- Curat CA, et al. Macrophages in human visceral adipose tissue: increased accumulation in obesity and a source of resistin and visfatin. Diabetologia. 2006;49(4):744-747. doi:10.1007/s00125-006-0173-z.
- Wang QA, Tao C, Gupta RK, Scherer PE. Tracking adipogenesis during white adipose tissue development, expansion and regeneration. Nat Med. 2013;19(10):1338-1344. doi:10.1038/nm.3324.
- Spalding KL, et al. Dynamics of fat cell turnover in humans. Nature. 2008;453(7196):783-787. doi:10.1038/nature06902.
- Weisberg SP, McCann D, Desai M, Rosenbaum M, Leibel RL, Ferrante AW. Obesity is associated with macrophage accumulation in adipose tissue. J Clin Invest. 2003;112(12):1796-1808. doi:10.1172/JCI200319246.
- Lindhorst A, et al. Adipocyte death triggers a pro-inflammatory response and induces metabolic activation of resident macrophages. Cell Death Dis. 2021;12(6):579. doi:10.1038/s41419-021-03872-9.
- Braune J, et al. Multinucleated giant cells in adipose tissue are specialized in adipocyte degradation. Diabetes. 2021;70(2):538-548. doi:10.2337/db20-0293.
- Cinti S, et al. Adipocyte death defines macrophage localization and function in adipose tissue of obese mice and humans. J Lipid Res. 2005;46(11):2347-2355. doi:10.1194/jlr.M500294-JLR200.
- Wehr R, Lindhorst A, Arndt L, Krueger M, Raulien N, Gericke M. Lysosomal exocytosis by macrophages as a druggable mechanism for anti-inflammatory clearance of dead adipocytes in adipose tissue. Cell Death Dis. 2025. doi:10.1038/s41419-025-08334-0.
- Altintas MM, et al. Apoptosis, mastocytosis, and diminished adipocytokine gene expression accompany reduced epididymal fat mass in long-standing diet-induced obese mice. Lipids Health Dis. 2011;10(1):198. doi:10.1186/1476-511X-10-198.
- Lumeng CN, Bodzin JL, Saltiel AR. Obesity induces a phenotypic switch in adipose tissue macrophage polarization. J Clin Invest. 2007;117(1):175-184. doi:10.1172/JCI29881.
- Lumeng CN, DelProposto JB, Westcott DJ, Saltiel AR. Phenotypic switching of adipose tissue macrophages with obesity is generated by spatiotemporal differences in macrophage subtypes. Diabetes. 2008;57(12):3239-3246. doi:10.2337/db08-0872.
- Haka AS, et al. Exocytosis of macrophage lysosomes leads to digestion of apoptotic adipocytes and foam cell formation. J Lipid Res. 2016;57(6):980-992. doi:10.1194/jlr.M064089.
- Strissel KJ, et al. Adipocyte death, adipose tissue remodeling, and obesity complications. Diabetes. 2007;56(12):2910-2918. doi:10.2337/db07-0767.
- Xu R, et al. Lipid-associated macrophages between aggravation and alleviation of metabolic diseases. Trends Endocrinol Metab. 2024. doi:10.1016/j.tem.2024.04.009.
- Gericke M, Weyer U, Braune J, Bechmann I, Eilers J. A method for long-term live imaging of tissue macrophages in adipose tissue explants. Am J Physiol Endocrinol Metab. 2015;308(11). doi:10.1152/ajpendo.00075.2015.
- Gericke MT, et al. Receptors for NPY and PACAP differ in expression and activity during adipogenesis in the murine 3T3-L1 fibroblast cell line. Br J Pharmacol. 2009;157(4):620-632. doi:10.1111/j.1476-5381.2009.00164.x.
- Arndt L, et al. The role of IL-13 and IL-4 in adipose tissue fibrosis. Int J Mol Sci. 2023;24(6):5672. doi:10.3390/ijms24065672.
- Haase J, et al. Local proliferation of macrophages in adipose tissue during obesity-induced inflammation. Diabetologia. 2014;57(3):562-571. doi:10.1007/s00125-013-3139-y.
- Braune J, et al. IL-6 regulates M2 polarization and local proliferation of adipose tissue macrophages in obesity. J Immunol. 2017;198(7):2927-2934. doi:10.4049/jimmunol.1600476.
- Neugebauer J, et al. The Impact of Resident Adipose Tissue Macrophages on Adipocyte Homeostasis and Dedifferentiation. Int J Mol Sci. 2024;25(23):13019. doi:10.3390/ijms252313019.
- Schopow N, et al. Examination of ex vivo viability of human adipose tissue slice culture. PLoS One. 2020;15(5). doi:10.1371/journal.pone.0233152.
- Braune J, et al. Hedgehog signalling in myeloid cells impacts on body weight, adipose tissue inflammation and glucose metabolism. Diabetologia. 2017;60(5):889-899. doi:10.1007/s00125-017-4223-5.
- Van Rooijen N, Van Nieuwmegen R. Elimination of phagocytic cells in the spleen after intravenous injection of liposome-encapsulated dichloromethylene diphosphonate: an enzyme-histochemical study. Cell Tissue Res. 1984;238(2):355-358. doi:10.1007/BF00217308.
- Sasmono RT, et al. A macrophage colony-stimulating factor receptor-green fluorescent protein transgene is expressed throughout the mononuclear phagocyte system of the mouse. Blood. 2003;101(3):1155-1163. doi:10.1182/blood-2002-02-0569.
- Blüher M. Adipose tissue dysfunction in obesity. Exp Clin Endocrinol Diabetes. 2009;117(6):241-250. doi:10.1055/s-0029-1192044.
- Hotamisligil GS, Shargill NS, Spiegelman BM. Adipose expression of tumor necrosis factor-alpha: direct role in obesity-linked insulin resistance. Science. 1993;259(5091):87-91. doi:10.1126/science.7678183.
- Cohen M, et al. Adipose tissue explant culture using PDMS flow chambers: an alternative to static explant culture. Adipocyte. 2025;14(1):2578286. doi:10.1080/21623945.2025.2578286.
- Du ZY, et al. Depot-dependent effects of adipose tissue explants on co-cultured hepatocytes. PLoS One. 2011;6(6). doi:10.1371/journal.pone.0020917.
- Murano I, et al. Dead adipocytes, detected as crown-like structures, are prevalent in visceral fat depots of genetically obese mice. J Lipid Res. 2008;49(7):1562-1568. doi:10.1194/jlr.M800019-JLR200.
Access restricted. Please log in or start a trial to view this content.
Reprints and Permissions
