This protocol describes the development of a fibroblast-based adenoviral reporter system driven by a mouse type I collagen promoter to enable longitudinal monitoring of fibroblast activation and facilitate high-throughput screening of antifibrotic compounds.
A subscription to JoVE is required to view this content. Sign in or start your free trial.
Method Article
A Fibroblast-Based Adenoviral Reporter System Driven by the Mouse Collagen Type I Alpha 1 Promoter for Antifibrotic Drug Screening
* These authors contributed equally
In This Article
Summary
Abstract
Cardiac fibrosis, characterized by aberrant fibroblast activation and excessive extracellular matrix deposition, lacks target-specific therapies, largely due to the absence of longitudinal, scalable, and non-destructive in vitro screening platforms. Traditional end-point assays and resource-intensive stem cell models inherently preclude real-time monitoring of fibrotic progression. To overcome these limitations, this protocol describes the generation, optimization, and validation of a mouse collagen type I alpha 1 (Col1a1) promoter-driven adenoviral mCherry fluorescent reporter system (Ad-mCol1a1p-mCherry) in NIH/3T3 fibroblasts. The critical steps for recombinant adenovirus packaging, transduction optimization (multiplicity of infection) to minimize cytotoxicity, and the establishment of a robust transforming growth factor beta (TGF-β)-induced fibrosis model are detailed. By circumventing the need for cell fixation, this system enables direct and longitudinal monitoring of collagen transcription in live cells. The model’s specificity and reliability are pharmacologically validated using the TGF‑β type I receptor (ALK5) inhibitor SB431542, with fluorescent readouts correlating with endogenous fibrotic markers quantified via reverse transcription quantitative polymerase chain reaction and enzyme-linked immunosorbent assay. Ultimately, this cost-effective platform provides an accessible tool for the high-throughput screening of novel antifibrotic agents, thereby accelerating translational cardiovascular research.
Introduction
The management of cardiac fibrosis presents significant clinical challenges. Characterized by the aberrant activation of quiescent fibroblasts into myofibroblasts and excessive extracellular matrix (ECM) deposition, it represents an irreversible terminal pathway shared by heart failure, myocardial infarction, and other cardiovascular diseases1,2,3. However, current treatment strategies face significant limitations. Conventional interventions—such as diuretics, β-blockers, and renin–angiotensin–aldosterone system inhibitors—primarily alleviate systemic hemodynamic stress and mitigate neurohumoral activation4,5,6,7. These therapies fail to directly target fibroblast activation or halt ongoing collagen deposition. Furthermore, although signaling cascades such as the transforming growth factor beta (TGF-β)/Smad pathway, oxidative stress, and metabolic reprogramming drive this pathology, translating these insights into direct-acting antifibrotic therapies remains challenging due to systemic toxicities and non-specific delivery mechanisms8,9,10. Thus, there is an urgent need for novel, target-specific antifibrotic therapies. A major translational bottleneck is the lack of functional evaluation systems capable of sensitively and dynamically reporting fibroblast activation. Traditional experimental models exhibit significant limitations that preclude efficient pharmacological screening11,12. While in vivo animal models recapitulate global cardiac remodeling, they suffer from interspecies differences, prolonged experimental timelines, high costs, and low throughput11.
To overcome these hurdles, various in vitro screening platforms have emerged; however, critical methodological flaws remain. High-content immunofluorescence assays require destructive cell fixation and laborious processing, providing only a static snapshot rather than capturing the real-time kinetics of fibroblast activation. Similarly, platforms integrating label-free impedance monitoring with mass spectrometry (MS/MS) suffer from non-specificity and low scalability, as impedance drops caused by general cellular toxicity can be easily confounded with true antifibrotic efficacy. Furthermore, clustered regularly interspaced short palindromic repeats (CRISPR)-engineered reporter systems utilizing induced pluripotent stem cells (iPSCs) to track cytoskeletal markers (e.g., alpha-smooth muscle actin [α-SMA]/ACTA2) present steep translational barriers13. These iPSC-based models are prohibitively expensive, technically demanding, and largely inaccessible for routine high-throughput screening. Moreover, reliance on cytoskeletal markers such as α-SMA may not accurately reflect the pathological endpoint, as their expression does not strictly correlate with the functional secretion and excessive deposition of ECM14. Hence, these systems are insufficient to longitudinally map early-stage cellular responses to pharmacological interventions.
In contrast, this protocol describes a longitudinal functional reporter system driven by the collagen type I alpha 1 (Col1a1) promoter, with the goal of establishing a non-destructive and robust platform to monitor fibroblast activation. Because type I collagen is the predominant ECM component deposited during cardiac remodeling, capturing the transcriptional activation of its encoding gene, Col1a1, serves as a direct and pathologically relevant readout for fibroblast activation. This Col1a1 promoter-based model enables continuous, molecular-level monitoring of fibrotic processes, offering a sensitive, longitudinal, and quantifiable platform optimized for mechanism-based drug screening.
Access restricted. Please log in or start a trial to view this content.
Protocol
We confirm that all experiments were performed in accordance with institutional and national guidelines. Because this study exclusively utilized the established NIH Swiss mouse embryo fibroblast cell line (NIH/3T3) and the mCol1a1p-mCherry reporter system, and did not involve any vertebrate animals, embryos, or human subjects, ethical approval from an institutional review board was not required for the procedures described in this manuscript.
All procedures involving recombinant adenoviral vectors were conducted in accordance with institutional biosafety regulations and standard Biosafety Level 2 (BSL-2) practices. Viral handling, transduction, storage, and waste disposal were performed using certified biological safety cabinets and appropriate personal protective equipment. Liquid waste containing adenoviral material was decontaminated using freshly prepared bleach solution prior to disposal, and contaminated consumables were autoclaved according to institutional biosafety protocols. Accidental spills were immediately disinfected using approved virucidal agents following institutional spill-response procedures.
1. Overview of the Experimental Workflow
- Generate a mouse Col1a1 promoter-driven recombinant adenovirus as described in Step 2.
- Optimize viral transduction conditions in NIH/3T3 fibroblasts as described in Step 3.
- Establish a TGF-β-responsive in vitro fibrosis reporter model as described in Step 4.
- Validate model stability, specificity, and biological reproducibility using time- and dose-dependent TGF-β stimulation as described in Step 4.
- Perform pharmacological inhibition using SB431542 as described in Step 5.
- Perform downstream enzyme-linked immunosorbent assay (ELISA) and quantitative real-time polymerase chain reaction (qPCR) analyses as described in Step 5.
NOTE: Refer to Figure 1A for a schematic overview of the experimental workflow. Refer to the Table of Materials for experimental apparatus and reagents.
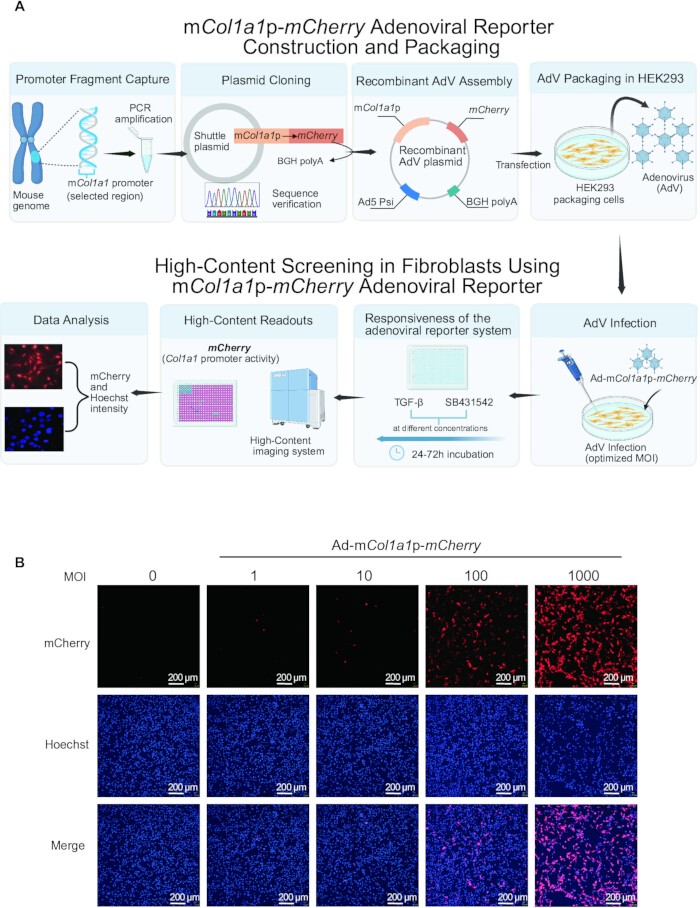
Figure 1. Establishment and validation workflow of the mCol1a1p-mCherry adenoviral reporter system in fibroblasts. (A) Schematic overview of the construction of the adenoviral (AdV) mCol1a1p-mCherry reporter system and the experimental workflow for model validation in NIH/3T3 fibroblasts. The workflow includes promoter cloning, recombinant adenovirus assembly, viral packaging in HEK293 cells, optimization of multiplicity of infection (MOI), and downstream high-content fluorescence screening. (B) Representative fluorescence images of NIH/3T3 fibroblasts infected with the Ad-mCol1a1p-mCherry adenovirus at MOIs of 0, 1, 10, 100, and 1000. Nuclei were stained with Hoechst 33342 (blue), and mCherry fluorescence (red) indicates Col1a1 promoter activity. Fluorescence intensity was quantified using high-content imaging and normalized to nuclear counts. An MOI of 100 was selected for subsequent experiments based on robust and homogeneous reporter expression with minimal morphological alterations. Scale bars = 200 µm. This figure was created with BioRender.com with approved licenses. Please click here to view a larger version of this figure.
2. Construction, Packaging, and Amplification of mCol1a1 Promoter Adenovirus
- Construction of the recombinant adenoviral vector
- Clone the 2354 bp mouse Col1a1 promoter fragment (genomic coordinates: chr11:94824779–94827132; −2271 to +83 bp relative to the transcription start site [TSS]) upstream of the mCherry reporter gene into the pDC315 adenoviral shuttle vector.
NOTE: The complete sequence of the Col1a1 promoter and the detailed pDC315-mCol1a1p-mCherry plasmid map are provided in the Supplementary File 1 and Supplementary Figure 1. - Linearize the pDC315 vector using BamHI and KpnI. Amplify the promoter insert using primers containing 15–25 bp homology arms.
NOTE: Use a homologous recombination-based seamless cloning strategy to facilitate in vitro recombination. - Verify the resulting plasmid by PCR screening and Sanger sequencing.
NOTE: Carefully inspect the promoter–reporter junction sequence to ensure that no frameshifts or premature stop codons are present. - Generate the recombinant adenovirus using the AdMax system through intracellular Cre-mediated recombination.
NOTE: The pBHGloxΔE1,3Cre backbone plasmid contains a nonreplicative Ad5 genome with E1/E3 deletions and a Cre recombinase expression cassette that facilitates site-specific recombination with the loxP site on the shuttle vector. - Co-transfect HEK293 cells with the validated pDC315-mCol1a1p-mCherry shuttle vector and the pBHGloxΔE1,3Cre adenoviral backbone plasmid.
- Clone the 2354 bp mouse Col1a1 promoter fragment (genomic coordinates: chr11:94824779–94827132; −2271 to +83 bp relative to the transcription start site [TSS]) upstream of the mCherry reporter gene into the pDC315 adenoviral shuttle vector.
- Adenovirus packaging and amplification
- Maintain HEK293 cells in Dulbecco’s Modified Eagle Medium (DMEM) supplemented with 10% fetal bovine serum (FBS). Use low-passage cells (<20 passages) for adenoviral packaging.
- Seed HEK293 cells at 30%–40% confluence 24 h before transfection to achieve 50%–60% confluence at the time of transfection.
- Co-transfect HEK293 cells with 5 µg shuttle plasmid and 5 µg pBHGloxΔE1,3Cre helper plasmid using Lipofectamine 2000 transfection reagent.
NOTE: Maintain a DNA-to-reagent ratio of 1:1 (10 µg total DNA to 10 µL transfection reagent). - Culture the transfected cells at 37°C with 5% CO₂ and monitor them daily for cytopathic effects.
NOTE: Initial CPE may require 7–14 days to appear. If the medium becomes acidic (yellow), perform a gentle half-medium exchange without disturbing the cells. - Harvest the cells and supernatant when typical CPE, characterized by cell rounding and shrinkage, is observed and at least 50% of the cells have detached from the culture surface.
NOTE: This stage is typically reached 10–15 days post-transfection. - Perform three freeze–thaw cycles by freezing the samples at −70°C for 30 min and thawing them in a 37°C water bath.
- Vortex the suspension for 30 s after each thawing step to facilitate cell lysis.
NOTE: Avoid prolonged incubation at 37°C during thawing to preserve viral stability. - Prepare 10-fold serial dilutions of the viral lysate (10−1 to 10−13) using complete DMEM. Add 90 µL of each viral dilution to HEK293 cells seeded in 96-well plates using 10 replicate wells per dilution.
NOTE: A viral titer of ≥1 × 10⁹ PFU/mL was defined as sufficient amplification endpoint for downstream purification. - Clarify 10 mL crude viral lysate through a 0.45 µm filter to remove cellular debris.
- Treat the clarified lysate with Benzonase nuclease (10 U/mL) at 37°C for 30 min.
- Purify the recombinant adenovirus using the Adeno-X Virus Purification Kit according to the manufacturer’s instructions.
NOTE: Mix the lysate with 1× dilution buffer before loading onto the pre-equilibrated purification filter. Wash the filter with 1× Wash Buffer and elute the purified virus using 3 mL 1× Elution Buffer. - Incubate the plates for 10 days and evaluate cytopathic effects (CPE) under a light microscope. Score positive CPE based on characteristic cell rounding and detachment. Calculate the infectious viral titer using the Spearman–Karber method based on CPE scoring.
NOTE: Ensure that the final viral stock reaches at least 1 × 10¹¹ PFU/mL for downstream applications. - Aliquot the purified adenovirus and store the viral stock at −80°C.
NOTE: Store purified adenoviral aliquots at −80°C for long-term preservation. Avoid repeated freeze–thaw cycles to preserve viral infectivity.
3. Cell Culture and Optimization of Viral Infection Conditions
- Maintain NIH/3T3 fibroblasts in DMEM/Nutrient Mixture F-12 (DMEM/F12) supplemented with 10% FBS and 1% penicillin–streptomycin.
NOTE: Use cells between passages 3 and 8 that have reached 70%–80% confluence in the source flask to ensure consistent cell status. - Seed NIH/3T3 fibroblasts into 384-well plates at 4 × 10³ cells per well in 40 µL complete culture medium.
- Incubate the cells at 37°C with 5% CO₂ for 12 h to allow cell attachment and entry into the logarithmic growth phase.
NOTE: To minimize uneven cell distribution and edge effects, rest the plates at room temperature for 20–30 min before incubation. Fill the outermost wells with sterile phosphate-buffered saline (PBS) or sterile water. - Infect the cells with the recombinant adenovirus at multiplicities of infection (MOIs) ranging from 1–1,000 alongside an uninfected control.
NOTE: Calculate the required adenoviral volume using the following formula:
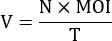
Here, V is the adenoviral stock volume (mL), N is the number of seeded cells per well (4 × 10³), MOI is the desired multiplicity of infection, and T is the infectious viral titer (PFU/mL). The viral stock used in this study had an infectious titer of 1 × 10¹¹ PFU/mL, as determined by the Spearman–Karber method described in Step 2.2.12. - Ensure that the added viral stock volume does not exceed 10% of the total well volume.
NOTE: Excessive viral stock volumes may alter medium pH and induce nonspecific cytotoxicity. - Replace the virus-containing medium with 40 µL fresh complete culture medium 24 h post-infection.
NOTE: Use DMEM/F12 supplemented with 10% FBS and 1% penicillin–streptomycin, consistent with Step 3.1. - Perform medium exchange using a low-speed automated liquid handler or by carefully angling multichannel pipette tips against the upper side wall of each well.
NOTE: Avoid standard vacuum aspiration when handling 384-well plates to minimize cell detachment. - Define the optimal MOI as the lowest viral dose that produces visible and homogeneous mCherry fluorescence while maintaining cell morphology and nuclear counts comparable to those of uninfected control cells.
NOTE: Assess reporter expression using Hoechst-stained nuclear counts and fluorescence imaging. Cells should retain their characteristic spindle-shaped morphology without rounding or detachment. Excessively high MOIs may induce basal mCherry activation through cellular stress responses. Representative fluorescence outcomes at different MOIs are shown in Figure 1B. - Select the optimized MOI for all downstream experiments.
NOTE: In this study, an MOI of 100 was selected for subsequent experiments.
4. Evaluation of Model Stability Using TGF-β Stimulation
- Infect NIH/3T3 fibroblasts with the recombinant adenovirus at the optimized MOI of 100, as determined in Step 3.9.
- Serum-starve the fibroblasts in DMEM/F12 containing 0.2% FBS for 12 h before TGF-β stimulation.
NOTE: Serum starvation was performed to synchronize the cells and minimize basal activation of the Col1a1 promoter. - Prepare a recombinant human TGF-β stock solution at 100 µg/mL using 4 mM HCl containing 0.1% bovine serum albumin (BSA).
NOTE: Aliquot the TGF-β stock solution into small volumes and store at −80°C to avoid repeated freeze–thaw cycles. - Treat the cells with a TGF-β concentration gradient ranging from 0–40 ng/mL in six independent biological replicates.
NOTE: The 0 ng/mL condition served as the unstimulated control group. - Incubate the stimulated cells at 37°C with 5% CO₂ for 24, 48, or 72 h. Use separate parallel plates for each imaging time point to minimize cumulative phototoxicity.
- Stain the cells with Hoechst 33342 solution at a final working concentration of 2.5 µg/mL for 15 min before imaging.
NOTE: Prepare the staining solution by diluting the 10 mg/mL Hoechst 33342 stock solution at a 1:4,000 ratio in sterile PBS. Perform staining under light-protected conditions to minimize photobleaching. - Acquire fluorescence images using a high-content imaging system equipped with a 10× dry objective lens.
- Capture five nonoverlapping fields per well in the 384-well plate format for each experimental condition.
NOTE: Maintain identical imaging settings across all experimental groups to ensure comparability. Use automated laser-based autofocus and maintain environmental control conditions at 37°C with 5% CO₂ during live-cell imaging. - Acquire mCherry fluorescence images using 561 nm excitation, a Bandpass 600/52 (BP600/52) emission filter, and 200 ms exposure time.
- Acquire Hoechst fluorescence images using 405 nm excitation, a BP445/45 emission filter, and 30 ms exposure time.
NOTE: Set the camera gain to 1.0 and acquire all images at full camera resolution using 1 × 1 binning to maintain linear fluorescence detection and maximize spatial resolution. - Analyze the acquired images using CellPathfinder image-analysis software.
- Identify nuclei in the Hoechst channel as primary objects using a reference nuclear diameter of 20 µm and an area range of 20–400 µm2.
- Define cytoplasmic regions of interest (ROIs) in the mCherry channel by expanding from the nuclear boundary using a reference cell diameter of 60 µm.
NOTE: Apply an “Exclude Edge” filter during segmentation to remove partial cells touching the image borders. - Calculate the mean fluorescence intensity for each identified cell and determine the average fluorescence intensity per well from all five captured fields.
5. Validation of Model Reliability Using ELISA and Quantitative Real-Time Polymerase Chain Reaction
- Infect NIH/3T3 fibroblasts with the recombinant adenovirus at the optimized MOI of 100, as described in Step 3.9.
- Pre-treat the cells with SB431542 for 30–60 min before TGF-β stimulation.
NOTE: Prepare a 20 mM SB431542 stock solution in dimethyl sulfoxide (DMSO) and store the aliquots at −20°C. - Treat the cells with 10 ng/mL TGF-β and SB431542 at final concentrations of 1, 5, 10, and 15 µM. Include a vehicle control group containing 0.1% (v/v) DMSO without SB431542 treatment.
NOTE: Maintain the final DMSO concentration at 0.1% (v/v) across all treatment groups. - Prepare the TGF-β working solution using a two-step dilution method.
NOTE: Dilute the 100 µg/mL TGF-β stock solution (prepared in 4 mM HCl containing 0.1% BSA) 1:100 in sterile PBS before further dilution into complete culture medium to achieve the final working concentration of 10 ng/mL. - Incubate the treated cells in 6-well plates for 24 h at 37°C with 5% CO₂.
- Collect 2 mL culture supernatant from each well for ELISA analysis.
- Centrifuge the collected supernatants at 1,000 × g for 5 min at 4°C to remove cellular debris.
- Aliquot the clarified supernatants and store them at −80°C until ELISA analysis.
NOTE: Clarified supernatants may be stored at −80°C before ELISA analysis. - Wash the adherent cells gently with ice-cold PBS after supernatant removal.
- Add 1 mL TRIzol reagent directly to each well to lyse the cells.
NOTE: Pipette the lysate several times to ensure complete homogenization before transferring the samples into microcentrifuge tubes. RNA lysates may be stored at −80°C before RNA extraction. - Extract total RNA from the lysates for reverse transcription quantitative polymerase chain reaction (RT-qPCR) analysis.
- Perform reverse transcription using 1 µg total RNA.
NOTE: Conduct reverse transcription using the following reaction conditions: 25°C for 10 min, 42°C for 15 min, and 85°C for 2 min. - Perform quantitative PCR using PerfectStart Green qPCR SuperMix. Prepare each reaction in a final volume of 20 µL containing 5 µL complementary DNA (cDNA) template.
- Run the qPCR reactions using the following cycling conditions: initial denaturation at 94°C for 30 s, followed by 40 cycles of 94°C for 5 s, 60°C for 15 s, and 72°C for 10 s.
NOTE: Perform melting-curve analysis after amplification to confirm product specificity. - Normalize Col1a1 gene expression to 18S rRNA as the internal control.
NOTE: All primer sequences are provided in Supplementary Table 1. - Quantify secreted Collagen I protein levels in the clarified supernatants using ELISA according to the manufacturer’s instructions. The standard-curve range for the mouse type I collagen ELISA assay is 0.78–50 ng/mL, with an assay detection sensitivity of 0.37 ng/mL.
- Analyze all standards and samples in technical duplicates and measure the optical density (OD) at 450 nm using a microplate reader.
NOTE: Use undiluted clarified supernatants to maximize assay sensitivity for secreted Col1a1 detection.
Access restricted. Please log in or start a trial to view this content.
Results
A schematic overview of the construction and packaging of the mCol1a1p-mCherry recombinant adenovirus is shown in Figure 1A. The mouse Col1a1 promoter was cloned upstream of the mCherry reporter gene and incorporated into an adenoviral vector, followed by viral packaging and amplification in HEK293 cells. The workflow illustrates key experimental steps, including viral infection, fibrotic stimulation, pharmacological intervention, and fluorescence-based si...
Access restricted. Please log in or start a trial to view this content.
Discussion
Cardiac fibrosis contributes to the progression of heart failure, and the development of effective antifibrotic therapies is limited by the lack of longitudinal screening platforms2,13. Conventional methods for evaluating antifibrotic efficacy, including Western blotting, RT-qPCR, and immunofluorescence staining, rely on endpoint measurements that require cell lysis or fixation. These approaches prevent real-time monitoring of fibrotic progression in living cells...
Access restricted. Please log in or start a trial to view this content.
Disclosures
The authors have no conflicts of interest to disclose.
Acknowledgements
This work was supported by grants from the National Natural Science Foundation of China (32371158 to H.X.), National Key R&D Program (2023YFA1800902 to H.X.), "Tianchi Talent" program, Open Project of the National Key Laboratory of Vascular Homeostasis and Remodeling (Peking University) (202404 to R.Z; 202403 to Y.M.W.), Open Project of the Key Laboratory of Xinjiang Endemic and Ethnic Diseases, Ministry of Education (Peking University) (KF202404 to H.X.).
Access restricted. Please log in or start a trial to view this content.
Materials
| Name | Company | Catalog Number | Comments |
|---|---|---|---|
| 384-Well Glass-Bottom Microplate | Cellvis, USA | P384-1.5H-N | 384-well glass-bottom plate used for cell seeding, viral infection, staining, and fluorescence imaging. |
| Adenoviral Backbone Plasmid | Microbix, Canada | pBHGloxΔE1,3Cre | Plasmid used to generate the full-length recombinant adenoviral genome. |
| Adenoviral Shuttle Vector: pDC315-mCol1a1p-mCherry | GeneChem, China | Custom service | Recombinant adenoviral shuttle vector containing the 2354 bp mouse Col1a1 promoter driving mCherry expression. |
| Benzonase Nuclease | Merck Millipore, USA | 70664-3 | Endonuclease used during adenoviral purification to remove contaminating nucleic acids. |
| Biological Safety Cabinet (Class II) | Esco Lifesciences Group, Singapore | AC2-4S1 | Certified biosafety cabinet used for recombinant adenoviral handling and sterile cell culture procedures. |
| Cell Culture Medium (Complete DMEM/F12) | HyClone, USA | 12800-017 | Complete culture medium used for NIH/3T3 and HEK293 cell maintenance. |
| CellPathfinder Image Analysis Software | Yokogawa Electric Corporation, Japan | Version 3.08.01 | Image-analysis software used for automated fluorescence quantification and cell segmentation. |
| CellVoyager CV8000 High-Content Screening System | Yokogawa Electric Corporation, Japan | CV8000 | High-content imaging system used for mCherry and Hoechst fluorescence acquisition. |
| CO2 Cell Culture Incubator | Thermo Fisher Scientific, USA | 3111 | Humidified incubator maintained at 37 °C with 5% CO2 for mammalian cell culture. |
| Dimethyl Sulfoxide (DMSO) | Sigma-Aldrich, USA | D2650 | Solvent used for SB431542 preparation. |
| Dulbecco’s Modified Eagle Medium/Nutrient Mixture F-12 (DMEM/F-12) | Servicebio, China | G4610 | Basal culture medium used for NIH/3T3 fibroblasts. |
| Fetal Bovine Serum (FBS) | Ausbian, Australia | VS500T | Serum supplement used at 10% (v/v) for complete culture medium preparation. |
| Hoechst 33342 Fluorescent Stain | Invitrogen, USA | H3570 | Nuclear stain used for fluorescence imaging and nuclear count normalization. |
| HEK293 Cells | ATCC, USA | CRL-1573 | Packaging cell line used for adenoviral production and amplification. |
| Human Recombinant TGF-β1 | MedChemExpress, China | HY-P78214 | Cytokine used to induce fibrotic activation in NIH/3T3 fibroblasts. |
| Image Acquisition Software | Yokogawa Electric Corporation, Japan | Version 3.08.01.03 | Software used for automated fluorescence image acquisition and microscope control. |
| Lipid-Based Transfection Reagent | Invitrogen, USA | 11668-019 | Transfection reagent used for adenoviral plasmid delivery into HEK293 cells. |
| Microcentrifuge Tubes | Axygen, USA | MCT-150-C | Tubes used for RNA lysate storage and sample processing. |
| Microplate Reader | Tecan, Switzerland | Spark | Multimode microplate reader used for ELISA absorbance measurements. |
| Mouse Type I Collagen ELISA Kit | Meike Biotechnology, China | MK6778A | ELISA kit used to quantify secreted type I collagen in culture supernatants. |
| NIH/3T3 Mouse Fibroblasts | Procell Life Science, China | CL-0171 | Mouse fibroblast cell line used for reporter model establishment and validation. |
| PacI Restriction Enzyme | New England Biolabs, USA | R0547S | Restriction enzyme used for adenoviral plasmid linearization. |
| Penicillin–Streptomycin Solution | Gibco, USA | 15140-122 | Antibiotic solution supplemented at 1% (v/v) to prevent bacterial contamination. |
| PerfectStart Green qPCR SuperMix | TransGen Biotech, China | AQ602 | SYBR Green-based qPCR master mix used for quantitative PCR analysis. |
| Phosphate-Buffered Saline (PBS) | Servicebio, China | G4202 | Buffer used for washing cells and reagent preparation. |
| pDC315-EGFP Shuttle Vector | GeneChem, China | N/A | Parent adenoviral shuttle vector used for reporter plasmid construction. |
| qPCR System | Applied Biosystems, USA | QuantStudio 5 | Real-time PCR system used for quantitative gene expression analysis. |
| Restriction Enzymes (BamHI and KpnI) | Abclonal, China | RK21101, RK21104 | Restriction enzymes used for shuttle-vector linearization. |
| Reverse Transcription Kit | TransGen Biotech, China | AT311 | Reverse-transcription kit used for cDNA synthesis before RT-qPCR. |
| RNA Lysis Reagent | Invitrogen, USA | 15596026 | Reagent used for total RNA extraction from cultured cells. |
| SB431542 | MedChemExpress, China | 301836-41-9 | TGF-β type I receptor inhibitor used for pharmacological inhibition experiments. |
| Sanger Sequencing Service/Reagents | Shanghai Boshang Biotechnology Co., Ltd., China | Custom Service | Sequencing service/reagents used for plasmid sequence verification. |
| Serological Pipettes | Corning, USA | 4488 | Sterile pipettes used for liquid handling during cell culture procedures. |
| T30 Thermal Cycler | LongGene Scientific Instruments, China | T30 | Thermal cycler used for reverse transcription and PCR amplification. |
| Trypsin-EDTA Solution | Gibco, USA | 25200-056 | Cell dissociation reagent used for routine cell passaging. |
| Viral Purification Kit | Takara Bio USA | 631533 | Kit used for recombinant adenovirus purification. |
| Water Bath | Shanghai Yiheng Scientific Instruments,China | HWS-12 | Temperature-controlled water bath used during adenoviral freeze–thaw cycles. |
References
- Frangogiannis NG. Cardiac fibrosis. Cardiovasc Res. 2021;117(6):1450–1488.
- Ghazal R, et al. Cardiac fibrosis in the multi-omics era: implications for heart failure. Circ Res. 2025;136(7):773–802.
- Kurose H. Cardiac fibrosis and fibroblasts. Cells. 2021;10(7):1716.
- Heidenreich PA, et al. 2022 AHA/ACC/HFSA guideline for the management of heart failure. J Am Coll Cardiol. 2022;79(17):e263–e421.
- Fang L, et al. A clinical perspective of anti-fibrotic therapies for cardiovascular disease. Front Pharmacol. 2017;8:186.
- Khalid A, et al. Breaking new ground in heart failure management: novel therapies and future frontiers. Front Cardiovasc Med. 2025;12:1643971.
- González A, et al. New targets to treat the structural remodeling of the myocardium. J Am Coll Cardiol. 2011;58(18):1833–1843.
- Tuleta I, et al. Fibroblast-specific TGF-β signaling mediates cardiac dysfunction, fibrosis, and hypertrophy in obese diabetic mice. Cardiovasc Res. 2024;120(16):2047–2063.
- Li C, et al. Mechanism of action of non-coding RNAs and traditional Chinese medicine in myocardial fibrosis: focus on the TGF-β/Smad signaling pathway. Front Pharmacol. 2023;14:1092148.
- Vistnes M. Hitting the target: challenges and opportunities for TGF-β inhibition for the treatment of cardiac fibrosis. Pharmaceuticals (Basel). 2024;17(3):267.
- Cardona-Timoner M, et al. Dressed in collagen: 2D and 3D cardiac fibrosis models. Int J Mol Sci. 2025;26(7):3038.
- Garvin AM, et al. Primary cardiac fibroblast cell culture: methodological considerations for physiologically relevant conditions. Am J Physiol Heart Circ Physiol. 2023;325(4):H869–H881.
- Zhang H, et al. Multiscale drug screening for cardiac fibrosis identifies MD2 as a therapeutic target. Cell. 2024;187(25):7143–7163.e22.
- Bollong MJ, et al. Small molecule-mediated inhibition of myofibroblast transdifferentiation for the treatment of fibrosis. Proc Natl Acad Sci U S A. 2017;114(18):4679–4684.
- Stepanenko AA, et al. Transient and stable vector transfection: pitfalls, off-target effects, artifacts. Mutat Res Rev Mutat Res. 2017;773:91–103.
- Tallquist MD. Cardiac fibroblast diversity. Annu Rev Physiol. 2020;82:63–78.
- Hofbauer P, et al. Modeling acute myocardial infarction and cardiac fibrosis using human induced pluripotent stem cell-derived multicellular heart organoids. Nat Commun. 2024;15:308.
- Li Q, et al. Human iPSC-based modeling of central nervous system disorders for drug discovery. Int J Mol Sci. 2021;22(3):1203.
- Icha J, et al. Phototoxicity in live fluorescence microscopy, and how to avoid it. Bioessays. 2017;39(8):1700003.
Access restricted. Please log in or start a trial to view this content.