This protocol describes the generation and validation of a stable STAT6 luciferase reporter assay in human airway epithelial cells. The method enables efficient screening of environmental toxicants and air pollution components that modulate STAT6 activity under controlled in vitro conditions.
Method Article
Establishment of a STAT6 Reporter Assay for Screening Environmental Toxicants Affecting Allergic Airway Inflammation
In This Article
Summary
Abstract
Air pollution–associated allergic airway inflammation is an increasing public health concern. Interleukin‑4 (IL‑4) and interleukin‑13 (IL‑13), which activate the Signal Transducer and Activator of Transcription 6 (STAT6) pathway, a central mediator of allergic airway inflammation, may modulate the respiratory toxicities of pollutants. The present study describes the generation and validation of a stable STAT6 luciferase reporter assay in human airway epithelial cells for evaluating environmental toxicants that modulate STAT6 signaling. Human bronchial epithelial 16HBE14o− cells were transduced with a STAT6-responsive luciferase reporter using a lentiviral vector, followed by optimization of puromycin selection and multiplicity of infection, and monoclonal isolation by limiting dilution. A stable clone with strong and reproducible induction across serial passages was selected. Reporter responsiveness was validated by IL-4/IL-13 stimulation, and STAT6 dependence was confirmed using selective STAT6, STAT5, and STAT3 inhibitors. Assay performance was quantified by Z′-factor analysis, which indicated reproducible signal separation. Furthermore, the assay was applied to individual air-pollution constituents, and benzo[b]fluoranthene and particulate matter significantly increased STAT6 reporter activity. This method provides a scalable approach for measuring STAT6 activity in airway epithelial cells and for prioritizing environmental toxicants that modulate allergic airway signaling.
Introduction
Air pollution represents one of the most pressing global public health challenges, with profound health effects and socioeconomic impacts. It is currently ranked as the second leading risk factor for mortality, accounting for 8.1 million deaths annually1,2,3. Among airborne pollutants, fine particulate matter with diameters of less than 2.5 micrometers (PM2.5) poses the greatest health risk due to its ability to penetrate deep into the respiratory tract4,5. Elevated PM2.5 exposure has been consistently linked to impaired lung function and increased rates of hospitalization for respiratory diseases6. The prevalence of allergic inflammatory diseases, including asthma, allergic rhinitis, and atopic dermatitis, has been increasing worldwide and is disproportionately elevated in the highly polluted megacities4.
Allergic airway diseases such as atopic asthma are primarily mediated by a type 2 inflammatory response characterized by elevated levels of the cytokines interleukin‑4 (IL‑4) and interleukin‑13 (IL‑13) and activation of the Signal Transducer and Activator of Transcription 6 (STAT6) signaling pathway7. In airway epithelial cells, IL-4- and IL-13-driven phosphorylation of STAT6 promotes mucus hypersecretion and epithelial barrier disruption, identifying STAT6 as a central mediator of allergic airway pathology and a relevant therapeutic target8,9. Experimental evidence from murine models indicates that exposure to PM2.5 and sulfur dioxide augments STAT6 signaling and exacerbates allergic airway inflammation10,11. However, whether individual air pollution constituents directly modulate STAT6 transcriptional activity in human airway epithelial cells has not been systematically evaluated.
Air pollution comprises a chemically complex mixture of constituents, including particulate matter, polycyclic aromatic hydrocarbons (PAHs), heavy metals, and inorganic salts, whose individual contributions to airway STAT6 activation remain poorly defined12,13. Current methodologies for measuring STAT6 activity in airway epithelial cells, such as endpoint phosphorylation assays or transient transfection-based reporter systems, are not amenable to large-scale chemical screening. A stable, cell-based STAT6 reporter platform in human airway epithelial cells would therefore provide a scalable tool to identify pollution-derived compounds that modulate allergic airway signaling. This protocol describes the development and validation of a stable STAT6 luciferase reporter assay in 16HBE14o− airway epithelial cells, enabling quantitative evaluation of STAT6 activation for systematic screening of environmental samples and individual chemical toxicants.
Protocol
Human-subject ethics approval is not applicable because this study used the established 16HBE14o− human bronchial epithelial cell line.
1. Generation of 16HBE14o− cells stably expressing a STAT6 activity reporter
NOTE: Figure 1 provides an overview of the workflow.
- Cell culture
NOTE: Perform all procedures using aseptic technique in a Class II biosafety cabinet. Confirm that the cells are free of mycoplasma contamination before use.- Maintain the 16HBE14o− cells in minimum essential medium supplemented with 10% fetal bovine serum and 1% penicillin–streptomycin. Incubate the cells at 37 °C in a humidified atmosphere containing 5% CO2, and replace the culture medium every other day.
- Allow the cells to reach approximately 80% confluence. Aspirate the culture medium and rinse the cell monolayer once with phosphate-buffered saline.
- Add sufficient phosphate-buffered saline to cover the cell monolayer and incubate the cells for 20 min at 37 °C. Aspirate the phosphate-buffered saline completely.
NOTE: Use the 20 min phosphate-buffered saline incubation to facilitate disruption of the tight intercellular junctions formed by this cell line. This duration represents an in-house optimized modification. - Add sufficient 0.25% trypsin–ethylenediaminetetraacetic acid solution to cover the cell monolayer. Incubate the cells for 10 min at 37 °C.
NOTE: Monitor cell detachment using an inverted light microscope. Gently tap the culture vessel when necessary to facilitate detachment. - Add approximately five volumes of complete culture medium relative to the volume of trypsin–ethylenediaminetetraacetic acid solution to terminate enzymatic activity. Pipette the suspension gently to obtain a single-cell suspension.
- Transfer the cell suspension to a 15 mL centrifuge tube. Centrifuge the suspension at 300 × g for 5 min at 25 °C.
- Aspirate the supernatant carefully and resuspend the cell pellet in fresh culture medium. Gently triturate the suspension and confirm the presence of a single-cell suspension under an inverted light microscope.
- Count the cells using a hemocytometer and adjust the cell concentration to the density required for the subsequent experiment. Use a routine split ratio of 1:8.
NOTE: Refer to Supplementary Table 1 and Supplementary Table 2 for the growth areas of the culture vessels and the corresponding volumes of phosphate-buffered saline and trypsin–ethylenediaminetetraacetic acid solution.
- Determination of puromycin-induced cytotoxicity
NOTE: Select the antibiotic according to the resistance gene encoded by the lentiviral construct.- Seed the 16HBE14o− cells at 2 × 10⁴ cells per well in a 96-well culture plate containing 100 µL of complete culture medium per well. Incubate the cells overnight.
- Replace the culture medium with fresh medium containing puromycin at final concentrations of 0.5, 1, 2, or 4 µg/mL. Prepare separate plates for the 24-, 48-, and 72-h time points.
- Add 5 µL of cell-counting reagent to each well. Incubate the plate for 1 h at 37 °C.
NOTE: Avoid introducing air bubbles into the wells, as they may interfere with absorbance measurements. - Measure the absorbance at 450 nm using 650 nm as the reference wavelength. Shake the plate for 15 s immediately before recording the absorbance in endpoint mode.
- Calculate cell viability14 using Equation 1.

where:



NOTE: Define the control as untreated cells and the blank as cell-free medium containing the assay reagent. Select the lowest puromycin concentration that completely eliminates the non-transduced cells within 48–72 h.
- Determination of the optimal multiplicity of infection
CAUTION: Handle lentiviral particles under Biosafety Level 2 conditions in a registered Biosafety Level 2 facility and in accordance with institutional biosafety regulations. Perform all virus manipulations in a Class II biosafety cabinet. Cover virus-contaminated consumables and spills with 10% bleach for at least 1 h before disposal as biohazardous waste.
NOTE: Optimize the multiplicity of infection because it directly affects transduction efficiency.- Calculate the required volume of lentiviral stock15 using Equation 2.

where:



NOTE: The functional titer of the STAT6 luciferase reporter lentiviral stock used in this protocol was 5 × 10⁷ transducing units/mL. For 2 × 10⁴ target cells, an MOI of 20 corresponds to 8 µL of lentiviral stock per well. The virus volume should be recalculated for virus preparations with different titers. - Seed the 16HBE14o− cells at 2 × 10⁴ cells per well in a 96-well white clear-bottom plate containing 100 µL of complete culture medium per well. Incubate the cells overnight until they reach approximately 80% confluence.
- Replace the culture medium with fresh medium containing 5 µg/mL polybrene and STAT6 luciferase reporter lentivirus at MOIs of 1, 5, 10, and 20. Include a non-transduced mock-control well containing no lentivirus.
NOTE: Calculate the lentiviral volume required for each MOI from the functional titer of the stock. - Incubate the cells with the lentiviral particles for 48 h. Replace the transduction medium with fresh culture medium and incubate the cells for an additional 24 h.
- Replace the culture medium with fresh medium containing interleukin-4 and interleukin-13 at 10 ng/mL each. Incubate the cells for 24 h.
- Add 25 µL of luciferase assay reagent to each well16. Protect the plate from light and incubate it for 20 min at room temperature.
- Shake the plate linearly for 20 s. Measure luminescence in endpoint mode using a full-plate read and a gain setting of 120.
CAUTION: Record luminescence within 1 h after adding the luciferase assay reagent to capture the maximal signal. Follow the reagent manufacturer’s safety and handling instructions.
NOTE: Use the same multimode microplate reader and acquisition settings for all absorbance and luminescence measurements.
- Calculate the required volume of lentiviral stock15 using Equation 2.
- Selection of transduced cells
- Seed the 16HBE14o− cells at 2 × 10⁵ cells/mL in a 24-well culture plate. Incubate the cells overnight.
- Replace the culture medium with fresh medium containing the STAT6 luciferase reporter lentivirus at an MOI of 20 and 5 µg/mL polybrene. Incubate the cells for 48 h.
- Replace the transduction medium with fresh culture medium. Incubate the cells for an additional 24 h.
- Aspirate the culture medium and add fresh medium containing 1 µg/mL puromycin. Incubate the cells for 5 days, replacing the selection medium every 2 days.
- Continue puromycin selection until all cells in the non-transduced mock-control well are eliminated.
NOTE: Allow at least 24 h after transduction before applying antibiotic selection to permit expression of the resistance gene.
- Isolation of single-cell clones by limiting dilution
- Detach and count the puromycin-selected STAT6 reporter cells. Prepare a single-cell suspension at 5 cells/mL by serial dilution.
NOTE: Prevent cell clumping during dilution. Pass the suspension through a cell strainer when necessary. - Dispense 200 µL of the cell suspension into each well of a 96-well culture plate to obtain an average density of approximately one cell per well.
- Examine each well using an inverted microscope within 24 h and identify wells containing a single cell. Exclude wells containing more than one cell or multiple spatially separated cell foci.
- Monitor the selected wells during the first week to confirm clonal growth. Replace the culture medium every 3 days.
- Expand each clone in the original 96-well plate for approximately 20 days or until the cells reach confluence. Transfer each clone sequentially to a 6-well plate and then to a T-25 culture flask.
NOTE: Culture the cells in the 6-well plate for approximately 6 days before transferring them to the T-25 flask, or transfer them when they reach the appropriate confluence.
PAUSE POINT: Continue expanding the clones or cryopreserve them at 1 × 10⁶ cells per vial in 1 mL of cryopreservation medium containing 90% fetal bovine serum and 10% dimethyl sulfoxide. - Seed each expanded clone at 2 × 10⁵ cells/mL in a 96-well white clear-bottom plate. Incubate the cells overnight.
- Replace the culture medium with fresh medium containing IL-4 and IL-13 at 10 ng/mL each. Incubate the cells for 24 h.
- Measure luciferase activity as described in steps 1.3.6–1.3.7. Compare the induced reporter activity among the individual clones.
- Repeat the luciferase assay over increasing cell-passage numbers. Select clones that maintain consistent cytokine-induced reporter activity across passages.
NOTE: Clone 3 was selected for its low basal luminescence and ability to maintain a consistent cytokine-induced activation signal across serial passages.
- Detach and count the puromycin-selected STAT6 reporter cells. Prepare a single-cell suspension at 5 cells/mL by serial dilution.
2. Establishment and validation of the STAT6 activity reporter assay
NOTE: Figure 2 provides an overview of the workflow.
- Validation of the STAT6 activity reporter assay
- Seed the STAT6 reporter cells at 2 × 10⁵ cells/mL into a 96-well white clear-bottom plate using 100 µL of complete culture medium per well. Incubate the cells overnight.
- Replace the culture medium with fresh medium containing IL-4 and IL-13 at final concentrations of 10 ng/mL each. Add the selective inhibitors simultaneously as follows: 100 nM AS1517499 (STAT6 inhibitor), 2.5 µM AC-4-130 (STAT5 inhibitor), or 2.5 µM Stattic (STAT3 inhibitor).
- Include a vehicle control containing 0.1% dimethyl sulfoxide (DMSO). Incubate the cells for 24 h.
- Determine cell viability using the cell-counting assay as described in steps 1.2.3–1.2.5.
- Measure luciferase activity as described in steps 1.3.6–1.3.7.
- Normalize the luminescence signal of each well to its corresponding cell viability. Express the normalized values relative to the cytokine-treated control group.
NOTE: Reduced cell viability may decrease the luciferase signal independently of STAT6 activity. Interpret reporter activity only after confirming acceptable cell viability.
- Evaluation of assay robustness
- Evaluate assay robustness by calculating the Z′-factor using 21 replicate wells for both the positive- and negative-control groups.
- Calculate the Z′-factor using Equation 3.
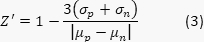
where:




NOTE: A Z′-factor between 0.5 and 1.0 indicates that the assay is suitable for high-throughput screening.
3. Application of the STAT6 reporter assay for screening environmental toxicants
CAUTION: Handle polycyclic aromatic hydrocarbons and heavy-metal salts as toxic and potentially carcinogenic materials. Use appropriate personal protective equipment, perform all manipulations in a certified chemical fume hood, and dispose of contaminated materials in accordance with institutional hazardous waste procedures.
- Environmental toxicant screening
- Seed the STAT6 reporter cells at 2 × 10⁵ cells/mL into a 96-well white clear-bottom plate using 100 µL of complete culture medium per well. Incubate the cells overnight.
- Replace the culture medium with fresh medium containing each test compound at the desired final concentration, which is 10 µM for this protocol, and treat the cells in the absence of IL-4 and IL-13.
- Include a negative-control group containing 0.1% dimethyl sulfoxide and a positive-control group containing IL-4 and IL-13 at 10 ng/mL each. Incubate the cells for 24 h.
- Determine cell viability using the cell-counting assay as described in steps 1.2.3–1.2.5.
- Measure luciferase activity as described in steps 1.3.6–1.3.7.
- Normalize the luminescence signal from each well to the corresponding cell-viability value. Express the normalized result relative to the negative-control group.
- Exclude compounds that reduce cell viability below 80% from the interpretation of STAT6 reporter activity.
NOTE: Treat reporter signals obtained under cytotoxic conditions as unreliable because reduced cell viability may alter luminescence independently of STAT6 pathway activity.
Results
To determine the optimal puromycin concentration for stable selection, parental 16HBE14o− cells were treated with increasing concentrations of puromycin (0.5–4 µg/mL), and cell viability was assessed after 24, 48, and 72 h using a cell viability assay. Puromycin reduced cell viability in a dose- and time-dependent manner, with all concentrations decreasing viability to below 20% after 48–72 h (Figure 3). A concentration of 1 µg/mL was the lowest concentration that completely eliminated non-transduced cells, reducing the residual viability signal to approximately 4.5% within 48 h (p < 0.0001). Increasing the puromycin concentration did not produce any additional reduction in cell viability. Therefore, 1 µg/mL puromycin was selected for the subsequent selection of transduced cells.
To optimize lentiviral transduction efficiency, 16HBE14o− cells were transduced with the STAT6 luciferase reporter lentivirus at multiplicities of infection (MOIs) of 1, 5, 10, and 20 for 48 h, followed by stimulation with IL-4 and IL-13 (10 ng/mL each) for 24 h to activate STAT6 signaling. As shown in Figure 4, relative luminescence units (RLUs) increased in an MOI-dependent manner. An MOI of 20 produced the greatest reporter induction, resulting in an approximately 50-fold increase in luminescence compared with the unstimulated control (p < 0.0001). Based on these results, an MOI of 20 was selected for subsequent experiments.
Following transduction and puromycin selection under the optimized conditions, non-transduced cells underwent extensive cell death, whereas transduced cells retained normal morphology and viability (Figure 5). The surviving cells were subsequently subjected to limiting dilution to establish monoclonal STAT6 reporter cell lines.
Three monoclonal reporter cell lines derived from individual cells were evaluated for STAT6 reporter activity. All clones exhibited low basal luminescence (<1,000 RLU). Stimulation with IL-4 and IL-13 induced robust reporter activity in clones 2 and 3, with luminescence exceeding 20,000 RLU and corresponding to greater than 20-fold induction (Figure 6A). Clone 3 exhibited the lowest basal luminescence and was therefore selected for further characterization. Reporter activity in clone 3 was evaluated across serial passages (P9–P21) to assess long-term stability. As shown in Figure 6B, STAT6-dependent reporter induction remained stable throughout the evaluated passage range. A clone was considered suitable for subsequent experiments when it exhibited a normal growth rate, basal luminescence below approximately 1,000 RLU, and greater than 20-fold induction following cytokine stimulation.
Because IL-4 and IL-13 can activate additional STAT family members, including STAT3 and STAT5, the specificity of the reporter assay was further evaluated17,18. STAT6 reporter cells were stimulated with IL-4 and IL-13 in the presence or absence of selective inhibitors targeting STAT6, STAT5, or STAT3 for 24 h19,20,21. Cell viability remained above 90% under all treatment conditions (STAT6 inhibitor AS1517499, 100 nM: 98.4%; STAT5 inhibitor AC-4-130, 2.5 µM: 97.4%; STAT3 inhibitor Stattic, 2.5 µM: 96.2%; Figure 7A). Inhibition of STAT6 markedly reduced luciferase activity (p < 0.0001), whereas inhibition of STAT5 or STAT3 produced no significant effect on reporter activity (p = 0.2593 and p = 0.8857, respectively; Figure 7B). These findings confirmed that reporter activation was predominantly STAT6 dependent.
The robustness of the assay was evaluated by calculating the Z′-factor using IL-4- and IL-13-stimulated cells as the high-signal control and STAT6 inhibitor-treated cells as the low-signal control. The assay yielded a Z′-factor of 0.703 ± 0.097, indicating excellent assay performance, a wide signal window, and suitability for high-throughput screening.
Finally, the STAT6 reporter assay was applied to screen selected environmental constituents of particulate matter for their ability to modulate STAT6 signaling. After 24 h of treatment, benzo[b]fluoranthene (10 µM) significantly increased STAT6 reporter activity by approximately 1.75-fold (p = 0.0006), whereas particulate matter (100 µg/mL) increased reporter activity by approximately 1.5-fold (p = 0.0398; Figure 8). In contrast, the remaining polycyclic aromatic hydrocarbons and heavy-metal compounds, including CdCl2, HgCl2, and NiSO4 (10 µM each), did not significantly alter reporter activity. Collectively, these results demonstrate that the STAT6 reporter assay is stable, specific, robust, and suitable for high-throughput screening of environmental compounds that modulate STAT6 signaling.
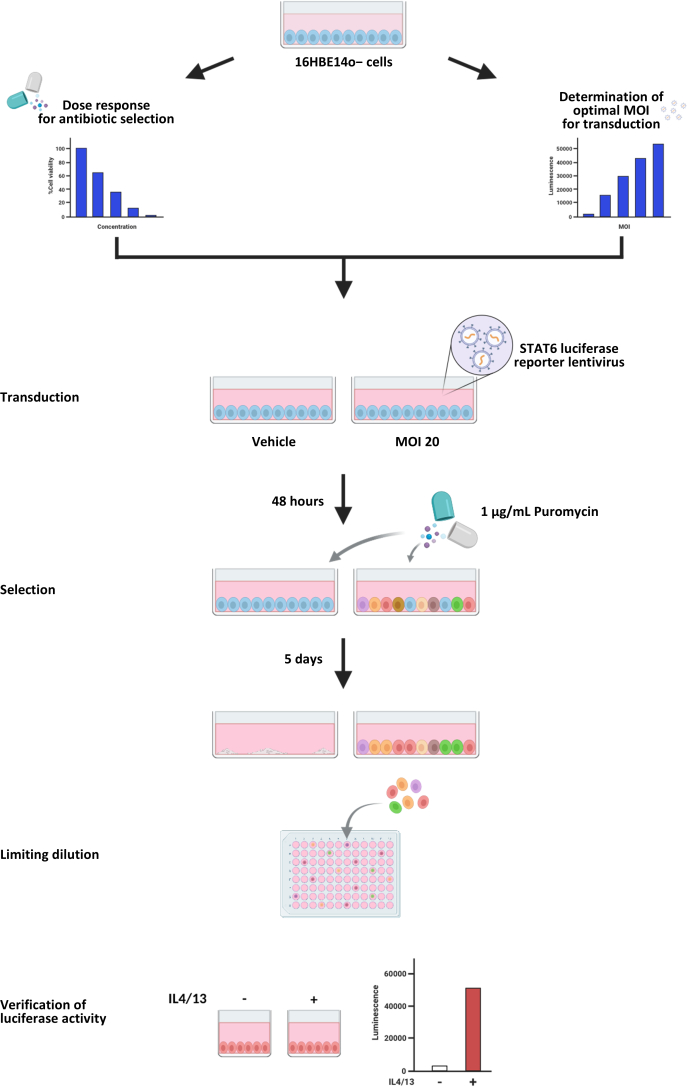
Figure 1: Workflow for the generation of 16HBE14o− STAT6 reporter cells. Schematic overview of the protocol for generating 16HBE14o− cells stably expressing a STAT6 luciferase reporter. Please click here to view a larger version of this figure.
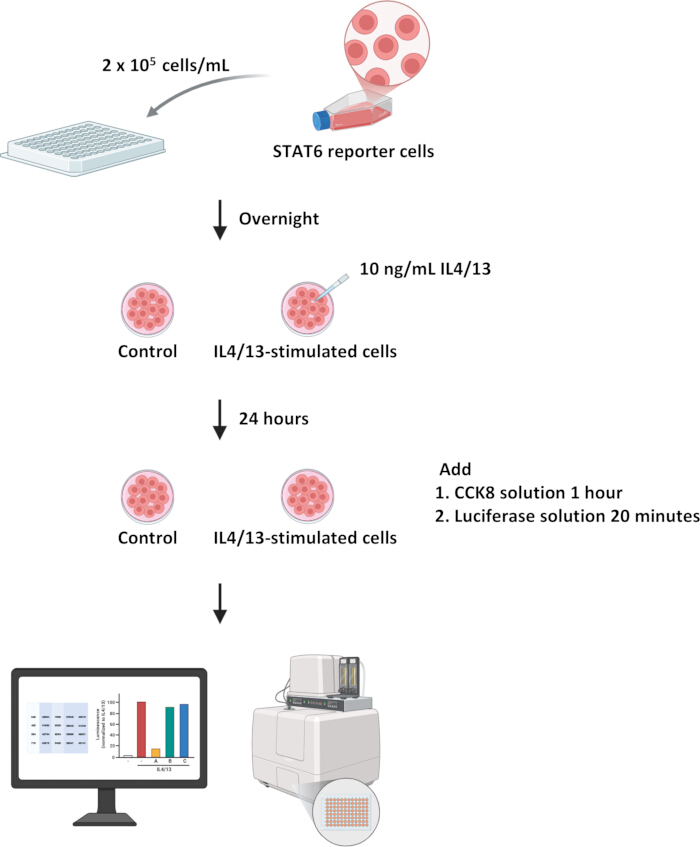
Figure 2: Workflow for establishment and application of the STAT6 reporter assay. Schematic overview of the STAT6 reporter assay for assay validation and screening of environmental toxicants. Please click here to view a larger version of this figure.
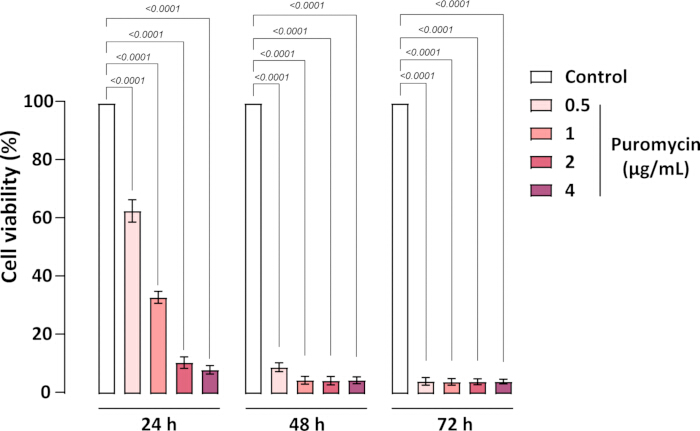
Figure 3: Determination of the optimal puromycin concentration for stable cell selection. Parental 16HBE14o− cells were treated with puromycin (0.5, 1, 2, or 4 µg/mL) for 24, 48, or 72 h. Vehicle-control cells received 0.1% dimethyl sulfoxide (DMSO). Cell viability was determined using a cell viability assay. Cell viability was calculated from the absorbance difference between 450 and 650 nm after blank subtraction and normalization to the vehicle control. Data are presented as the mean ± SD from three independent biological replicates with technical duplicates (n = 3). Statistical significance was determined using one-way ANOVA followed by Dunnett's multiple-comparisons test. p-values for comparisons with the vehicle control are indicated. Please click here to view a larger version of this figure.
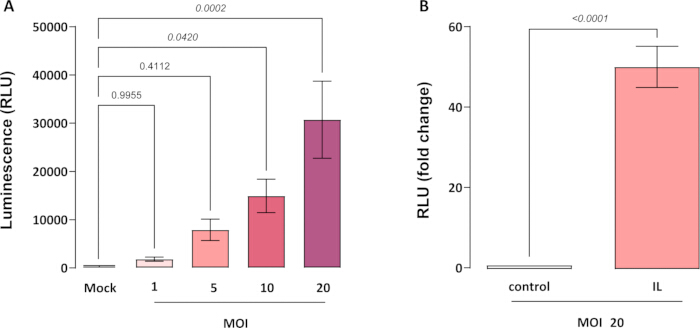
Figure 4: Optimization of lentiviral transduction efficiency. 16HBE14o− cells were transduced with a STAT6 luciferase reporter lentivirus at multiplicities of infection (MOIs) of 1, 5, 10, or 20 for 48 h. Following a 24 h recovery period, cells were stimulated with IL-4 and IL-13 (10 ng/mL each) for 24 h. (A) Relative luminescence units (RLUs) in mock-transduced cells and reporter-transduced cells at the indicated MOIs. Statistical analysis was performed using one-way ANOVA, followed by Dunnett's multiple comparisons test. (B) Fold induction following cytokine stimulation relative to the unstimulated MOI 20 control. Statistical analysis was performed using an unpaired Student's t-test. Data are presented as the mean ± SD from three independent biological replicates (n = 3). p-values are indicated. Please click here to view a larger version of this figure.
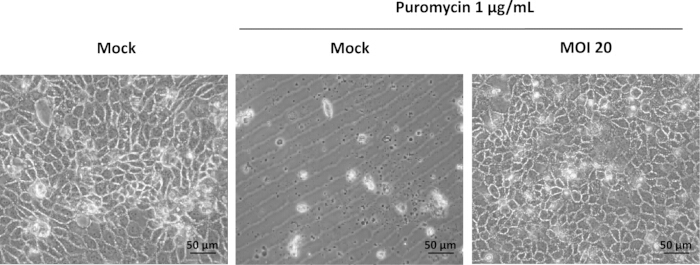
Figure 5: Representative images of cells following puromycin selection. 16HBE14o− cells were transduced with or without the STAT6 luciferase reporter lentivirus (MOI = 20) and subsequently treated with 1 µg/mL puromycin for 5 days. Images were acquired using a phase-contrast inverted microscope at 100× magnification under identical imaging conditions. Untreated parental cells formed a normal epithelial monolayer (left). Puromycin-treated non-transduced cells exhibited extensive cell death and detachment (middle), whereas puromycin-selected transduced cells remained viable and retained normal morphology (right). Scale bar = 50 µm. Please click here to view a larger version of this figure.
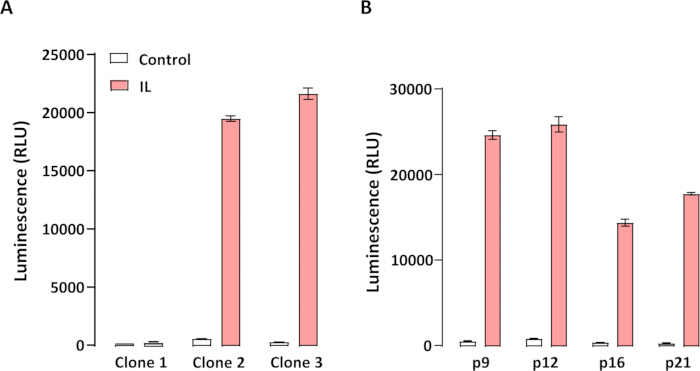
Figure 6: Identification of STAT6 reporter clones and evaluation of reporter stability. Following limiting dilution, three monoclonal STAT6 reporter cell lines were expanded and stimulated with IL-4 and IL-13 (10 ng/mL each) for 24 h. (A) Luciferase activity of individual reporter clones following cytokine stimulation compared with unstimulated controls. (B) Stability of STAT6 reporter activity in clone 3 across serial passages (P9–P21). Data are presented as the mean ± SD from technical duplicates. Please click here to view a larger version of this figure.
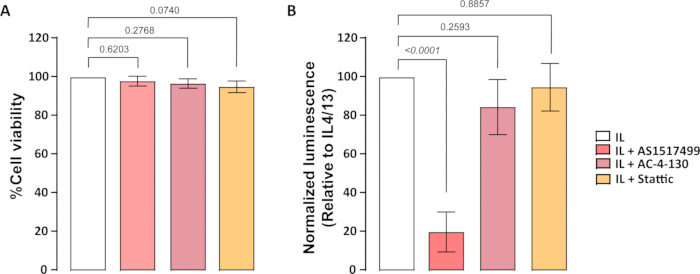
Figure 7: Selective inhibition of STAT6 reporter activity without affecting cell viability. STAT6 reporter cells were stimulated with IL-4 and IL-13 (10 ng/mL each) for 24 h in the presence of the STAT6 inhibitor AS1517499 (100 nM), the STAT5 inhibitor AC-4-130 (2.5 µM), or the STAT3 inhibitor Stattic (2.5 µM). The cytokine-stimulated vehicle-control group received 0.1% DMSO. (A) Cell viability was determined using a cell viability assay. (B) STAT6-dependent luciferase activity normalized to the cytokine-stimulated control. Data are presented as the mean ± SD from three independent biological replicates (n = 3). p-values are indicated. Please click here to view a larger version of this figure.
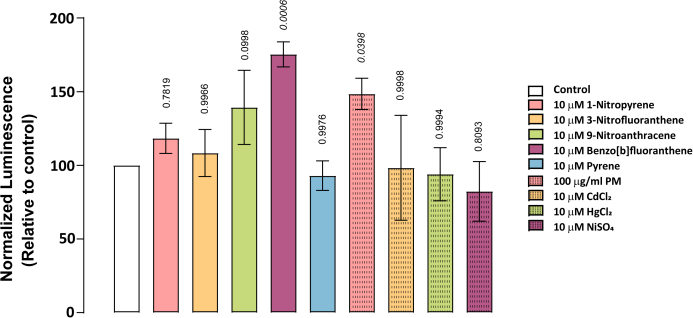
Figure 8: Evaluation of the STAT6-modulatory effects of environmental toxicants. STAT6 reporter cells were treated for 24 h with particulate matter (100 µg/mL) or the indicated environmental toxicants, including polycyclic aromatic hydrocarbons (PAHs) and heavy metals (10 µM each). STAT6-dependent luciferase activity was normalized to the vehicle control (0.1% DMSO). Data are presented as the mean ± SD from three independent biological replicates (n = 3). Statistical significance was determined by comparison with the vehicle control, and p-values are indicated. Please click here to view a larger version of this figure.
Supplementary Table 1: Culture-vessel specifications and passaging parameters for 16HBE14o− cell culture.Please click here to download this file.
Supplementary Table 2: Comparison of methods for measuring STAT6 activity.Please click here to download this file.
Discussion
IL-4/IL-13–JAK–STAT6 signaling is not only an important therapeutic target but also a key driver of the pathogenesis of allergic diseases, including asthma and allergic rhinitis22. This protocol describes a simple, stable cell line-based reporter assay for identifying modulators of STAT6 activity. The assay can be applied to evaluate the STAT6-modulatory effects of a broad range of environmental compounds and is readily adaptable to high-throughput screening, as demonstrated in the proof-of-concept screening study (Figure 8). By combining a luciferase reporter with a parallel cell viability assay, the method enables quantitative assessment of STAT6 pathway modulation while minimizing confounding effects arising from compound-induced cytotoxicity.
A distinguishing feature of this method is the use of stably transduced human bronchial epithelial 16HBE14o− cells, a physiologically relevant cell type in which pollutant-induced IL-4/IL-13 signaling contributes to allergic airway inflammation. Existing approaches for measuring STAT6 activity have important practical limitations. Detection of STAT6 phosphorylation or downstream target proteins by Western blotting or enzyme-linked immunosorbent assay (ELISA) is labor-intensive and relatively low-throughput. Transient-transfection luciferase reporter assays directly measure STAT6 transcriptional activity but are affected by variable transfection efficiency, batch-to-batch variability, and the need to repeat transfection for each experiment, thereby reducing reproducibility and throughput.
The stable reporter cell line described in the study overcomes many of these limitations. Because the reporter construct is genomically integrated and clonally selected, reporter expression remains uniform across the cell population and reproducible across passages, eliminating the variability associated with transient transfection. The luminescence signal is measured in living cells and can be normalized to a parallel cell viability measurement to exclude cytotoxic artifacts. In addition, the assay is readily compatible with a 96-well format for medium- to high-throughput applications. The assay yielded a Z′-factor of 0.703, indicating excellent separation between high- and low-signal controls and confirming its suitability for high-throughput screening. A comparison of commonly used approaches for measuring STAT6 activity is provided in Supplementary Table 2. Nevertheless, because the assay reports activation of a STAT6-responsive promoter rather than endogenous target gene expression, orthogonal validation using downstream STAT6 targets, such as MUC5AC and CCL26, remains important.
Several steps are critical for the successful establishment and application of the STAT6 reporter assay. Optimization of the lentiviral multiplicity of infection (MOI) is essential because insufficient viral input reduces transduction efficiency, whereas excessive viral exposure may induce cellular stress and compromise cell viability. Likewise, optimization of the puromycin selection concentration is required to eliminate non-transduced cells while preserving the viability of resistant reporter cells. Because susceptibility to lentiviral transduction and antibiotic selection vary among cell types, both parameters should be empirically optimized before establishing stable reporter cell lines. The 16HBE14o− cell line is an immortalized human bronchial epithelial cell line widely used to investigate airway inflammation because it forms functional tight junctions and produces mucus8,23. Cells selected for reporter generation should express functional IL-4 and IL-13 receptors and retain intact downstream JAK–STAT signaling24. Before establishing stable reporter lines, the reporter construct should be validated by confirming responsiveness to cytokine stimulation, suppression by pathway-specific inhibitors, and the absence of cytotoxic effects under the selected assay conditions. These validation steps help ensure that changes in reporter activity accurately reflect STAT6-dependent signaling rather than nonspecific cellular stress.
Several limitations of this method should also be considered. Lentiviral vectors integrate randomly into the host genome, which may result in clone-to-clone variation in basal reporter activity, inducibility, and long-term expression stability. In addition, because the assay measures activation of a STAT6-responsive promoter, it does not directly assess upstream receptor activation or downstream endogenous signaling events. Prolonged culture of stable reporter cells may also lead to epigenetic silencing or reduced transgene expression. To minimize these effects, early-passage master cell banks should be established, and reporter responsiveness should be periodically verified within a defined passage range. Furthermore, the assay has not yet been validated in primary human airway epithelial cells or in a fully automated high-throughput screening platform. Finally, the environmental toxicants evaluated in this study represent a proof-of-concept panel rather than a comprehensive chemical library.
Air pollution, particularly fine particulate matter (PM2.5), comprises a complex mixture of chemically and physically diverse constituents, including black carbon, inorganic salts, polycyclic aromatic hydrocarbons, and heavy metals12,13. Variations in emission sources and atmospheric processing produce substantial differences in particulate composition, which may contribute to distinct adverse health outcomes. Consequently, identifying the specific components responsible for allergic responses remains challenging in epidemiological and in vivo studies. The STAT6 reporter assay described in the study provides a practical in vitro platform for screening the STAT6-modulatory activity of individual airborne toxicants, source-resolved particulate matter extracts, or chemically defined particulate fractions. This protocol may facilitate the prioritization of candidate toxicants for mechanistic studies and support risk-oriented evaluation of complex air pollution mixtures.
Disclosures
The authors declare no conflicts of interest.
Acknowledgements
This work was supported by the National Research Council of Thailand (NRCT) (Grant No. N42A680388), and this research project is supported by the Mahidol University (Strategic Research Fund: 2025) (Grant No. 35). Figures 1 and 2 were created using BioRender.com (Pothipan, P. (2026). https://BioRender.com/h44gy3h).
Materials
| Name | Company | Catalog Number | Comments |
|---|---|---|---|
| 0.25% Trypsin-EDTA | Gibco | 25200072 | Cell dissociation reagent |
| 15 mL conical centrifuge tube | Corning | CLS430791 | Sterile polypropylene centrifuge tube |
| 16HBE14o- human bronchial epithelial cell line | Gift from Dr. Nawiya Huipao (Prince of Songkla University, Thailand) and Prof. Dr. Dieter C. Gruenert (University of California San Francisco, USA) | RRID:CVCL_0112 | Human bronchial epithelial cell line (passages 35–40); confirmed mycoplasma-free and retains differentiated airway epithelial morphology and barrier properties. Reference: Cozens AL, et al. Am J Respir Cell Mol Biol. 1994;10(1):38–47. |
| 24-well clear flat-bottom tissue culture-treated plate | Corning | 3527 | Cell culture plate |
| 6-well clear flat-bottom tissue culture-treated plate | Corning | 3516 | Cell culture plate |
| 96-well clear flat-bottom polystyrene tissue culture-treated microplate | Corning | 3599 | Cell viability assay plate |
| 96-well white clear-bottom polystyrene tissue culture-treated microplate | Corning | 3610 | Luminescence assay plate |
| AC-4-130 (STAT5 inhibitor) | MedChemExpress | HY-124500 | Selective STAT5 inhibitor |
| AS1517499 (STAT6 inhibitor) | MedChemExpress | HY-100614 | Selective STAT6 inhibitor |
| Benzo[b]fluoranthene | AccuStandard | H-128N | Polycyclic aromatic hydrocarbon |
| Biological safety cabinet, Class II | Nuaire | NU-543-400E | For aseptic cell culture procedures |
| Cadmium chloride (CdCl2) | Sigma | 202908 | Heavy metal compound |
| Cell counting kit-8 (CCK-8) | MedChemExpress | HY-K0301 | Cell viability assay |
| Cell culture flask, 25 cm² (T-25) | Corning | 430639 | Tissue culture flask |
| CO2 incubator | Nuaire | NU-5710E | Maintained at 37 °C, 5% CO2, humidified atmosphere |
| Dimethyl sulfoxide (DMSO) | Sigma | D2650 | Solvent (0.1% final concentration) and cryoprotectant (10%) |
| Fetal bovine serum (FBS) | Sigma | F7524 | Medium supplement (10%) and cryopreservation medium (10%) |
| Hemocytometer | BOECO | BOE14 | Manual cell counting |
| Inverted phase-contrast light microscope | ZEISS | Primovert | Cell morphology observation |
| Luciferase assay system (ONE-Step) | BPS Bioscience | 60690 | Luciferase reporter assay |
| Mercury chloride (HgCl2) | Sigma | 215465 | Heavy metal compound |
| Microplate reader | BioTek | Synergy Neo2 | Multimode microplate reader/luminometer controlled by Gen5 software (v3.08.01). Absorbance measured at 450 nm with 650 nm reference after 15–20 s linear shaking. Luminescence measured in endpoint mode using detector gain of 120 following 20 s linear shaking. |
| Minimum Essential Medium Eagle (MEM) | Gibco | 11095-080 | Basal culture medium |
| Nickel sulfate (NiSO4) | Tokyo Chemical Industry | N1203 | Heavy metal compound |
| Particulate matter (PM) | National Institute of Standards and Technology | SRM 2975 | Standard reference material for particulate matter |
| Penicillin-streptomycin (100×) | Gibco | 15140122 | Antibiotic supplement (1% final concentration) |
| Phosphate-buffered saline (PBS) | Gibco | 18912014 | Washing buffer |
| Polybrene | Sigma | TR-1003-G | Lentiviral transduction enhancer |
| Puromycin | MedChemExpress | HY-B1743A | Antibiotic for stable cell selection |
| Recombinant human IL-13 | Thermo Fisher Scientific | A42526 | Cytokine for stimulation |
| Recombinant human IL-4 | Thermo Fisher Scientific | A42602 | Cytokine for stimulation |
| STAT6 luciferase reporter lentivirus | BPS Bioscience | 78799 | Lentiviral reporter construct; stock titer 5 × 10⁷ TU/mL |
| Stattic (STAT3 inhibitor) | MedChemExpress | HY-13818 | Selective STAT3 inhibitor |
References
- Organisation for Economic Co-operation and Development. The Economic Consequences of Outdoor Air Pollution. OECD Publishing; Paris; 2016.
- Thailand Pollution Control Department. Air Quality Assessments for Health and Environment Policies in Thailand. Thailand Pollution Control Department; Bangkok; 2018.
- Health Effects Institute. State of Global Air Report 2024. Available at: https://www.stateofglobalair.org/resources/report/state-global-air-report-2024
- State of Global Air. Trends in Air Quality and Health Impacts: Insights from Central, South, and Southeast Asia. 2025. Available at: https://www.stateofglobalair.org/
- Shi X. Acute effects of air pollution on human health in China: Evidence and prospects. China CDC Wkly. 2021;3(45):941-942.
- Tsai YG, et al. Long-term PM2.5 exposure impairs lung growth and increases airway inflammation in Taiwanese school children. ERJ Open Res. 2025;11(4).
- Walford HH, Doherty TA. STAT6 and lung inflammation. JAKSTAT. 2013;2(4):e25301.
- Moonwiriyakit A, et al. GPR120/FFAR4 stimulation attenuates airway remodeling and suppresses IL-4- and IL-13-induced airway epithelial injury via inhibition of STAT6 and Akt. Biomed Pharmacother. 2023;168:115774.
- Pelaia C, et al. Biological therapy of severe asthma with dupilumab, a dual receptor antagonist of interleukins 4 and 13. Vaccines (Basel). 2022;10(6).
- Yang Y, et al. Continuous exposure to PM2.5 exacerbates ovalbumin-induced asthma in mouse lung via the JAK-STAT6 signaling pathway. Adv Clin Exp Med. 2020;29(7):825-832.
- Li X, Huang L, Wang N, Yi H, Wang H. Sulfur dioxide exposure enhances Th2 inflammatory responses via activation of the STAT6 pathway in asthmatic mice. Toxicol Lett. 2018;285:43-50.
- Reiss R, et al. Evidence of health impacts of sulfate- and nitrate-containing particles in ambient air. Inhal Toxicol. 2007;19(5):419-449.
- Li R, et al. Key toxic components and sources affecting oxidative potential of atmospheric particulate matter using interpretable machine learning: Insights from fog episodes. J Hazard Mater. 2024;465:133175.
- Posimo JM, et al. Viability assays for cells in culture. J Vis Exp. 2014;(83):e50645.
- Baumlin-Schmid N, Salathe M, Fregien NL. Optimal lentivirus production and cell culture conditions necessary to successfully transduce primary human bronchial epithelial cells. J Vis Exp. 2016;(113).
- Nozeret K, Pernin A, Buddelmeijer N. Click-chemistry based fluorometric assay for apolipoprotein N-acyltransferase from enzyme characterization to high-throughput screening. J Vis Exp. 2020;(159).
- Rolling C, Treton D, Pellegrini S, Galanaud P, Richard Y. IL-4 and IL-13 receptors share the γc chain and activate STAT6, STAT3, and STAT5 proteins in normal human B cells. FEBS Lett. 1996;393(1):53-56.
- Deimel LP, Li Z, Roy S, Ranasinghe C. STAT3 determines IL-4 signalling outcomes in naïve T cells. Sci Rep. 2021;11(1):10495.
- Wingelhofer B, et al. Pharmacologic inhibition of STAT5 in acute myeloid leukemia. Leukemia. 2018;32(5):1135-1146.
- McMurray JS. A new small-molecule STAT3 inhibitor. Chem Biol. 2006;13(11):1123-1124.
- Chiba Y, Todoroki M, Nishida Y, Tanabe M, Misawa M. A novel STAT6 inhibitor, AS1517499, ameliorates antigen-induced bronchial hypercontractility in mice. Am J Respir Cell Mol Biol. 2009;41(5):516-524.
- Zhang X, et al. The immunogenetic landscape of allergic rhinitis: From cellular effectors to gene regulation and targeted therapies. Int J Biol Sci. 2026;22(3):1322-1345.
- Yu H, Li Q, Kolosov VP, Perelman JM, Zhou X. Interleukin-13 induces mucin 5AC production involving STAT6/SPDEF in human airway epithelial cells. Cell Commun Adhes. 2010;17(4-6):83-92.
- White SR, Martin LD, Stern R, Laxman B, Marroquin BA. Expression of IL-4/IL-13 receptors in differentiating human airway epithelial cells. Am J Physiol Lung Cell Mol Physiol. 2010;299(5):L681-L693.
Reprints and Permissions
This article has been published
Video Coming Soon