Two contactless co-culture approaches are described for qualitative and quantitative assessment of fungal morphological responses during inter-species interactions. The protocol demonstrates how intrinsic factors influence hyphal growth, using a Candida inter-species assay as an example. These methods can be easily adapted to investigate microbial inter-species communication across diverse organisms.
Method Article
Contactless Co-Culture Assays for Morphometric Studies During Inter-Species Interactions in Fungi
In This Article
Summary
Abstract
Cellular behaviour and morphology are usually influenced by various intra- and extracellular factors in a microbial community. Different approaches available to study microbial communication could be tedious and/or require specialised facilities and expertise. Here, two complementary contactless co-culture approaches are described, the membrane insert well plate co-culture assay and the Cell-Free Supernatant (CFS)-based assay, which are based on morphological transition as a measurable response to investigate the role of various factors in a given inter-species interaction. The membrane insert well plate system, while permitting diffusion of extracellular molecules, allows real-time interaction between physically separated species. In comparison, the CFS-based assay provides a simplified, scalable approach for evaluating responses to conditioned media. The protocol presented here includes standardized procedures for culture preparation, generation of conditioned supernatants, assay setup, microscopy, image acquisition, quantitative morphometric analysis using Fiji, and statistical evaluation. This has been demonstrated with an example of fungal morphological response to intrinsic and extrinsic factors. The methods presented here offer accessible and adaptable alternative tools for studying novel microbial interactions in a community, and could be readily extendable to investigate mechanisms underlying multi-species co-existence in a community.
Introduction
In natural and clinical ecosystems, microorganisms typically reside within structured polymicrobial communities, governed by intricate networks of intra- and inter-species communication1. These consortia utilize diverse chemical signals, including quorum-sensing molecules, volatile organics, and secretory peptides and proteins, to coordinate population-level behaviours2. Mapping these communication dynamics is critical, as cooperative, competitive, or predatory niche interactions significantly alter microbial metabolism, spatial architecture, and stress adaptation3. Clinically, these polymicrobial networks (such as dual-species bacterial-fungal or inter-species fungal-fungal consortia) frequently display synergistic virulence, accelerated tissue colonization, and elevated antimicrobial resistance, compared to monocultures4,5. Deciphering the molecular determinants of microbial communications is therefore vital to transcend traditional models and develop innovative anti-infective strategies to disrupt community stability6.
To dissect distinct modes of microbial crosstalk, researchers utilize diverse experimental configurations, primarily used in mammalian cell biology, immunology, and oncology7,8,9. For example, direct-contact co-culture models serve as the standard for investigating juxtacrine signalling and physical cell-to-cell engagements10. Similar setups with modifications are also used to study physical interactions between microbes, understanding cross-microbial inhibition or drug response9,11,12. However, it is difficult to distinguish the underlying mechanisms, because both contact-dependent and diffusible signals contribute to the observed response. While traditional contact-based assays can provide spatial insights, they are laborious and/or require distinct strain labelling, which can be tedious for non-model organisms. Conversely, Transwell (membrane insert well plate) assays are used, mostly in mammalian studies, to distinguish the contributions of contact-dependent and diffusible signals13,14,15,16. This method is particularly useful when cellular communication is mediated by secreted molecules, allowing real-time analysis of signalling dynamics between cell populations17. Further, contact-free assays offer the advantage of membrane separation that can also integrate experiments with computational models to dynamically track microbes that traditional methods miss18. This approach is occasionally used to simultaneously study the developmental kinetics of different bacterial species19.
A cheaper high-throughput alternative to the membrane insert well plate assay is the Cell-Free Supernatant (CFS)-based or conditioned medium-based assay. This is known to be used in regenerative medicine and vascular biology to isolate secretomes required for understanding stem cell-mediated tissue repair and/or tumour-induced angiogenesis20. Similarly, in microbial studies, CFS frameworks have been useful in deciphering polymicrobial competition. For example, bacterial filtrates (such as Pseudomonas aeruginosa acyl-homoserine lactones or Lactobacillus metabolites) have been used to modulate fungal biofilm maturation21,22. More recently, microfluidic platforms have enabled high-fidelity physiological biomimicry through organ-on-a-chip technologies23,24. While microfluidic systems have been implemented for the simultaneous detection of the microbial community’s response towards their secretomes, they require specialised instrumentation and expertise and may not be readily implemented in all settings25,26,27. Thus, membrane insert well plate and CFS-based assays promise to be the methods of choice in most cases. The choice between these two assays would depend on the nature of the secretory molecule. If the secretory molecule is unstable, i.e., short half-life, and requires measuring real-time activity, the membrane insert well plate assay is more suitable. On the other hand, if the secretory molecule is stable and the experiment is on a large scale, a CFS-based assay would be more economical.
The primary objective of this protocol is to present a step-by-step qualitative and quantitative tracking methodology for evaluating morphological characteristics, using the membrane insert well plate and CFS platforms (Figure 1). Here, it has been demonstrated with secreted-factor-driven communication between Candida albicans and Candida glabrata as an example. In addition, these tools can also quantify the effects of intrinsic genetic variables (ploidy and mating locus status) in altering the absolute geometric development (length, volume, and diameter) of C. albicans filaments, when exposed to secretory signaling molecules. This established protocol provides a simple and affordable non-contact platform, suitable for studying inter-species signalling dynamics.
Protocol
Both C. albicans and C. glabrata are classified as Biosafety Level 2 (BSL-2) human opportunistic pathogens. All experimental steps must be conducted inside certified Biosafety Cabinets under strict adherence to Good Microbiological Practices (GMP) and institutional containment procedures. Personal protective equipment (PPE), including laboratory coats, double gloves, and protective eyewear, must be worn throughout. All contaminated consumables, plasticware, and liquid cultures must undergo validation autoclaving (121 °C, 15 psi, for 20 min) or chemical disinfection using a freshly prepared 10% sodium hypochlorite solution before final disposal (Recommended: National Institutes of Health (NIH) Waste Disposal Guide 2022). All standard reagents, analytical-grade chemicals, and equipment used throughout this methodology are described in the Table of Materials. Fungal strain properties and background genotypes are detailed in Table 1. The list of media used in this study, with their compositions, is provided in Supplementary File 1.
1. Preparation of Cell-Free Supernatant (CFS)
- Culture initiation and incubation
- Using a sterile plastic loop, pick a single isolated colony of C. glabrata CBS138 grown freshly on a Glucose Minimal Medium (GMM) agar plate28. Inoculate the colony into a sterile glass tube containing 10 mL of standard Yeast Peptone Dextrose (YPD) broth (1% w/v yeast extract, 2% w/v peptone, 2% w/v D-glucose)29.
- Secure the tube inside an orbital shaking incubator. Incubate the culture at a fixed temperature of 37 °C with continuous agitation at 200 rpm for 18 h.
- Verify that the culture has uniformly entered the late stationary growth phase by checking that the optical density (OD600) falls within a stable range of 12.0 to 14.0. Check the cells by observing under a microscope to ensure that the cells are in yeast form and free from contamination. This developmental window is required to ensure optimal accumulation of stable extracellular secretome components.
- Cell separation and filtration
- Aseptically transfer the 18-h C. glabrata liquid culture into a sterile 15 mL conical polypropylene centrifuge tube.
- Balance the tubes and centrifuge the culture at 5,000 x g for exactly 5 min at a controlled room temperature of 25 °C to compress the biomass into a tight pellet.
- Decant the raw liquid supernatant into a clean, sterile 20 mL plastic syringe. Carefully attach the syringe to a sterile 0.22 µm Polyethersulfone (PES) low-protein-binding membrane filter.
- Apply steady mechanical pressure to pass the liquid through the PES filter into a sterile 15 mL collection tube, generating the working Cell-Free Supernatant (CFS). If resistance is felt during filtration, do not apply excess pressure, as it could result in the rupture of the membrane. In such cases, use a fresh membrane filter.
NOTE: Do not subject the freshly harvested CFS to rapid freeze-thaw cycles or storage temperatures below 4 °C prior to setting up the assay, as cold precipitation can destabilize low-abundance protein factors. - Retain the target compressed cell pellet within the initial collection tube if proceeding directly to the companion membrane insert well plate co-culture experiment (Step 4).
2. Preparation of Candida albicans inoculum for hyphal induction assays
- Inoculum preparation and maintenance
- Retrieve target C. albicans strains (refer to Table 1 for genotypes) directly from long-term master glycerol stocks stored at -80 °C. Streak the cells onto solid GMM plates (0.67% w/v yeast nitrogen base without amino acids, 2% w/v D-glucose, 2% w/v agar) to establish working colonies.
- For Diploid strains (SC5314, RBY1132, RBY1133): Inoculate a single colony into 5 mL of liquid GMM. Incubate the tube for 12 h at 37 °C under constant agitation at 200 rpm.
NOTE: Utilizing minimal medium (GMM) for overnight preparation of diploid cells is crucial to suppressing spontaneous auto-filamentation that often occurs in nutrient-rich media. - For Haploid strains (GZY896, GZY803): Inoculate an isolated colony into 5 mL of liquid YPD broth supplemented with 0.1 mg/mL uridine (YPDU). Incubate the tube for 12 h at 37 °C with continuous agitation at 200 rpm.
- To preserve morphological stability and ensure consistency, limit consecutive liquid subcultures to a maximum of three passages. If auto-filamentation or pseudohyphal clustering exceeds 2% in the starting control pool, discard the strain and revive fresh cells from the master freeze stocks.
- Normalization
- Aliquot 1 mL from the overnight liquid cultures into sterile cuvettes. Measure the precise absorbance at 600 nm (OD600) using a calibrated UV-Visible spectrophotometer, using fresh GMM or YPDU broth as the blanking control.
NOTE: The OD600 (cell density) of the overnight liquid cultures, especially those grown in YPDU, would exceed the sensitivity range of the spectrophotometer. In such scenarios, dilute the cultures appropriately (10–20-fold) prior to taking the measurements. - Calculate the volume of dense culture needed to generate a standardized target suspension. Dilute the cells with pre-warmed (37 °C) liquid GMM in a sterile tube to establish a 1 mL working inoculum adjusted to an absolute final OD600 = 0.1.
- Aliquot 1 mL from the overnight liquid cultures into sterile cuvettes. Measure the precise absorbance at 600 nm (OD600) using a calibrated UV-Visible spectrophotometer, using fresh GMM or YPDU broth as the blanking control.
3. CFS-based hyphal induction assay (96-well plate format)
- Assay setup
- Take a sterile, optically clear, flat-bottom 96-well polystyrene microtiter plate.
- Test well configuration: Dispense 45 µL of the freshly filtered C. glabrata CFS (from Step 1.2.4) directly into designated test wells. Add 45 µL of sterile GMM broth (or YPDU broth if evaluating haploid target strains).
- Negative media controls: Add 90 µL of GMM broth into control wells. Additionally, in a separate well, mix 45 µL of sterile GMM broth with 45 µL of blank uninoculated YPD broth to monitor baseline background medium components.
- Positive induction controls: Add 80 µL of GMM broth combined with 10 µL of Fetal Bovine Serum (FBS; final concentration of 10% v/v).
- Inoculation: Dispense exactly 10 µL of the normalized OD600 = 0.1 of C. albicans working inoculum (from Step 2.2.2) into 90 µL of appropriate medium in all experimental and control wells.
- Incubation and data collection
- Cover the 96-well plate with its fitted plastic lid to minimize evaporation. Place the plate in a static incubator maintained at 37 °C for exactly 3 h. Avoid shifting or agitating the plate during this window to allow stable filamentation.
- Following incubation, place the multi-well plate upright onto the stage of an inverted light microscope equipped with bright-field optics and an integrated digital CCD camera module.
- Systematically capture automated or manual images across at least five distinct fields of view per well.
- Execute this assay configuration with clear technical duplicates per condition, across at least three fully independent biological replicates prepared on separate days.
4. Membrane insert well plate co-culture assay
- Abluminal (lower) compartment setup
- Take a sterile 24-well tissue culture carrier plate.
- Dispense exactly 1.0 mL of the normalized OD600 = 0.1 C. albicans cell suspension (from Step 2.2.2) into the lower abluminal chambers.
- Luminal (upper) compartment setup
- Retrieve the C. glabrata cell pellet set aside during Step 1.2.5. Resuspend the pellet in 1 mL of sterile GMM broth, centrifuge at 5000 x g for 3 min, and decant the liquid. Repeat this washing step twice to remove residual nutrient components or old media elements.
- Resuspend the final washed pellet in fresh GMM broth and adjust the final optical density to a highly concentrated value of OD600 = 5.0.
- Using sterile forceps, pick up a sterile membrane well insert featuring a track-etched 0.4 µm pore-size polycarbonate membrane. Lower the insert body smoothly into the occupied 24-well plate chamber, securing its upper flanges onto the middle notch positions.
- Dispense exactly 750 µL of the concentrated C. glabrata culture with OD600 = 5.0 into the upper luminal insert chamber.
NOTE: Maintaining an initial cell ratio of roughly 1:50 (C. albicans to C. glabrata) across the membrane barrier provides sufficient accumulation of signalling ligands while preventing localized feedback artifacts.
- Incubation and Imaging
- Cover the compiled membrane insert well plate assembly and incubate statically or with a gentle orbital shaking (30 rpm) at 37 °C for exactly 3 h.
- Following incubation, use sterile forceps to carefully lift and extract the upper luminal insert from each well. Discard the inserts into biohazard waste.
NOTE: Complete removal of the upper insert membrane before imaging is required to eliminate refractive shadows, light-scattering patterns, and background grid artifacts during high-resolution microscopic screening. - Position the 24-well plate on the inverted microscope stage for morphological evaluation. In this study, an inverted microscope with a 10x/0.30NA, a 20x/0.50NA, or an extra-long working distance 40x/0.60NA objective, with a DIC filter set, has been used.
5. High-resolution microscopy and digital image analysis
- Digital image acquisition
- Scan the well floors using a low-power 10x objective lens to verify uniform cell distribution and flag any localized tracking errors or anomalous cell clustering.
- Capture a minimum of 10 separate fields of view using a calibrated 20x objective lens. This imagery forms the core dataset for tracking standard filament counts and population distributions.
- For fine phenotypic analysis and detailed measurements of cell boundaries, capture micrographs under a 40x extra-long-working-distance objective lens configuration. Save all raw image files.
- Quantitative phenotyping pipeline (Fiji)
- Launch the Fiji (version 1.54p or higher) processing software. Open the target micrograph by navigating to File > Open or dragging the file directly into the Fiji control panel.
- Hyphal Length Tracking (L): Right-click the line selection icon on the main Fiji toolbar and select the Segmented Line Tool from the dropdown menu. Position the cursor at the precise junction point where the moving filament emerges from the mother yeast cell wall boundary.
- Left-click continuously to trace along the central longitudinal axis of the hypha, placing anchor points to adjust for any curves or bends, and terminate the line at its absolute apical tip. Click on Measure to log the length in micrometres (µm). Press Ctrl+M (Windows) or Cmd+M (Mac OS) to log the total length (L) in micrometres (µm) within the Results window.
- To prevent duplicate measurements of the same filament, use the built-in ‘Brush Tool’ to highlight each completed cell.
- Mother yeast cell profiling: Locate the attached mother yeast cell body corresponding to the previously tracked hyphal filament. Use the Segmented Line Tool to draw a straight line across the maximum long axis of the cell body to measure its maximum long axis (major axis, defined as variable ‘a’) and execute the Measure command.
- Draw a secondary line strictly perpendicular to the major axis across the widest transverse span of the cell body to measure its corresponding perpendicular cross axis (minor axis, defined as variable ‘b’) and execute the Measure command.
- Compute the total volume of the mother yeast cell (CV, expressed in cubic micrometres, µm3) by applying the standard geometric model for a prolate spheroid using the logged variables for ‘a’ and ‘b’: CV = 4/3 π ab2.
- Hyphal Structural Thickness (d): Select the Segmented Line Tool. Measure the outer wall-to-wall distance i.e., line drawn perpendicular to the length axis. Take these measurements at three separate equidistant points along the length of the filament to account for natural structural variations, logging each measurement via the Measure command.
- Calculate the arithmetic mean of these three distinct data points to determine an accurate average thickness value (d). Divide this calculated mean diameter value by two to determine the structural variable radius (r = d/2).
- Compute the total volume of the hyphal filament (HV, expressed in µm3) by treating the filament as an unbranched, regular geometric cylinder. Apply the tracked filament length (L) and derived structural radius (r) to the following calculation model: HV = π r2 L.
6. Statistical design
- Biological replicates
- Perform all individual test layouts across at least three independent biological runs using fresh, separately prepared startup cultures.
- Within each biological run, assign a minimum of two identical technical wells per condition to account for localized well-edge effects or pipetting variations.
- Defining the experimental unit: To ensure statistical validity and avoid artifacts, include a minimum of three technical repeats for each experiment. Individual cells measured within a single well constitute technical subsamples; similarly, three such wells would correspond to three technical replicates. Similarly, three biological replicates (independent experiments) are suggested for each sample (N = 3).
- For each distinct condition within a biological run, randomly measure between 50 and 100 individual cells across multiple fields of view. For each biological replicate, calculate the mean or median value of these cell measurements. Use these mean or median values from biological replicates for all the downstream comparative statistical tests.
- Distribution profiling and hypothesis testing
- Subject the biological replicate datasets to normality assessment using the Shapiro-Wilk or D’Agostino-Pearson tests for normality before implementing parametric methods (e.g., comparison of means).
- Two-group comparisons: When comparing a single test group directly against a single control background (e.g., wild-type C. albicans growth in pure medium versus growth in isolated C. glabrata CFS), apply an unpaired, two-tailed Student’s t-test, provided the dataset follows normal distribution.
- If the data deviate significantly from a normal distribution, shift to a non-parametric alternative, such as the Mann-Whitney U test (Wilcoxon rank-sum test), which compares median values of ranked data and is not dependent on the absolute values of the data. The non-parametric tests are also known to be unbiased towards outlier values.
- Multiple-group evaluations: When assessing three or more genetic lines or treatment combinations simultaneously (e.g., tracking morphological variations across MATa/a, MATα/α, and MATa/α strains), perform a standard One-Way Analysis of Variance (ANOVA) followed by Tukey’s post-hoc test for multiple pairwise comparisons. If the test for normality is violated, substitute the parametric framework with a non-parametric Kruskal-Wallis test followed by Dunn’s post-hoc multiple comparisons analysis.
- Graphical representation and data visualization: Perform all statistical analyses and graphical representations using statistical and graphing software.
NOTE: Equivalent software can be used to perform statistical analyses and prepare graphical representations. Data from the membrane insert well plate and CFS assays can be represented using column-scatter plots, jitter-violin plots, or jitter box plots, which represent the median (central line) and the 95% CI (used in this study), or the median (central line) and the first and third quartiles (top and bottom lines, respectively). - Set the threshold for formal statistical significance at an alpha level of p < 0.05. Maintain conventional notation configurations across all generated data figures and tables. For example: ns: p > 0.05; *: p < 0.05; **: p < 0.01; ***: p < 0.001; ****: p < 0.0001.
Results
Contactless co-culture assays to explore inter-species interactions
Soluble, low-abundance extracellular signalling molecules often mediate key communication events during mixed microbial cohabitation. Such dynamics were evaluated using two contactless cell-based setups, designed to analyse interaction patterns between C. albicans and C. glabrata, while preventing direct physical cell-to-cell contact. The first configuration utilized an integrated membrane insert well plate culture system, where the two populations were physically separated by an inert, 0.4 µm porous polycarbonate membrane, allowing for unhindered bidirectional diffusion of secreted molecules across the barrier. The second setup monitored the growth of C. albicans yeast cells cultivated directly in microtiter plates containing cell-free supernatant harvested from stationary-phase C. glabrata cultures (CgCFS).
Consistent with the previous screens30, wild-type heterozygous diploid C. albicans cells (SC5314) readily developed true hyphae in response to either C. glabrata cells separated by the membrane insert barrier or to the filtered CgCFS. Whereas, cells maintained in pure negative control medium (GMM or YPD) remained predominantly in the budding yeast and pseudohyphal form (Figure 2A). The comparative analyses demonstrated consistency between the two assay setups. Both the assays yielded comparable values across all structural metrics, including filament length, volume, and thickness (Figure 2). The difference in morphological parameters was considered significant if the p-value from the appropriate statistical tests, followed by post-hoc tests for multiple comparisons, met the criterion of 0.05. These observations showed that C. albicans cells did not have a significant difference in the length of the true hyphae, induced by C. glabrata cells within the membrane insert well plate setup (39.66 µm ± 6.81 µm) or when exposed to the filtered CgCFS (37.13 µm ± 6.50 µm; Figure 2B). Similarly, the volumes of these induced filaments in the membrane insert well plate system (112.10 µm3± 22.59 µm3) were also not significantly different from those in the CgCFS conditioned medium (109.78 µm3± 34.69 µm3; Figure 2C). Furthermore, measurements of filament diameter confirmed that average hyphal thickness remained consistent between the two setups, with values of 1.89 ± 0.10 µm for the membrane insert well plate configuration and 1.92 µm ± 0.23 µm for the CgCFS treatment (Figure 2D).
Ploidy states and mating-type configurations alter in vitro morphological dimensions
Roles of ploidy levels and mating-locus architectures in directing dimorphic transitions have been established in different fungal model systems. Here, the analytical tracking pipeline was applied to quantify filamentation metrics, specifically hyphal length, structural volume, thickness, and the corresponding mother yeast cell volume, across a panel of haploid (MATa or MATα) and diploid (MATa/a, MATα/α, or MATa/α) C. albicans strains.
Structural profiling revealed that upon exposure to either the inductive CgCFS secretome or the positive serum control, the homozygous diploid alpha strain (MATα/α) formed filaments with significantly longer axes (45.56 µm ± 9.24 µm and 46.62 µm ± 9.07 µm) and larger volume (125.24 µm3 ± 39.94 µm3 and 119.45 µm3 ± 37.32 µm3), when compared with homozygous diploid MATa/a strain (Figure 3A,C). While standard clinical isolates of C. albicans exist predominantly as heterozygous diploids, the reference MATa/α strain exhibited longer filaments and larger volumes relative to the MATa/a strain, following induction (particularly with serum). However, they were significantly less than the homozygous MATα/α strain (Figure 3B,D).
Concurrently, the haploid strains showed an inverse pattern, where the haploid MATa strain had a significant increase in hyphal length compared to the haploid MATα strain under both induction conditions (CgCFS: 22.06 µm ± 5.41 µm versus 17.58 µm ± 4.12 µm; Serum: 23.71 µm ± 6.59 µm versus 21.00 µm ± 5.29 µm; Figure 4A). Interestingly, this increase in length within the haploid background translated to an increase in hyphal volume (38.84 µm3 ± 19.58 µm3 versus 34.25 µm3 ± 19.62 µm3) only in response to CgCFS (Figure 4B). These initial in vitro measurements suggest a complex interaction between ploidy states and mating-type locus configurations, suggesting that the MATa and MATα loci likely contribute differently to filamentation dynamics.
To study the statistical relationships among these structural metrics across the combined datasets, Spearman’s rank correlation (ρ) and Pearson’s linear regression (R2) analyses, encompassing all tested ploidy and mating-type variants, were performed. Positive correlations were observed across all analysed pairs: hyphal length versus hyphal volume, hyphal length versus hyphal thickness, hyphal length versus mother cell volume, and total hyphal volume versus mother yeast cell volume (Figure 5, Supplementary Table 1 and Supplementary Table 2).
The strongest relationship was observed between hyphal length and computed hyphal volume (ρ = 0.91; Figure 5A). Conversely, the weakest correlation was between the mother yeast cell’s starting volume and emergent hyphal volume (ρ = 0.63; Figure 5C). Additionally, hyphal thickness did not correlate as strongly with hyphal length as hyphal volume did (Figure 5A,D). The mother cell volume, hyphal length, and hyphal thickness did not have statistically significant differences in their correlations (Figure 5B,D). These geometric distributions suggest that a larger initial mother yeast cell volume need not result in longer hyphae or higher volume.
In summary, these results demonstrate the utility of both the membrane insert well plate and the CFS-based assays for visualizing and quantifying morphogenetic variations in C. albicans without any physical contact. The data generated by this protocol reveal different morphological characteristics across different ploidy backgrounds and mating-type configurations. These non-contact assay setups offer a flexible, scalable methodology that can be adapted to investigate inter-species signalling dynamics across diverse microbial combinations.
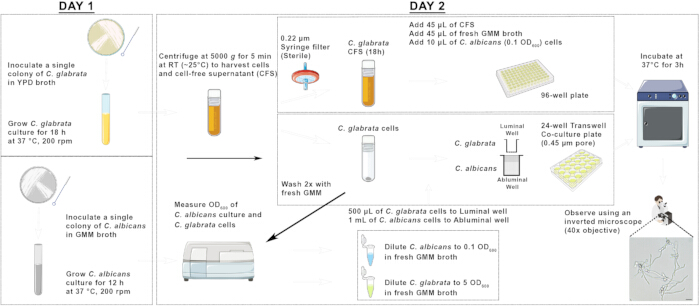
Figure 1: A schematic representation of the membrane insert well plate co-culture and CFS-based hyphal induction assays with Candida species. Please click here to view a larger version of this figure.
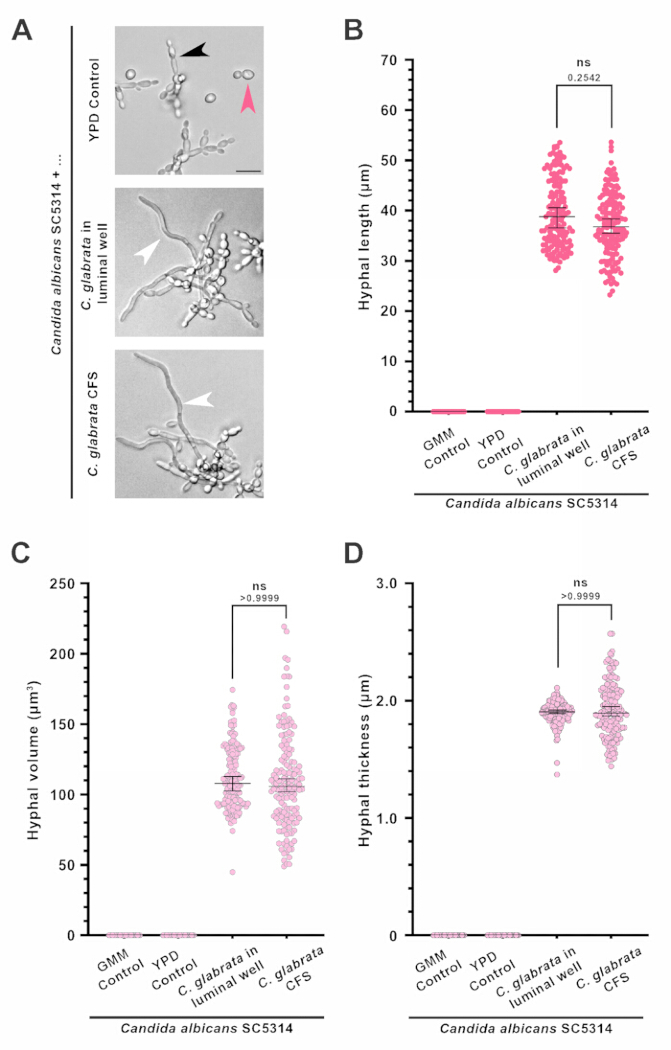
Figure 2: Comparison of hyphal morphologies observed between the membrane insert well plate and CFS-based contactless assays. (A) Representative bright-field micrographs depicting the morphological response of C. albicans to YPD (control), C. glabrata in a membrane insert well plate setup, or to the medium conditioned with the C. glabrata cell-free supernatant (CFS). Pink, black, and white arrowheads denote the yeast, pseudohyphae, and true hyphae, respectively. Scale bar, 10 µm. Hyphal lengths (B), hyphal volumes (C), and hyphal thickness (D) of a heterozygous diploid C. albicans strain (SC5314) observed in response to C. glabrata cells in a membrane insert well plate setup or C. glabrata CFS. The data represent median ± 95% confidence intervals, from three independent biological experiments, with n = 50 cells. ns, not significant: p > 0.05. Please click here to view a larger version of this figure.
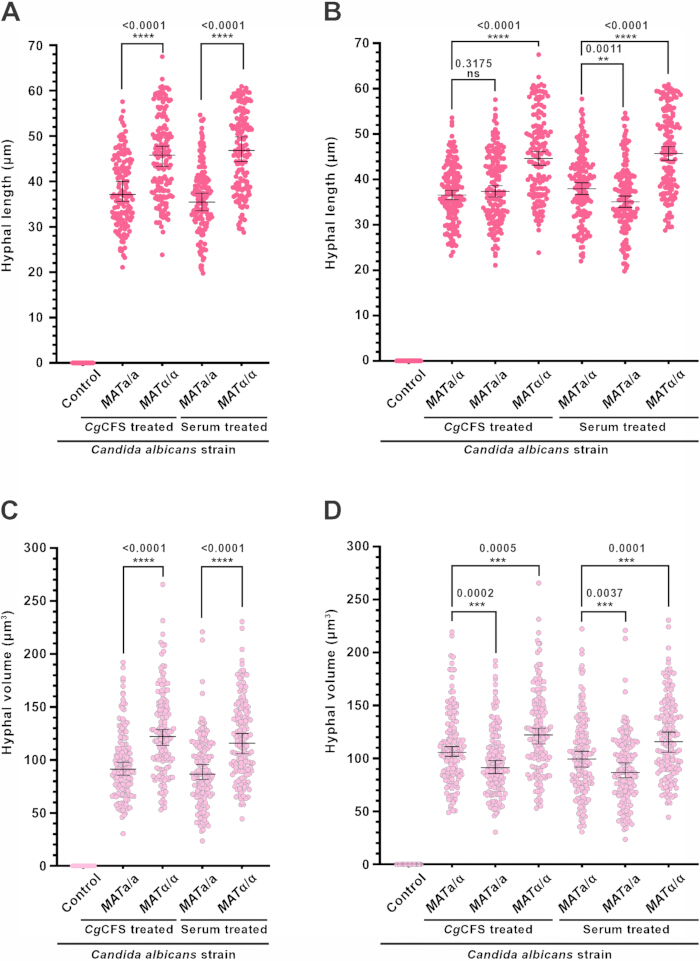
Figure 3: Mating type and zygosity have significant effects on hyphal morphology in diploid C. albicans. Plots depicting comparative hyphal lengths, in response to the indicated inducer molecule, between homozygous diploids (A) and between hetero- and homozygous diploids (B) of C. albicans. Similarly, the comparative hyphal volumes, in response to the inducer molecules mentioned, are shown between homozygous diploids (C) and between hetero- and homozygous diploids (D). Control: YPD, the non-hyphal-inducing medium control. The data represent median ± 95% confidence intervals, from three independent biological experiments, with n = 50 cells. Indicated numbers on the top of the plot are p-values, determined by the Wilcoxon rank sum test comparisons. **: p < 0.01, ***: p < 0.001, ****: p < 0.0001, statistically significant; ns, not significant: p > 0.05. Please click here to view a larger version of this figure.
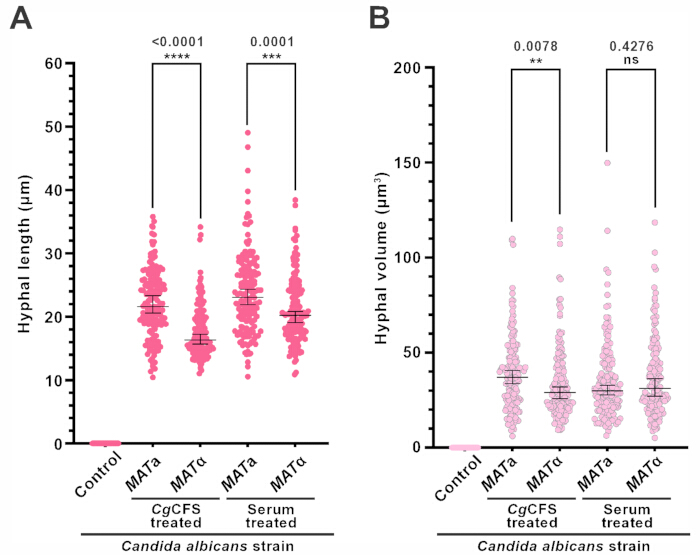
Figure 4: Hyphal characteristics in haploid C. albicans in response to different molecular inducers. The plots depict the hyphal lengths (A) and hyphal volumes (B) in haploid C. albicans strains, in response to the indicated inducer. Control: YPD, the non-hyphal-inducing medium control. The data represent median ± 95% confidence intervals, from three independent biological experiments, with n = 50 cells. Indicated numbers denote p-values, determined by the Wilcoxon rank sum test. **: p < 0.01, ***: p < 0.001, ****: p < 0.0001, statistically significant; ns, not significant: p > 0.05. Please click here to view a larger version of this figure.
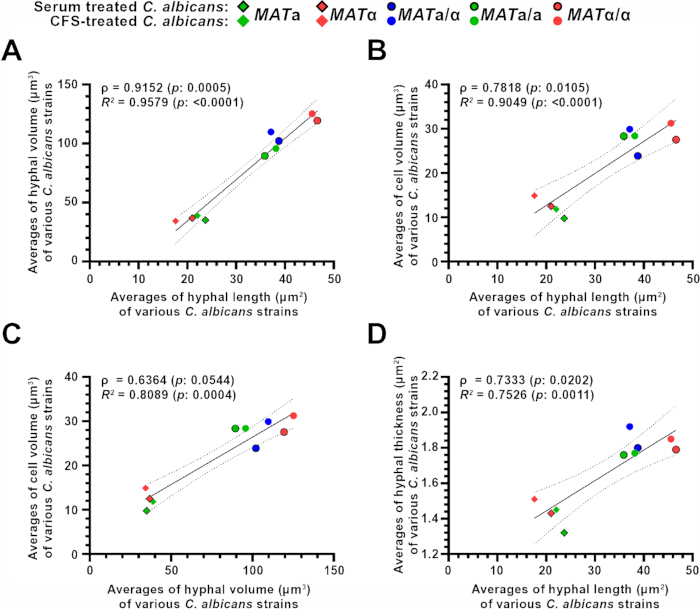
Figure 5: Correlation among morphological parameters corresponding with the ploidy of C. albicans. Plots show the Spearman correlation and linear regression among the morphological parameters used in this study, i.e., hyphal volume and hyphal length (A), cell volume and hyphal length (B), cell volume and hyphal volume (C), and hyphal thickness and hyphal length (D). ρ: Spearman correlation coefficient; R2: coefficient of determination from linear regression analysis; p: p-value. Please click here to view a larger version of this figure.
| Strain | Species | Ploidy | Genotype | Source |
| CBS138 | Candida glabrata | Haploid (1n) | MATα | ATCC 2001 |
| SC5314 | Candida albicans | Diploid (2n) | Heterozygous (MATa/α) | ATCC MYA-2876 |
| RBY1132 | Candida albicans | Diploid (2n) | Homozygous (MATa/a); arg4Δ/arg4Δ, leu2Δ/leu2Δ, his1Δ/his1Δ, URA3/ura3Δ | Schaefer, D., Côte, P., Whiteway, M., Bennett, R.J. Barrier Activity in Candida albicans Mediates Pheromone Degradation and Promotes Mating. Eukaryotic Cell. 6 (6), 907–918, doi: 10.1128/ec.00090-07 (2007). |
| RBY1133 | Candida albicans | Diploid (2n) | Homozygous (MATα/α); arg4Δ/arg4Δ, leu2Δ/leu2Δ, his1Δ/his1Δ, URA3/ura3Δ | |
| GZY896 | Candida albicans | Haploid (1n) | Homozygous (MATa); ura3∆::imm434 his4 gal1∆::ura3∆::HIS4 | Hickman, M.A. et al. The ‘obligate diploid’ Candida albicans forms mating-competent haploids. Nature. 494 (7435), 55–59, doi: 10.1038/nature11865 (2013). |
| GZY803 | Candida albicans | Haploid (1n) | Homozygous (MATα); his4 ura3Δ::HIS4 |
Table 1: Strains of Candida albicans and Candida glabrata utilized in this study. The table outlines the designations, explicit genotypes, ploidy states, and mating-type zygosity for the fungal strains evaluated in the contactless membrane insert well plate co-culture and Cell-Free Supernatant (CFS)-based assays.
Supplementary Table 1: Data of statistical analyses performed on various C. albicans morphological parameters. Please click here to download this file.
Supplementary Table 2: Raw values of all biological replicates of various C. albicans morphological parameters evaluated in this study.Please click here to download this file.
Supplementary File 1: List of media used in this study with their compositions.Please click here to download this file.
Discussion
Previous report, using a membrane insert well plate and CFS-based assay, showed that C. albicans develops hyphae in response to C. glabrata cells or their CFS. However, this response was not induced by the other yeasts, such as Saccharomyces cerevisiae and Candida dubliniensis30. Further, this hyphal response was not restricted to the C. albicans SC5314 laboratory reference strain alone, but also occurred in other genomic backgrounds, including the clinical isolate WUM5A30. In this protocol, a standardized workflow was built upon these findings to quantify three morphological metrics: hyphal length, hyphal volume, and hyphal thickness. Furthermore, these morphological factors were used to assess how variations in ploidy and mating-type locus status affect the morphological characteristics of C. albicans in response to a secreted inducer molecule.
The contactless methodologies described here provide a simple experimental framework for visualising and analysing the morphometric outcomes of soluble cross-species signalling cues. While the membrane insert well plate allows for bidirectional diffusion between active cultures, the CFS-based assay provides a scalable format because the required inductive components are harvested independently of the downstream target culture. Maintaining a ratio of approximately 1:50 (C. albicans to C. glabrata) in the membrane insert well plate setup is required for assay consistency. This concentration gradient ensures an adequate flux of the soluble inductive molecules across the membrane barrier while remaining below the accumulation thresholds of endogenous quorum-sensing inhibitors, such as farnesol, which can suppress C. albicans filamentation kinetics31,32. Similarly, a critical step in the CFS-based assay is the 18-h incubation period required for the C. glabrata source culture to uniformly reach the late stationary growth phase. If the incubation period for the C. glabrata culture is less than 12 h or more than 24 h, the harvested CFS is less likely to have an optimum concentration of the specific inducer molecule studied here, leading to suboptimal hyphal induction. The appropriate growth stage to harvest the CFS or the ratio of cultures needs to be standardised for any new experimental objective and/or new combinations of microbial species.
To maximize assay reproducibility across different laboratory settings, the following key procedural refinements are recommended. The use of Glucose Minimal Medium (GMM) for the overnight cultivation of all diploid C. albicans lines is recommended. Use of GMM suppresses the background auto-filamentation frequently observed in nutrient-rich YPD medium. Such auto-filamentation was also observed in other studies, although the underlying mechanism is still unclear33. Complete physical removal of the polycarbonate membrane insert prior to image acquisition is also recommended to eliminate light-scattering and optical aberrations that can interfere during high-magnification bright-field microscopy.
While these contact-free configurations help in separating out the roles of soluble signalling components, they possess specific experimental challenges. For example, contact-free assays are prone to minor risks such as membrane rupture due to improper handling and, therefore, microbial crossover. Thus, attention should be paid while positioning the pipette tips, taking care that the tips touch the chamber walls of the inserts, and not the membrane, during sampling. Further, physical cross-contamination can also occur between compartments due to incorrect (larger) pore sizes, which can be easily addressed by using inserts with an appropriate membrane pore size. Fungal overgrowth or extensive biofilm deposition can cover the porous membrane. This is addressed by restricting initial inoculations to an OD600 = 0.1 and not incubating beyond 12 h. Additionally, microbes may not distribute homogeneously within the device wells, often clustering or attaching near the membrane, which can lead to unexpected biases in optical density measurements. Furthermore, because these systems physically separate the two populations, they cannot replicate or evaluate interactions that depend on direct physical cell-to-cell contact. For example, mixed-species biofilm maturation, mechanical co-aggregation, or signalling driven by surface-anchored cell wall adhesins. While these plate-based assays provide an effective endpoint snapshot of early filamentation kinetics (at 3 h), they do not capture long-term growth dynamics or spatial behaviour. For investigators requiring continuous real-time tracking over extended periods, specialized microfluidic perfusion channels or automated live-cell imaging chambers may provide a more suitable alternative.
Cellular geometry is fundamentally linked to metabolic efficiency, with the surface area-to-volume (SA/V) ratio serving as a key driver for nutrient acquisition and intracellular transport. In dimorphic and filamentous fungi, transitioning into an elongated hyphal morphotype functions as a structural adaptation to maintain an optimized SA/V ratio. This allows for distributed nutrient absorption along the extended filament wall while sustaining hyphal tip-directed metabolic processes34,35,36,37. However, our study shows that morphometric scaling is not uniformly proportional across different ploidy states and mating-type locus configurations.
The morphometric datasets generated via this tracking protocol reveal clear structural scaling trends correlated with ploidy, with haploid lines consistently exhibiting smaller absolute values across all geometric metrics than corresponding diploid strains (Figure 5). Within the diploid background, the homozygous MATα/α configuration exhibited enhanced filamentation kinetics (length and volume) relative to MATa/a or MATa/α strains under these in vitro conditions. Given that enhanced filamentation is frequently associated with increased penetration capacity, it is unclear why clinical isolates of C. albicans are predominantly isolated as heterozygous diploids (MATa/α). It is possible that, within an immunocompetent host, the heterozygous state provides a broader fitness advantage for long-term commensal colonization. In other words, the structural characteristics of the MATa/α morphotype are optimized for survival against host immune surveillance. Therefore, future investigations should leverage these standardized co-culture systems to systematically evaluate the comparative fitness of different mating-type homozygotes under varied selective pressures.
Previous studies have documented that vacuolar morphology, fission-fusion dynamics, and structural expansion play important roles in managing the internal volume and turgor pressure of elongating fungal filaments. For example, in the rice blast pathogen Magnaporthe oryzae, distinct transitions between slender vegetative hyphae and bulbous invasive structures are tightly coordinated with changes in vacuolar organization38,39,40. However, the current protocol did not directly monitor vacuolar dynamics during C. albicans filamentation, tracking these internal organelle changes in relation to total structural volume represents an informative avenue for future investigation. Additionally, further research is warranted to determine why specific fungal-derived secretome components drive different morphological scaling kinetics than host-derived chemical inducers such as serum.
The contact-free co-culture methods detailed in this protocol can be adapted to investigate inter-species and cross-kingdom interactions, such as the signalling dynamics between opportunistic bacterial populations and dimorphic fungi. Furthermore, because these 96-well and 24-well formats are scalable, this quantitative platform can be utilized for chemical screens. Examples of which include identification of small-molecule inhibitors or novel antifungal compounds to selectively disrupt secretome-stimulated filamentation pathways without directly impacting baseline cell viability.
Disclosures
The authors declare no competing or conflicting interests.
Acknowledgements
This work was supported by the DBT-Wellcome Trust India Alliance Intermediate Fellowship (IA/I/19/1/504294) awarded to RNP. KBSS was supported by the Ahmedabad University Special Research Grant (AU/SRG/SAS/20-21/07_KS_03.25) and the SERB-Core Research Grant (URBSASE23A6/SERB/23-24/KS_02.27). The icons used in Figure 1 are adapted from Servier Medical Art (https://smart.servier.com/), licensed under CC BY 4.0 (https://creativecommons.org/licenses/by/4.0/), and from BioArt Source, NIAID, NIH.
Materials
| Name | Company | Catalog Number | Comments |
|---|---|---|---|
| 0.22 μm PES syringe filter | Millipore (Merck) | SLGPR33RS | |
| Agar agar | HiMedia | GRM666 | |
| Glucose | HiMedia | GRM016 | |
| Nunc 24-well Carrier Plate with Cell Culture Inserts (0.4 μm) | Thermo Scientific | 141002 | |
| Nunc BioLite 96 Well Multidish, Cell culture treated, Flat bottom | Thermo Scientific | 130188 | |
| Proteose Peptone | HiMedia | RM005 | |
| Uridine | Sigma | U6381 | |
| Yeast extract | HiMedia | RM027 | |
| Yeast Nitrogen Base, with ammonium sulphate, without amino acids | HiMedia | M878 |
References
- Peleg AY, Hogan DA, Mylonakis E. Medically important bacterial-fungal interactions. Nat Rev Microbiol. 2010;8(5):340-349.
- Waters CM, Bassler BL. Quorum sensing: cell-to-cell communication in bacteria. Annu Rev Cell Dev Biol. 2005;21:319-346.
- Foster KR, Bell T. Competition, not cooperation, dominates interactions among culturable microbial species. Curr Biol. 2012;22(19):1845-1850.
- Carolus H, Van Dyck K, Van Dijck P. Candida albicans and Staphylococcus species: a threatening twosome. Front Microbiol. 2019;10:2162.
- Pasman R, et al. Candida albicans and Staphylococcus aureus reciprocally promote their virulence factor secretion and pro-inflammatory effects. Front Cell Infect Microbiol. 2025;15:1629373.
- Grandclément C, Tannières M, Moréra S, Dessaux Y, Faure D. Quorum quenching: role in nature and applied developments. FEMS Microbiol Rev. 2016;40(1):86-116.
- Goers L, Freemont P, Polizzi KM. Co-culture systems and technologies: taking synthetic biology to the next level. J R Soc Interface. 2014;11(96):20140065.
- Burmeister A, Grünberger A. Microfluidic cultivation and analysis tools for interaction studies of microbial co-cultures. Curr Opin Biotechnol. 2020;62:106-115.
- Kapoore RV, Padmaperuma G, Maneein S, Vaidyanathan S. Co-culturing microbial consortia: approaches for applications in biomanufacturing and bioprocessing. Crit Rev Biotechnol. 2022;42(1):46-72.
- Kalluri R. The biology and function of fibroblasts in cancer. Nat Rev Cancer. 2016;16(9):582-598.
- Deveau A, et al. Bacterial-fungal interactions: ecology, mechanisms and challenges. FEMS Microbiol Rev. 2018;42(3):335-352.
- Temkin MI, Carlson CM, Stubbendieck AL, Currie CR, Stubbendieck RM. High throughput co-culture assays for the investigation of microbial interactions. J Vis Exp. 2019;(152). doi:10.3791/60275.
- Cecchelli R, et al. A stable and reproducible human blood-brain barrier model derived from hematopoietic stem cells. PLoS One. 2014;9(6):e99733.
- Wodzanowski KA, Cassel SE, Grimes CL, Kloxin AM. Tools for probing host-bacteria interactions in the gut microenvironment: from molecular to cellular levels. Bioorg Med Chem Lett. 2020;30(10):127116.
- Luo Y, McAuley DF, Fulton CR, Pessoa JS, McMullan R, Lundy FT. Targeting Candida albicans in dual-species biofilms with antifungal treatment reduces Staphylococcus aureus and MRSA in vitro. PLoS One. 2021;16(4):e0249547.
- Justus CR, Marie MA, Sanderlin EJ, Yang LV. Transwell in vitro cell migration and invasion assays. Methods Mol Biol. 2023;2644:349-359.
- McCarty NS, Ledesma-Amaro R. Synthetic biology tools to engineer microbial communities for biotechnology. Trends Biotechnol. 2019;37(2):181-197.
- Virgo M, Mostowy S, Ho BT. Emerging models to study competitive interactions within bacterial communities. Trends Microbiol. 2025;33(6):688-700.
- Moutinho TJ, Panagides JC, Biggs MB, Medlock GL, Kolling GL, Papin JA. Novel co-culture plate enables growth dynamic-based assessment of contact-independent microbial interactions. PLoS One. 2017;12(8):e0182163.
- Gnecchi M, Zhang Z, Ni A, Dzau VJ. Paracrine mechanisms in adult stem cell signaling and therapy. Circ Res. 2008;103(11):1204-1219.
- Hogan DA, Vik Å, Kolter R. A Pseudomonas aeruginosa quorum-sensing molecule influences Candida albicans morphology. Mol Microbiol. 2004;54(5):1212-1223.
- Poon Y, Hui M. Inhibitory effect of lactobacilli supernatants on biofilm and filamentation of Candida albicans, Candida tropicalis, and Candida parapsilosis. Front Microbiol. 2023;14. doi:10.3389/fmicb.2023.1105949.
- Huh D, Matthews BD, Mammoto A, Montoya-Zavala M, Hsin HY, Ingber DE. Reconstituting organ-level lung functions on a chip. Science. 2010;328(5986):1662-1668.
- Huh D, et al. Microfabrication of human organs-on-chips. Nat Protoc. 2013;8(11):2135-2157.
- Bhatia SN, Ingber DE. Microfluidic organs-on-chips. Nat Biotechnol. 2014;32(8):760-772.
- Itani A, Shida Y, Ogasawara W. A microfluidic device for simultaneous detection of enzyme secretion and elongation of a single hypha. Front Microbiol. 2023;14:1125760.
- Beneyton T, Thomas S, Griffiths AD, Nicaud JM, Drevelle A, Rossignol T. Droplet-based microfluidic high-throughput screening of heterologous enzymes secreted by the yeast Yarrowia lipolytica. Microb Cell Fact. 2017;16:18.
- Xu XL, et al. Bacterial peptidoglycan triggers Candida albicans hyphal growth by directly activating the adenylyl cyclase Cyr1p. Cell Host Microbe. 2008;4(1):28-39.
- Yeast extract-peptone-dextrose (YPD) medium (liquid or solid). Cold Spring Harb Protoc. 2017;2017(8):pdb.rec090563.
- Parnandi VA, Trivedi PM, Panchal H, Suryawanshi G, Patkar RN. A small Candida glabrata protein promotes hyphal growth in C. albicans during mixed-species invasive candidiasis. Curr Biol. 2026;36(1):1-15.e9.
- Davis-Hanna A, Piispanen AE, Stateva LI, Hogan DA. Farnesol and dodecanol effects on the Candida albicans Ras1-cAMP signalling pathway and the regulation of morphogenesis. Mol Microbiol. 2008;67(1):47-62.
- Polke M, et al. A functional link between hyphal maintenance and quorum sensing in Candida albicans. Mol Microbiol. 2017;103(4):595-617.
- Su C, Yu J, Sun Q, Liu Q, Lu Y. Hyphal induction under the condition without inoculation in Candida albicans is triggered by Brg1-mediated removal of NRG1 inhibition. Mol Microbiol. 2018;108(4):410-423.
- Senesi N, Wilkinson KJ. Biophysical Chemistry of Fractal Structures and Processes in Environmental Systems. Chichester: John Wiley & Sons; 2008: ISBN: 978-0-470-01474-5.
- Bayry J, Aimanianda V, Guijarro JI, Sunde M, Latgé JP. Hydrophobins—unique fungal proteins. PLoS Pathog. 2012;8(5):e1002700.
- Ojkic N, Serbanescu D, Banerjee S. Surface-to-volume scaling and aspect ratio preservation in rod-shaped bacteria. eLife. 2019;8:e47033.
- Li X, de Souza RA, Heinemann M. The rate of glucose metabolism sets the cell morphology across yeast strains and species. Curr Biol. 2025;35(4):788-798.e4.
- Mochizuki S, Minami E, Nishizawa Y. Live-cell imaging of rice cytological changes reveals the importance of host vacuole maintenance for biotrophic invasion by blast fungus, Magnaporthe oryzae. MicrobiologyOpen. 2015;4(6):952-966.
- Fernandez J, Orth K. Rise of a cereal killer: the biology of Magnaporthe oryzae biotrophic growth. Trends Microbiol. 2018;26(7):582-597.
- Wengler MR, Talbot NJ. Mechanisms of regulated cell death during plant infection by the rice blast fungus Magnaporthe oryzae. Cell Death Differ. 2025;32(5):793-801.
Reprints and Permissions
This article has been published
Video Coming Soon